Multiple Linear Regression Probabilistic Multiple Regression Model 0

Multiple Linear Regression Probabilistic Multiple Regression Model = 0 + 1 X 1 + 2 X 2 + 3 X 3 +. . . + k. Xk+ Y = the value of the dependent (response) variable 0 = the regression constant 1 = the regression coefficient of independent variable 1 2 = the regression coefficient of independent variable 2 k = the regression coefficient of independent variable k k = the number of independent variables = the error of prediction Y

Multiple Variable Prediction Equation:

Model for Two Independent Variables Population Model Estimated Model

Model is Now a Plane in 3 -D Space Y
 Test the Regression Model (k Indep Variables): H 0:")
General Multiple Regression Model 1) Test the Regression Model (k Indep Variables): H 0: Model is Not Significant ; β 1=β 2=β 3=. . βk=0 HA: Model is Significant ; At Least One βi≠ 0 R: F > Fα(k, n-k-1) F = MSR/MSE ANOVA Table: Source df SS MS Regress k SSR MSR Error n-k-1 SSE MSE Total n-1 TSS Multiple Coefficient of Determination: R 2 = SSR/TSS (% of Variation of Y Explained by all the X's) Adjusted R Squared
 Test the Regression Model Coefficients: H 0: βi = 0 ; No Linear")
2) Test the Regression Model Coefficients: H 0: βi = 0 ; No Linear Depi = 1, 2, 3, …, k HA: βi ≠ 0 ; Linear Dep R: t > tα/2, df=n-k-1 t = bi/Sbi t < -tα/2, df=n-k-1 Interval Estimate for Coefficients: bi - e ≤ βi ≤ b i + e e = t • Sbi Correlation Matrix - Test for Significant Correlation H 0: ρ = 0 ; No Sig Correlation HA: ρ ≠ 0 ; Sig Correlation R: t > tα/2, df=n-2 t < -tα/2, df=n-2

Example 1: Regress Sales on TV Ads and News Ads SAS Program: data; input sales tv news; datalines; 10 0 1 10 1 0 15 2 0 20 2 2 30 2 3 35 5 0 30 0 5 40 3 3 40 4 3 proc corr; var sales tv news; proc reg; model sales=tv news; run;

SAS Output:
")
Example 2: Housing Cost Model (p. 597)

Example 3: Regress Car Rating on Ride, Handling, & Comfort

Correlation Matrix:

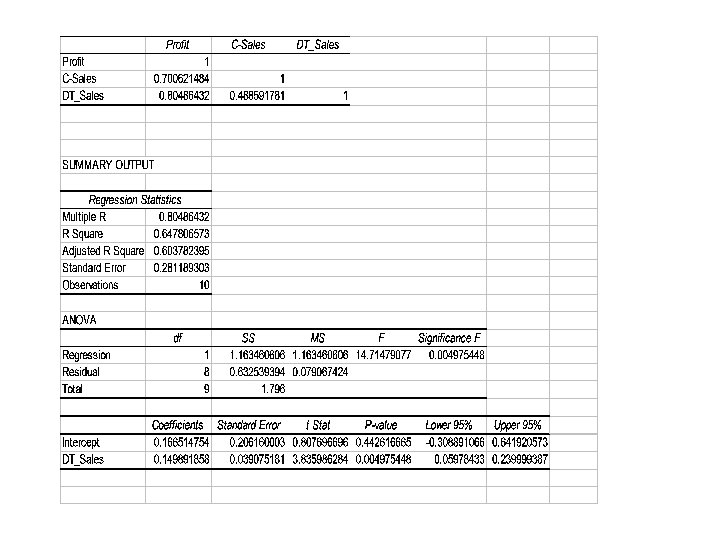
Example 4: Regress Profit on Counter Sales and Drive-thru Sales

Wine Tasting with a PC

Mallows Coefficient Plot
- Slides: 15