Statistics and Regression Analysis 9 1 Understand the


 is used to")
 Strong relationships Weak relationships y y x y x x")


+(F 3*$F$28)+$F$26 Age coefficient Gender coefficient")
 =(E 3*$F$27)+(F 3*$F$28)+$F$26 Age coefficient Gender")
 =(E 3*$F$27)+(F 3*$F$28)+$F$26 Age coefficient Gender")


- Slides: 29
Statistics and Regression Analysis 9 -1
• Understand the basic types of data • Conduct basic statistical analyses in Excel • Generate descriptive statistics and other analyses using the Analysis Tool. Pak • Use regression analysis to predict future values Copyright © 2014 Pearson Education, Inc. Publishing as Prentice Hall. 2
Analysis Tool. Pak • Add-in • After installed, found on Data tab, as Data Analysis • Descriptive statistics Copyright © 2014 Pearson Education, Inc. Publishing as Prentice Hall. 3
Copyright © 2014 Pearson Education, Inc. Publishing as Prentice Hall. 4
Regression Analysis Regression analysis is a tool for building statistical models that characterize relationships among a dependent variable and one or more independent variables, all of which are numerical. Simple linear regression involves a single independent variable. Multiple regression involves two or more independent variables. 9 -5
Purpose of Regression Analysis • The purpose of regression analysis is to analyze relationships among variables. • The analysis is carried out through the estimation of a relationship and the results serve the following two purposes: 1. Answer the question of how much y changes with changes in each of the x's (x 1, x 2, . . . , xk), • Y is the dependent variable 2. Forecast or predict the value of y based on the values of the X's • X is the independent variable
Simple Linear Regression �Finds a linear relationship between: - one independent variable X and - one dependent variable Y �First prepare a scatter plot to verify the data has a linear trend. �Use alternative approaches if the data is not linear. Figure 9. 1 9 -7
Scatter Plots and Correlation • A scatter plot (or scatter diagram) is used to show the relationship between two variables • Correlation analysis is used to measure strength of the association (linear relationship) between two variables • Only concerned with strength of the relationship • No causal effect is implied
Scatter Plot Examples (continued) Strong relationships Weak relationships y y x y x x
Examples of Approximate r Values y y y r = -1 x r = -. 6 y x r=0 y r = +. 3 x r = +1 x x
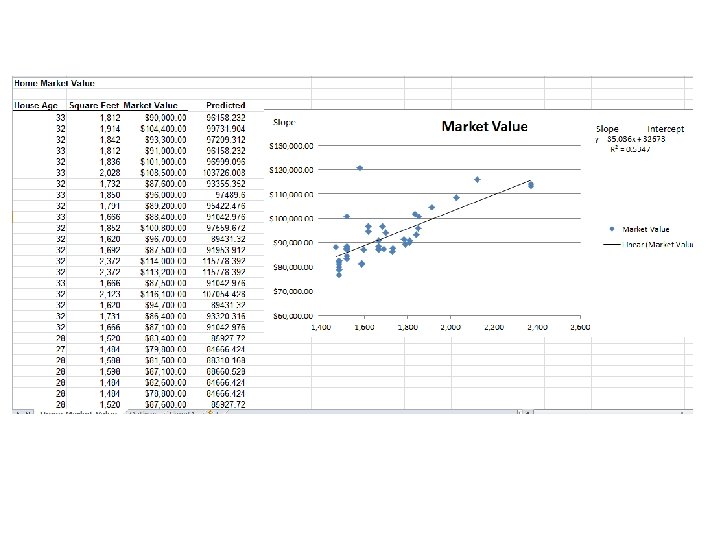
Simple Linear Regression Example 9. 1 Home Market Value Data Size of a house is typically related to its market value. X = square footage Y = market value ($) Figure 9. 2 The scatter plot of the full data set (42 homes) indicates a linear trend. Figure 9. 3 9 -11
Simple Linear Regression Finding the Best-Fitting Regression Line �Two possible lines are shown below. �Line A is clearly a better fit to the data. �We want to determine the best regression line. Y = b 0 + b 1 X ^ where b 0 is the intercept b 1 is the slope Figure 9. 4 9 -12
Least Squares Line The most widely used criterion for measuring the goodness of fit of a line The line that gives the best fit to the data is the one that minimizes this sum; it is called the least squares line or sample regression line. The slope of a regression line represents the rate of change in y as x changes. Because y is dependent on x, the slope describes the predicted values of y given x.
Simple Linear Regression Using Excel to Find the Best Regression Line • Market value = 32673 + 35. 036(square feet) The regression model explains variation in market value due to size of the home. It provides better estimates of market value than simply using the average. Figure 9. 5 9 -14
Linear Relations • We know from algebra lines come in the form y = mx + b, where m is the slope and b is the y-intercept. • In statistics, we use y = a + bx for the equation of a straight line. Now a is the intercept and b is the slope. • The slope (b) of the line, is the amount by which y increases when x increase by 1 unit. • This interpretation is very important. • The intercept (a), sometimes called the vertical intercept, is the height of the line when x = 0.
Simple Linear Regression Using Excel Functions to Find Least-Squares Coefficients �Slope = 35. 036 =SLOPE(C 4: C 45, B 4: B 45) �Intercept = 32, 673 =INTERCEPT(C 4: C 45, B 4: B 45) �Estimate Y when X = 1800 square feet Y = 32, 673 + 35. 036(1800) = $95, 737. 80 Figure 9. 2 9 -17
Simple Linear Regression Excel Regression tool Data Analysis Regression Input Y Range Input X Range Labels Excel outputs a table with many useful regression statistics. Figure 9. 7 9 -18
Three Important Questions To examine how useful or effective the line summarizing the relationship between x and y, we consider the following three questions. 1. Is a line an appropriate way to summarize the relationship between the two variables? 2. Are there any unusual aspects of the data set that we need to consider before proceeding to use the regression line to make predictions? 3. If we decide that it is reasonable to use the regression line as a basis for prediction, how accurate can we expect predictions based on the regression line to be?
Simple Linear Regression Statistics in Excel’s Output �Multiple R is the correlation between actual and predicted values of the dependent variable (r varies from -1 to +1 (r is negative if slope is negative) ) �R Square the model’s accuracy in explaining the dependent variable R 2 varies from 0 (no fit) to 1 (perfect fit) �Adjusted R Square adjusts R 2 for sample size and number of X variables As the sample size increases above 20 cases per variable, adjustment is less needed (and vice versa). �Standard Error variability between observed & predicted Y variables 9 -20
Simple Linear Regression Example 9. 4 Interpreting Regression Statistics for Simple Linear Regression (Home Market Value) 53% of the variation in home market values can be explained by home size. The standard error of $7287 is less than standard deviation (not shown) of $10, 553. Figure 9. 8 9 -21
Multiple Linear Regression Multiple Regression has more than one independent variable. Simple vs. Multiple Regression • One dependent variable Y predicted from one independent variable X • One regression coefficient • r 2: proportion of variation in dependent variable Y predictable from X • One dependent variable Y predicted from a set of independent variables (X 1, X 2 …. Xk) • One regression coefficient for each independent variable • R 2: proportion of variation in dependent variable Y predictable by set of independent variables (X’s) 9 -22
Multiple Regression Analysis to Predict Future Values =(E 3*$F$27)+(F 3*$F$28)+$F$26 Age coefficient Gender coefficient Intercept coefficient Copyright © 2014 Pearson Education, Inc. Publishing as Prentice Hall. 23
Multiple Regression Analysis to Predict Future Values (con’t) =(E 3*$F$27)+(F 3*$F$28)+$F$26 Age coefficient Gender coefficient Intercept coefficien The R Square value is a conservative estimate of the independent variables’ ability to predict the value of the dependent variable. In this case, age and gender account for 65. 7% of the sales revenue generated by a customer. 24
Multiple Regression Analysis to Predict Future Values (con’t) =(E 3*$F$27)+(F 3*$F$28)+$F$26 Age coefficient Gender coefficient Intercept coefficien The Intercept coefficient, found in cell F 26, is the value at which a regression line will cross the y-axis. It is used in the formula to predict the sales amount based on age and gender found in cell G 6. The Gender coefficient and the Age coefficients are also used in the regression formula, In this case, the prediction is that women in the 60 -year-old range will spend $207. 97 at the spa. Copyright © 2014 Pearson Education, Inc. Publishing as Prentice Hall. 25
Building Good Regression Models • All of the independent variables in a linear regression model are not always significant. • We will learn how to build good regression models that include the “best” set of variables. • Banking Data includes demographic information on customers in the bank’s current market. Y Figure 9. 16 9 -26
Building Good Regression Models Predicting Average Bank Balance using Regression Home Value and Education are not significant. Figure 9. 17 9 -27
Building Good Regression Models Systematic Approach to Building Good Multiple Regression Models 1. Construct a model with all available independent variables and check for significance of each. 2. Identify the largest p-value that is greater than. 05 3. Remove that variable and evaluate adjusted R 2. 4. Continue until all variables are significant. Find the model with the highest adjusted R 2. (Do not use unadjusted R 2 since it always increases when variables are added. ) 9 -28
Building Good Regression Models Identifying the Best Regression Model • Bank regression after removing Home Value Adjusted R 2 improves slightly. Figure 9. 18 9 -29