
2 OLSR1 Simple OLSOrdinary Least Squares Regression Simple

- Slides: 25
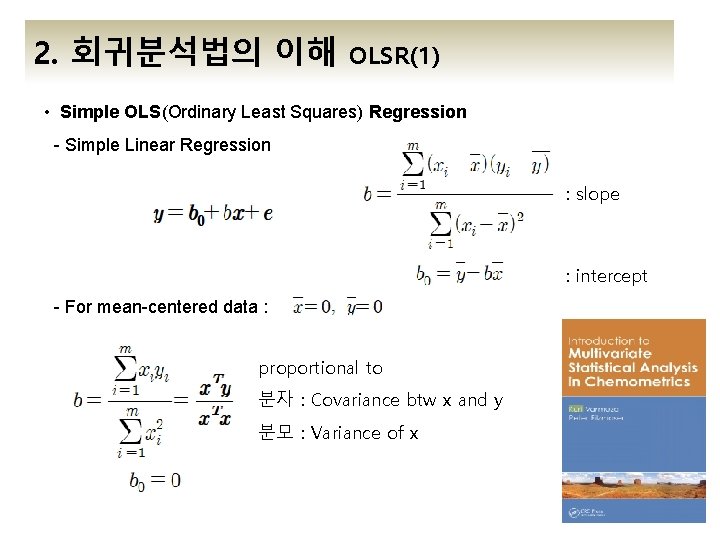
2. 회귀분석법의 이해 OLSR(1) • Simple OLS(Ordinary Least Squares) Regression - Simple Linear Regression : slope : intercept - For mean-centered data : proportional to 분자 : Covariance btw x and y 분모 : Variance of x
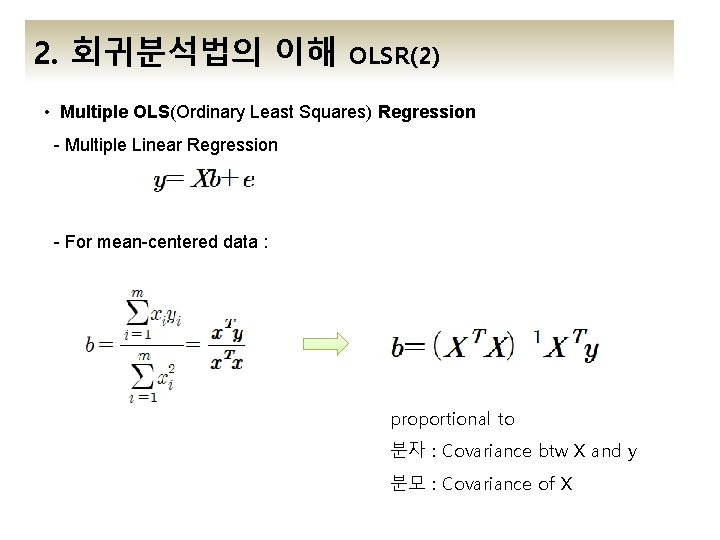
2. 회귀분석법의 이해 OLSR(2) • Multiple OLS(Ordinary Least Squares) Regression - Multiple Linear Regression - For mean-centered data : proportional to 분자 : Covariance btw X and y 분모 : Covariance of X
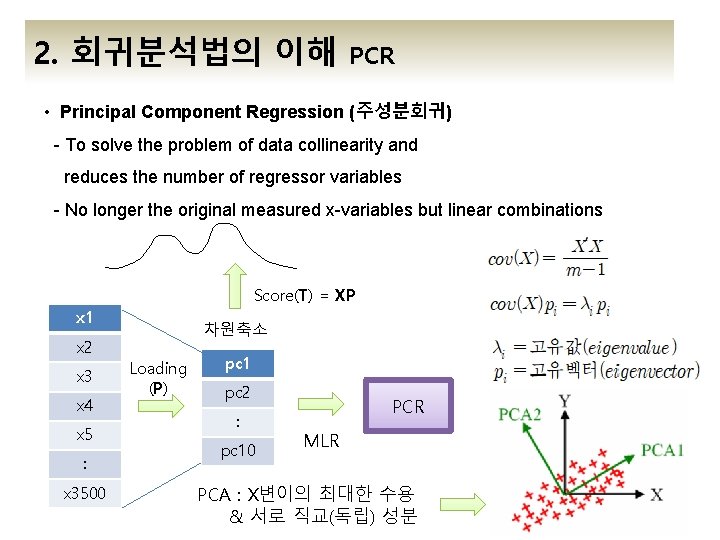
2. 회귀분석법의 이해 PCR • Principal Component Regression (주성분회귀) - To solve the problem of data collinearity and reduces the number of regressor variables - No longer the original measured x-variables but linear combinations Score(T) = XP x 1 차원축소 x 2 x 3 x 4 x 5 : x 3500 Loading (P) pc 1 pc 2 : pc 10 PCR MLR PCA : X변이의 최대한 수용 & 서로 직교(독립) 성분
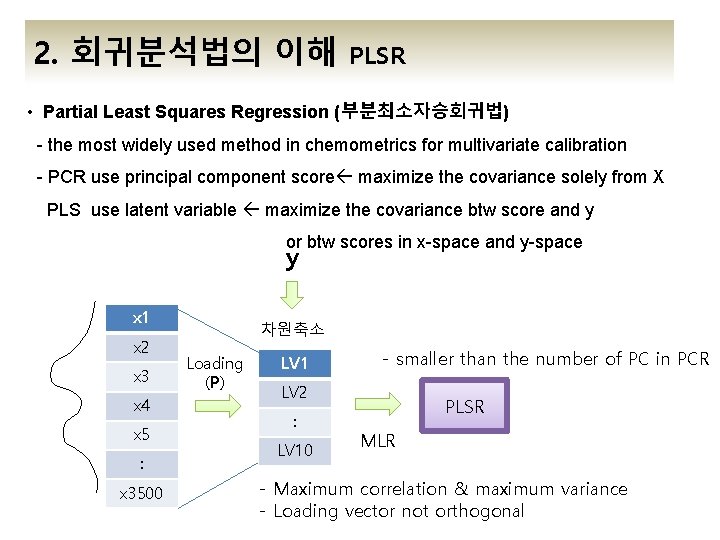
2. 회귀분석법의 이해 PLSR • Partial Least Squares Regression (부분최소자승회귀법) - the most widely used method in chemometrics for multivariate calibration - PCR use principal component score maximize the covariance solely from X PLS use latent variable maximize the covariance btw score and y or btw scores in x-space and y-space y x 1 x 2 x 3 x 4 x 5 : x 3500 차원축소 Loading (P) LV 1 - smaller than the number of PC in PCR LV 2 : LV 10 PLSR MLR - Maximum correlation & maximum variance - Loading vector not orthogonal
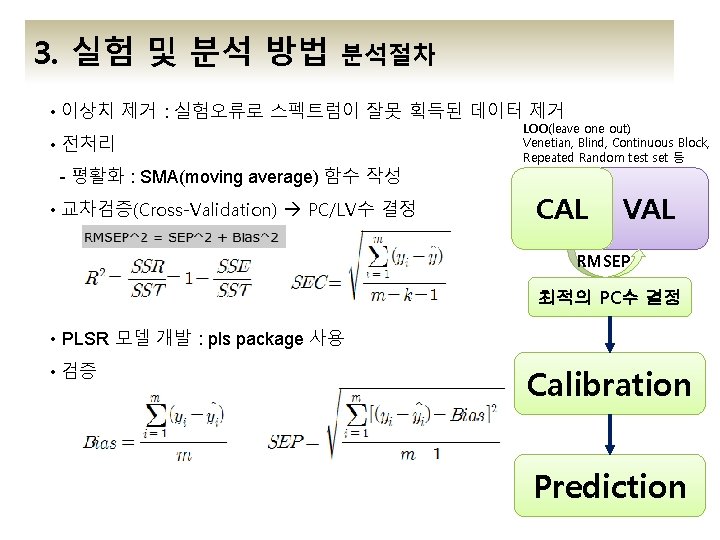
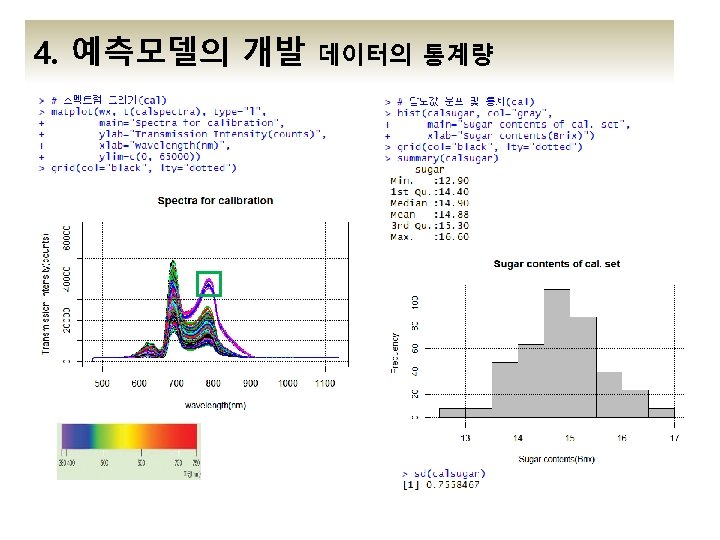
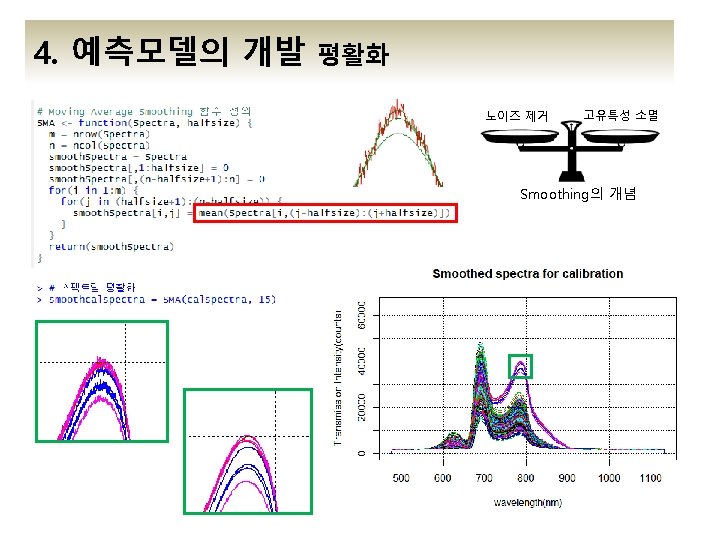
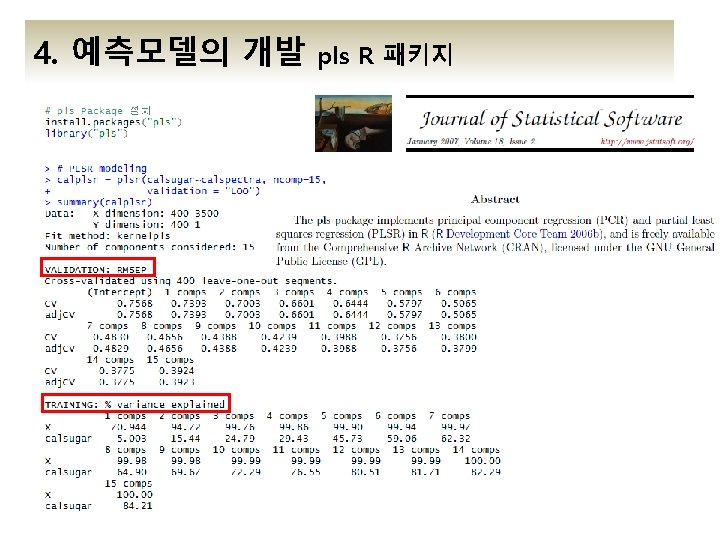
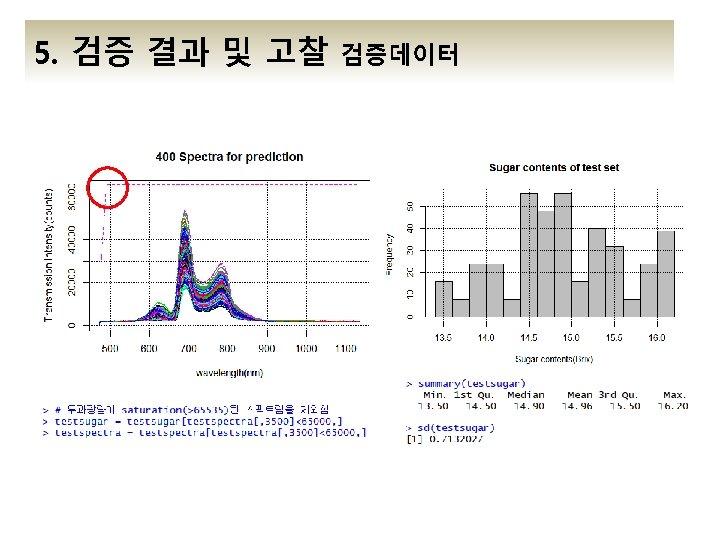
3. 실험 및 분석 방법 분석절차 • 이상치 제거 : 실험오류로 스펙트럼이 잘못 획득된 데이터 제거 • 전처리 - 평활화 : SMA(moving average) 함수 작성 • 교차검증(Cross-Validation) PC/LV수 결정 LOO(leave one out) Venetian, Blind, Continuous Block, Repeated Random test set 등 CAL VAL RMSEP 최적의 PC수 결정 • PLSR 모델 개발 : pls package 사용 • 검증 Calibration Prediction
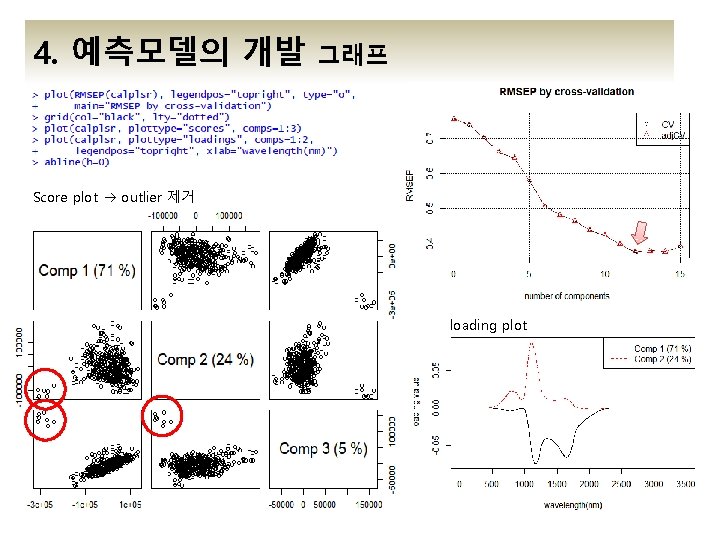
4. 예측모델의 개발 그래프 Score plot outlier 제거 loading plot
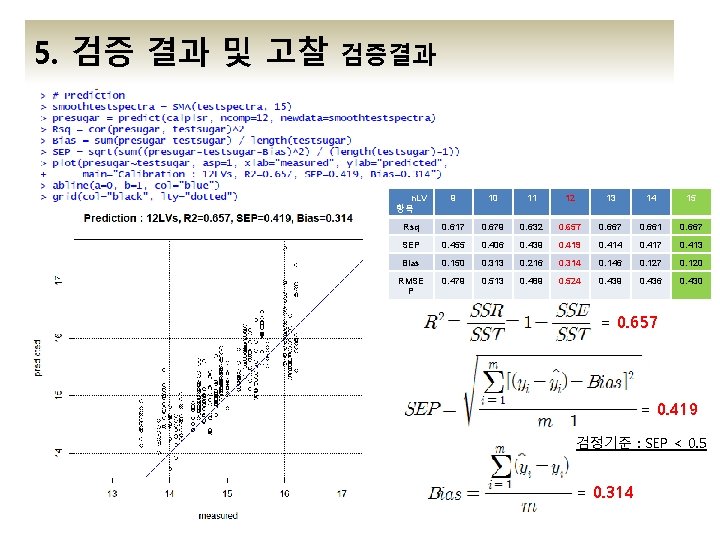
5. 검증 결과 및 고찰 검증결과 n. LV 항목 9 10 11 12 13 14 15 Rsq 0. 617 0. 679 0. 632 0. 657 0. 661 0. 667 SEP 0. 455 0. 406 0. 439 0. 414 0. 417 0. 413 Bias 0. 150 0. 313 0. 216 0. 314 0. 146 0. 127 0. 120 RMSE P 0. 479 0. 513 0. 489 0. 524 0. 439 0. 436 0. 430 = 0. 657 = 0. 419 검정기준 : SEP < 0. 5 = 0. 314
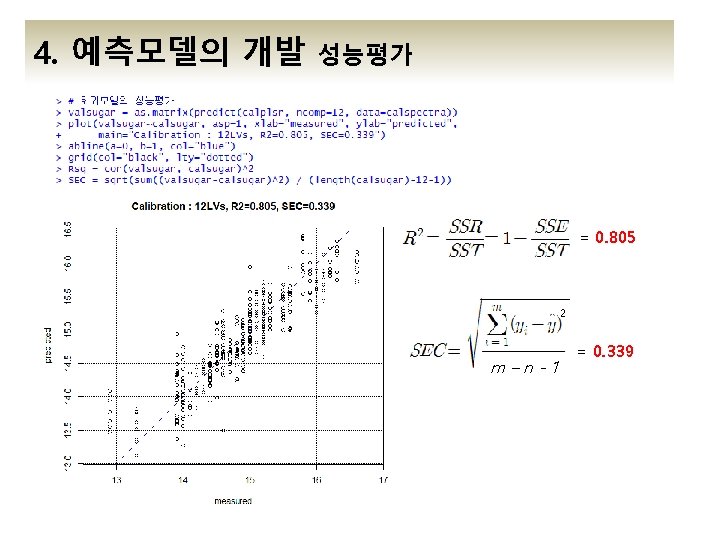
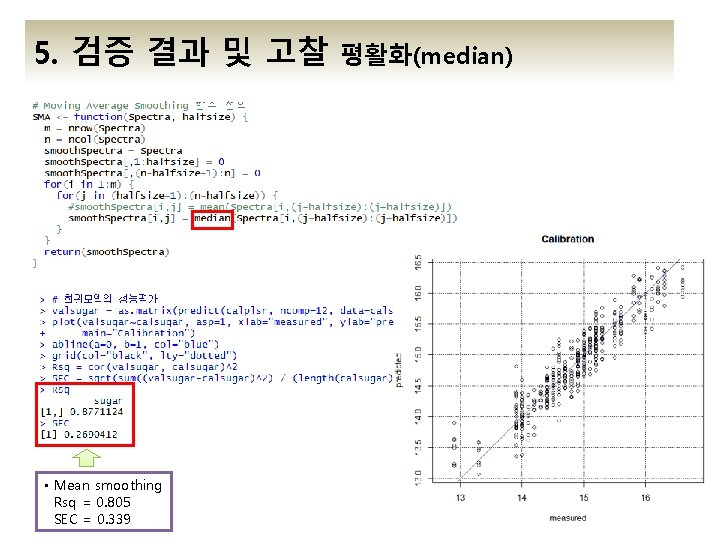
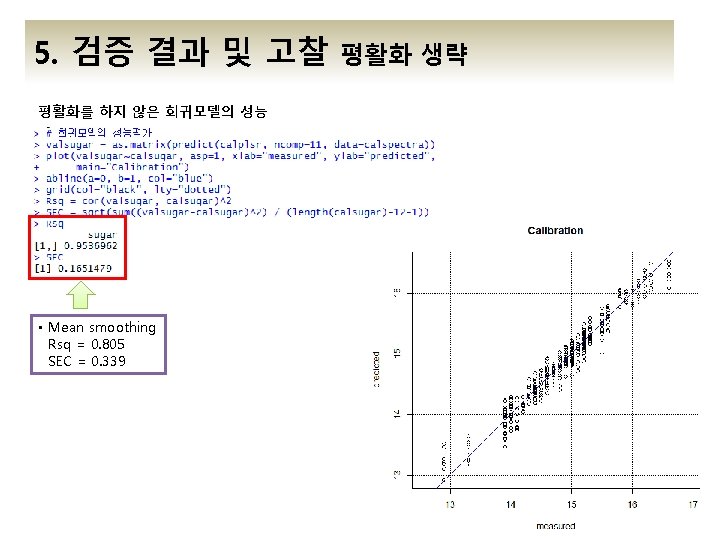
5. 검증 결과 및 고찰 • Mean smoothing Rsq = 0. 805 SEC = 0. 339 평활화(median)
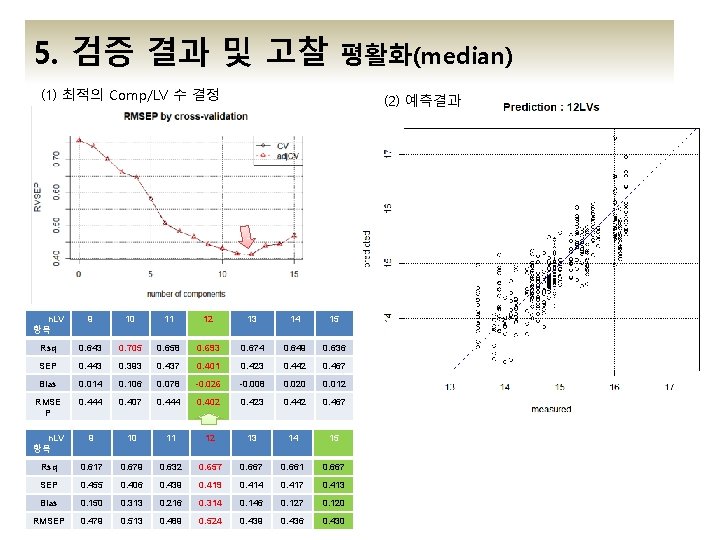
5. 검증 결과 및 고찰 평활화(median) (1) 최적의 Comp/LV 수 결정 (2) 예측결과 n. LV 항목 9 10 11 12 13 14 15 Rsq 0. 643 0. 705 0. 658 0. 693 0. 674 0. 649 0. 636 SEP 0. 443 0. 393 0. 437 0. 401 0. 423 0. 442 0. 467 Bias 0. 014 0. 106 0. 078 -0. 026 -0. 008 0. 020 0. 012 RMSE P 0. 444 0. 407 0. 444 0. 402 0. 423 0. 442 0. 467 n. LV 항목 9 10 11 12 13 14 15 Rsq 0. 617 0. 679 0. 632 0. 657 0. 661 0. 667 SEP 0. 455 0. 406 0. 439 0. 414 0. 417 0. 413 Bias 0. 150 0. 313 0. 216 0. 314 0. 146 0. 127 0. 120 RMSEP 0. 479 0. 513 0. 489 0. 524 0. 439 0. 436 0. 430
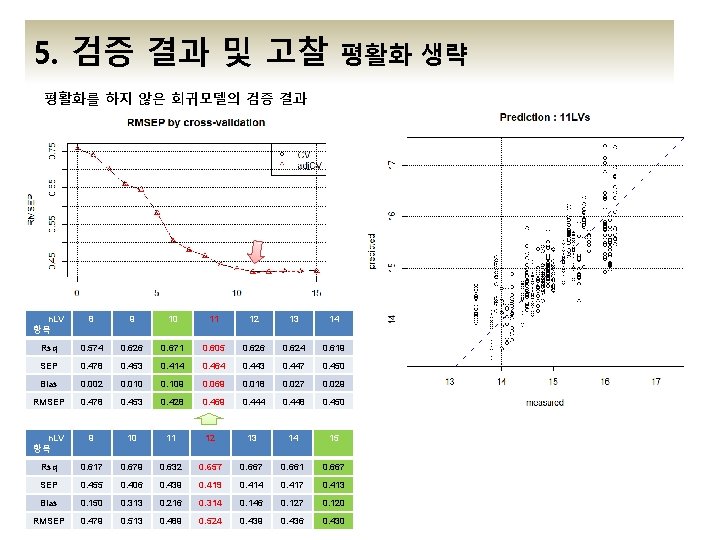
5. 검증 결과 및 고찰 평활화 생략 평활화를 하지 않은 회귀모델의 검증 결과 n. LV 항목 8 9 10 11 12 13 14 Rsq 0. 574 0. 626 0. 671 0. 605 0. 626 0. 624 0. 619 SEP 0. 478 0. 453 0. 414 0. 464 0. 443 0. 447 0. 450 Bias 0. 002 0. 010 0. 109 0. 069 0. 018 0. 027 0. 029 RMSEP 0. 478 0. 453 0. 428 0. 469 0. 444 0. 448 0. 450 n. LV 항목 9 10 11 12 13 14 15 Rsq 0. 617 0. 679 0. 632 0. 657 0. 661 0. 667 SEP 0. 455 0. 406 0. 439 0. 414 0. 417 0. 413 Bias 0. 150 0. 313 0. 216 0. 314 0. 146 0. 127 0. 120 RMSEP 0. 479 0. 513 0. 489 0. 524 0. 439 0. 436 0. 430