PRESSURE MEASUREMENT Cardiac catheterisation Dr Amol Patil SR


 along with")


")


- Slides: 123
PRESSURE MEASUREMENT -Cardiac catheterisation Dr. Amol Patil SR , Dept of cardiology, GMC, Calicut
Overview • Introduction • Basic principles and physics of cardiac catheterization pressure measurement • Atrial pressure tracing • PCWP tracing • Ventricular pressure tracing • Arterial pressure tracing • Sources of errors and Artifact • Pressure tracings in different clinical conditions
INTRODUCTION • The beginning of invasive hemodynamics can be traced back to the early 1700 s, when Rev. Stephen Hales measured the blood pressure of a horse by inserting a brass rod in the femoral artery. • In 1844, the first invasive cardiac catheterization was performed by Claude Bernard. Again, the subject was a horse, and both the right and left ventricles were entered by retrograde approach from the jugular vein and from the carotid artery.
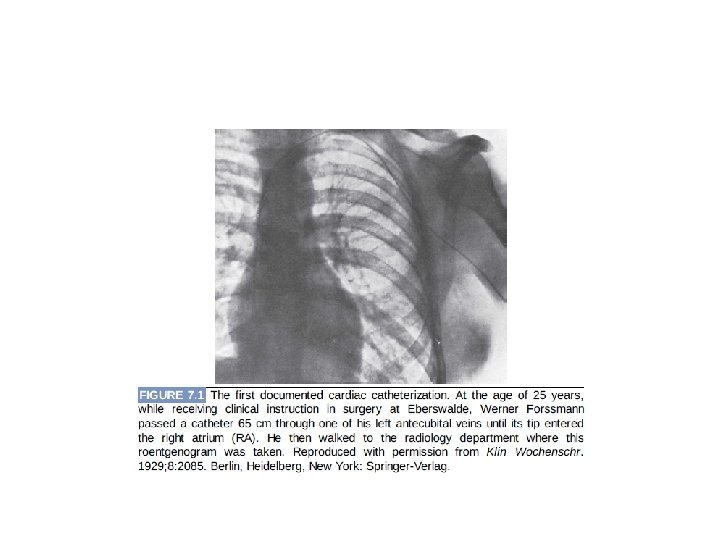
• In 1861, Chauveau and Marey– published their work on cardiac cycle and their discovery that ventricular systole and apical beat are simultaneous. In addition, they were able to measure simultaneously left ventricular (LV) and central aortic (Ao) pressure. • In 1929, Werner Forssmann – – the first right-sided heart catheterization of a human heart on himself – 1931, he demonstrate injecting contrast material in the human heart.
• Cournand Richards– performed cardiac catheterization in many clinical conditions including hypertension, circulatory shock, and chronic lung disease.
• Essential components of a hemodynamic monitoring systemØcatheter, Øtransducer, Øfluid-filled tubing to connect the catheter to the transducer, and Øphysiologic recorder to display, analyze, print, and store the hemodynamic waveforms generated.
• Proper equipment's for high quality catheterization recordings • Coronary angiography: smallest bore catheters, 5 F & even 4 F • Complex hemodynamic catheterization is optimally performed with large-bore catheters that yield high quality hemodynamic data. To obtain proper hemodynamic tracings, 6 F or 7 F catheters may be required.
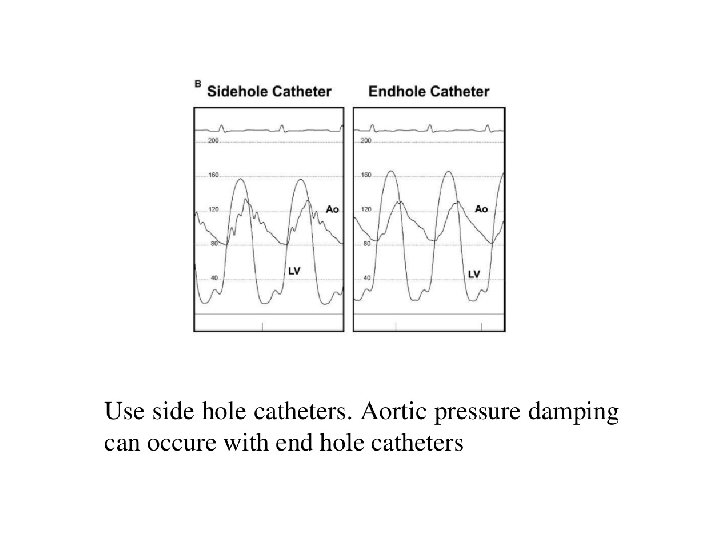
• Variety of catheters used • The optimal catheter for hemodynamic measurements is stiff and has a relatively large lumen opening to an end hole. • End-hole catheter -sampling pressures within small chambers Disadvantage-it may lead to damping or other artifact if the end hole comes into contact with the wall of the cardiac chamber. • “pig-tail” catheter has multiple side holes and samples pressure at each of these openings- adequate for sampling pressure in a large, uniform chamber such as the aorta or left ventricle Disadvantage-it doesn’t have the required resolution to discern pressure gradients within the left ventricle.
• The Swan–Ganz catheter is the most commonly used catheter for measuring right-heart pressures. In addition to the balloon at the tip for flotation, it consists of an end hole (distal port), a side hole 30 cm from the catheter tip (proximal port), and a thermistor for measurement of thermodilution cardiac output. • balloon flotation catheters – the Berman catheter, multiple side holes near the tip and no end hole or thermistor and is used principally for performance of angiography, and – the balloon-wedge catheter- contains an end hole similar to the Swan–Ganz catheter but no thermistor for cardiac output measurement or additional infusion or pressure monitoring ports
Swan-Ganz catheter Berman catheter
• The use of high-fidelity manometer-tipped catheters might also need to be considered in those instances when intricate analysis of diastolic filling contours is required. • Other catheters rarely used today – – the Layman catheter and Cournand catheter consisting of an end-hole, – the NIH catheter that contains multiple side holes near the tip but no end hole, – the Goodale-Lubin catheter consisting of an end hole and two single side holes near the tip
MICROMANOMETERS • miniaturized transducers that fit on the distal tip of standard catheters and therefore may be used as intracardiac manometers • Measuring pressure directly within the vessel or cardiac chamber with the transducer on the tip of the catheter prevents the distortions associated with fluid-filled systems. • Micromanometers have a flat frequency response up to 1 , 000 Hz, thus allowing accurate recording at high heart rates
• reduce the mass and inertia of the pressure measurement system, • improve the frequency-response characteristics , • decrease artifacts associated with underdamping , overdamping, and catheter whip
• The catheter may be subjected to gas sterilization (ethylene oxide) along with other catheters and instruments. • The pressures measured with these catheters are superior in waveform and accuracy to those measured with standard techniques • A disposable version is available for clinical use
• In fluid-filled catheter system- choose the shortest extension tubing possible to obtain optimal pressure contours. • Force is transmitted through a fluid medium as a pressure wave. • important objective of the cardiac catheterization procedure is to assess accurately the pressure waves generated by various cardiac chambers.
the more rigid the sensing membrane, the lower the sensitivity; the more flaccid the membrane, the higher the sensitivity
• Pressure measurement systems today generally use electrical strain gauges based on the principle of the Wheatstone bridge. • the strain gauge is a variable resistance transducer operation depends on the fact– when an electrical wire is stretched, its resistance to the flow of current increases.
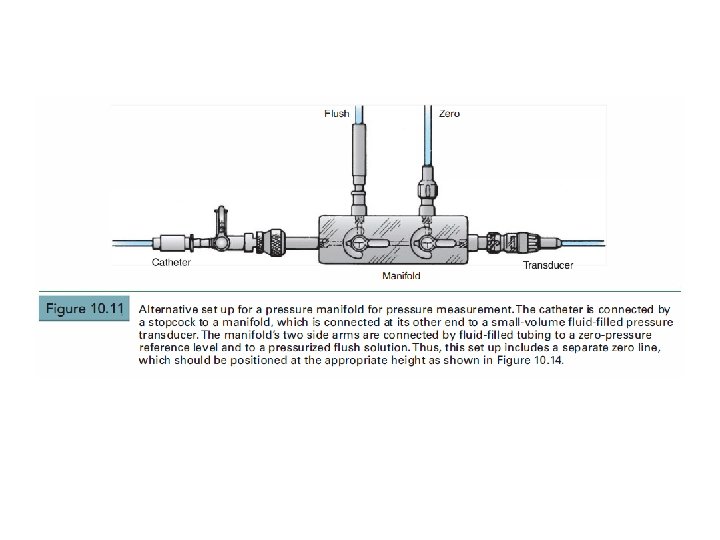
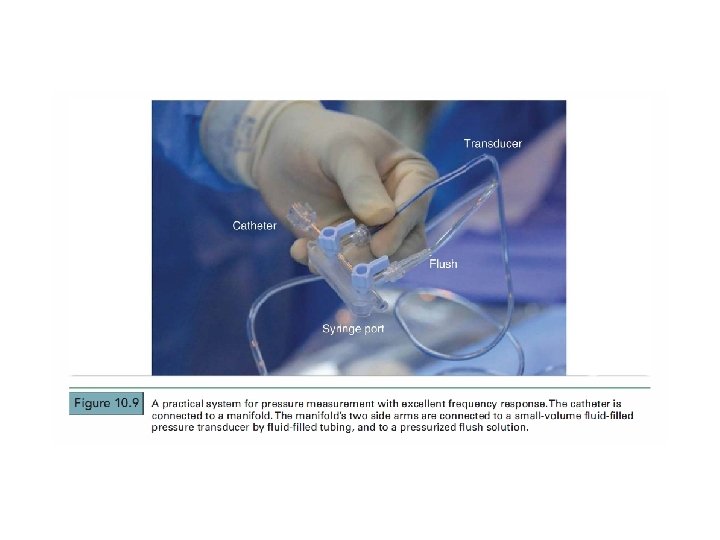
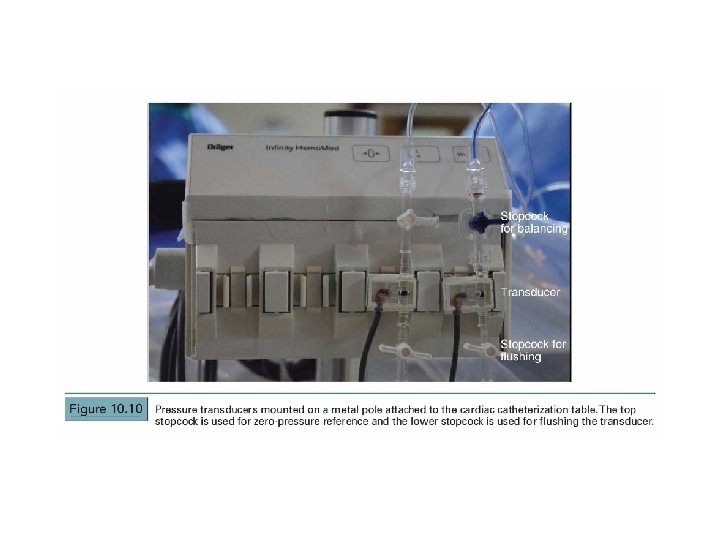
Fluid filled catheter is attached by means of a manifold to a smallvolume-displacement strain gauge type pressure transducer
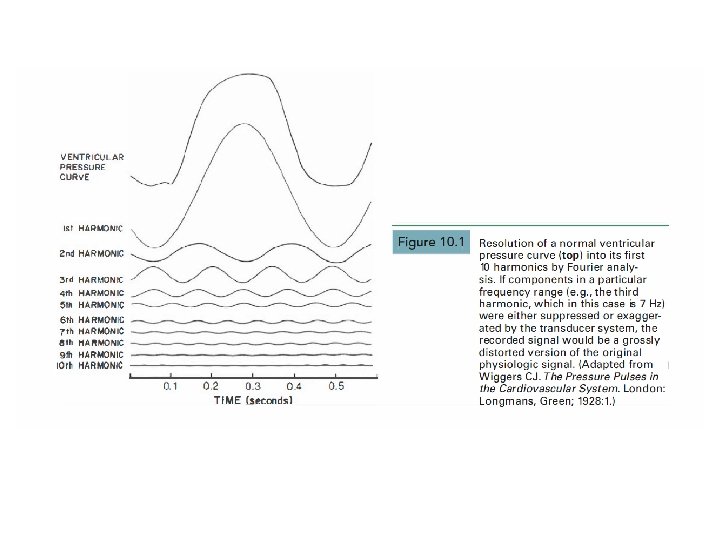
Pressure measurement Terminology • fundamental frequency-The number of times the cycle occurs in 1 second • Eg. a fundamental frequency of 2 corresponds to a heart rate of 120 bpm. • As a complex periodic waveform, the pressure wave may be subjected to a type of analysis developed by the French physicist Fourier, whereby any complex wave form may be considered the mathematical summation of a series
• The practical consequence of this analysis – • to record pressure accurately, a system must respond with equal amplitude for a given input throughout the range of frequencies contained within the pressure wave. • If components in a particular frequency range are either suppressed or exaggerated by the transducer system, the recorded signal will be a grossly distorted version of the original physiologic waveform. • For example , the dicrotic notch of the aortic pressure wave contains frequencies above 10 H z. If the pressure measurement system were unable to respond to frequencies greater than 10 Hz, the notch would be slurred or absent.
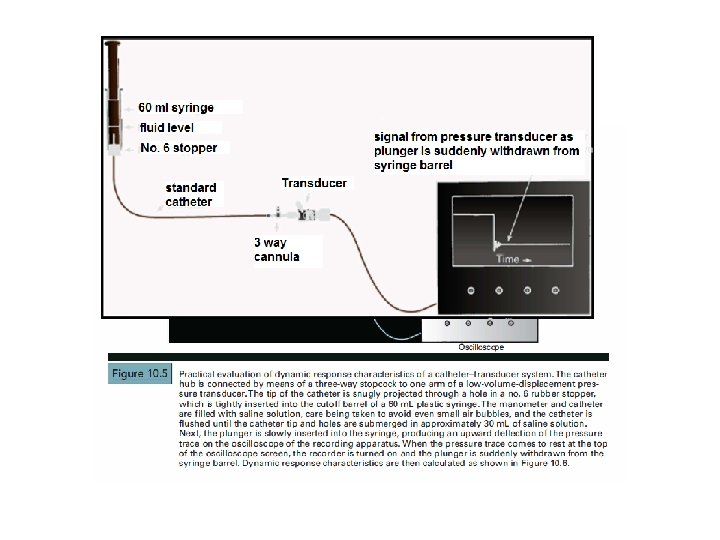
• Natural Frequency and Damping • If the sensing membrane were to be shockexcited (like a gong) in the absence of friction, it would oscillate for an indefinite period in simple harmonic motion. The frequency of this motion would be the natural frequency of the system. • Any means of dissipating the energy of this oscillation, such as friction, is called damping.
• Natural frequency • Frequency of an input pressure wave at which the ratio of output/input amplitude of an undamaged system is maximal
• Damping dissipates the energy of the oscillating sensing membrane • optimal damping dissipates the energy gradually, thereby maintaining the frequency response curve nearly flat (constant output/input ratio) as it approaches the region of the pressure measurement system's natural frequency.
• In practice there is always some damping, and this has two effects: – the amplitude of the oscillations gradually diminishes , and – the frequency of oscillation is reduced. • damping helps to prevent overshoot artifacts resulting from resonance of the system , but at the cost of diminished frequency response.
frequency response and sensitivity are related reciprocally, and one can be obtained only by sacrificing the other.
Underdamped Almost optimally damped Overdamped
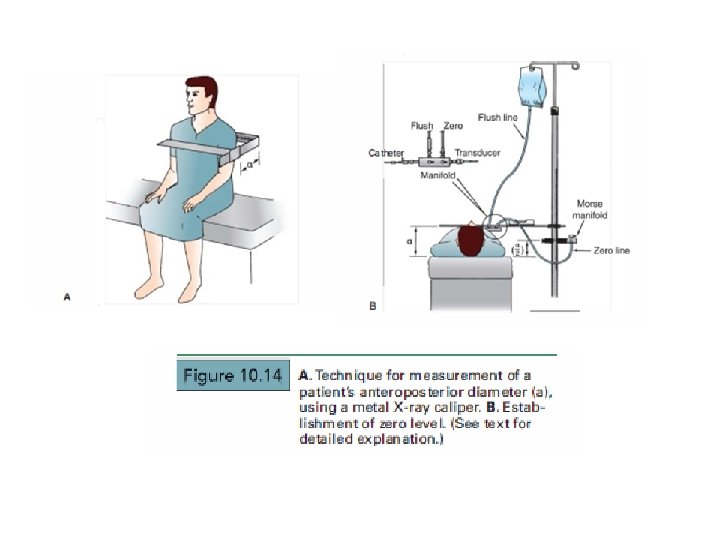
• Midchest level is used widely as zero Reference • In practical terms , for measurement of left ventricular and aortic pressure , the zero level should be positioned approximately 5 cm below the left sternal border at the fourth left intercostal space (LICS) • the right ventricle and left atrium are at different levels in the chest than the left ventricle, • Courtois et al. calculated that the error introduced by use of a point 5 cm below the fourth LICS, at the left sternal border, is approximately ± 0. 8 mm. Hg for chambers other than the left ventricle
Frequency response • Ratio of output amplitude to input amplitude over a range of frequencies of the input pressure wave • Frequency response of catheter system is dependent on catheters natural frequency and amount of damping • The higher the natural frequency of the system, the more accurate the pressure measurement at lower phyliogic frequencies
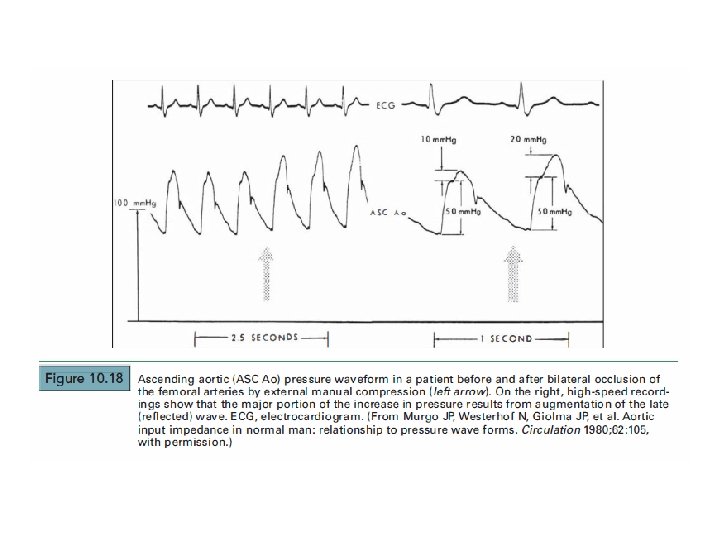
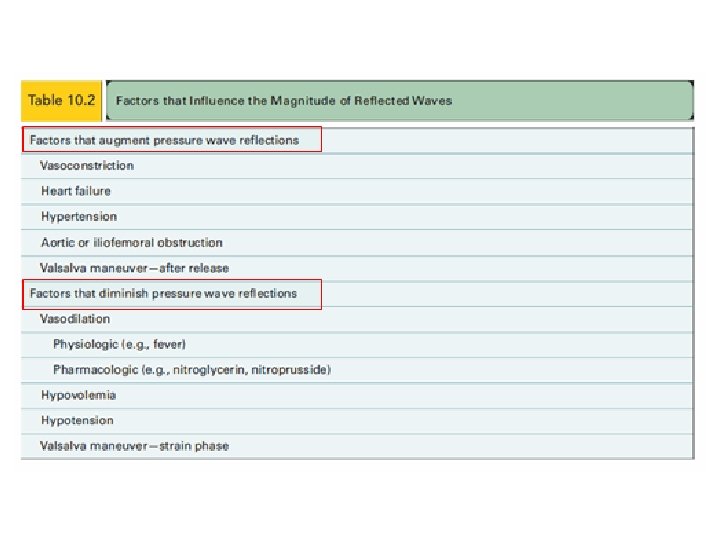
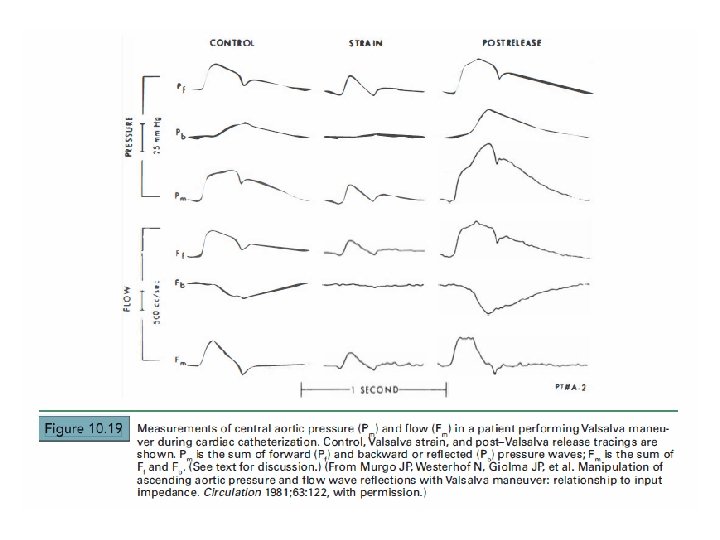
• Physiologic characteristics of pressure waveforms 1. Reflected waves 2. Wedge pressure
1. Reflected waves
2. Wedge pressure • a wedge pressure is obtained when an end-hole catheter is positioned in a designated blood vessel with its open endhole facing a capillary bed, with no connecting vessels conducting flow into or away from the designated blood vessel between the catheter tip and the capillary bed. • A true wedge pressure can be measured only in the absence of flow. • the catheter-tip pressure is equal to that on the other side of the capillary bed.
• an end-hole catheter wedged in a hepatic vein may be used to measure portal venous pressure ; • catheter wedged in a distal pulmonary artery measures pulmonary venous pressure; • In the absence of cor triatum or obstruction to pulmonary venous outflow, the pulmonary venous and left atrial pressures are equal, so that pulmonary artery wedge pressure may be used as a substitute for left atrial pressure. • ensure adequate wedge position by observing the pressure waveform and by obtaining an oxygen saturation in wedge position, which should be above 95%.
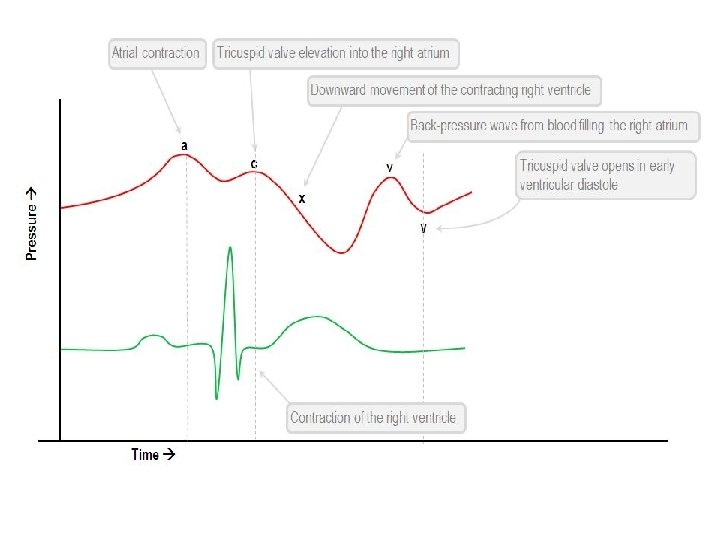
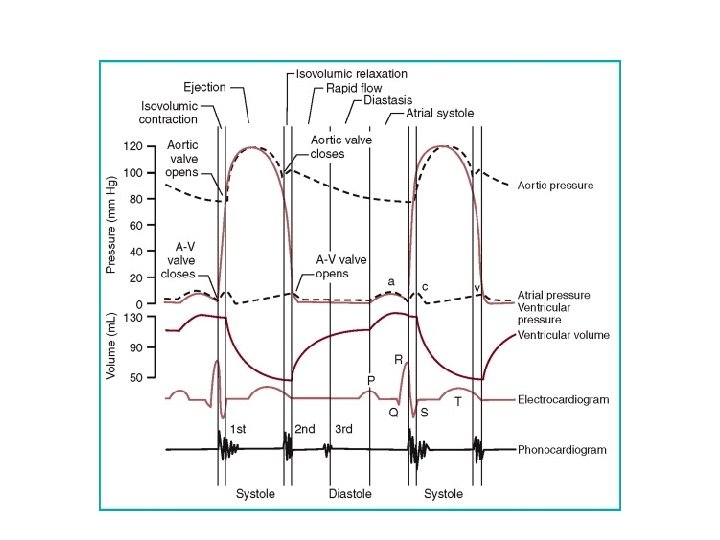
Cardiac cycle
Hemodynamic Parameters Reference values
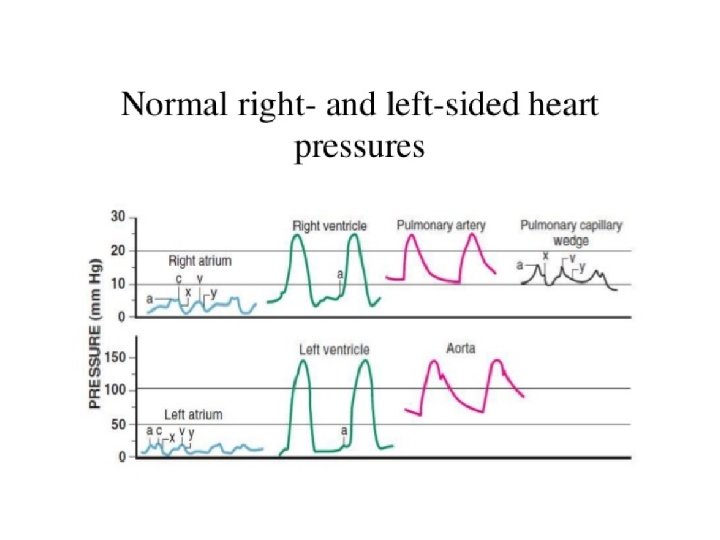
Atrial Pressure • The atrial pressure waveform has three positive deflections, the a, c, and v waves. • The a wave is due to atrial systole and follows the P wave on the ECG • The height of the a wave depends on atrial contractility and resistance to Ventricular filling. • The X descent represents relaxation of the atrium and downward pulling of the AV valve annulus by Ventricular contraction. • The X descent is interrupted by the c wave, which is a small positive deflection caused by protrusion of the closed AV valve annulus into the atrium.
• The v wave represents Ventricular systole. • The y descent occurs after the v wave and reflects opening of the AV valve and emptying of the atrium into the ventricle. • The left and right atrial pressure contours are similar, • the left atrial pressure being generally higher than the right atrial pressure and • a more prominent V wave in the left atrial pressure contour.
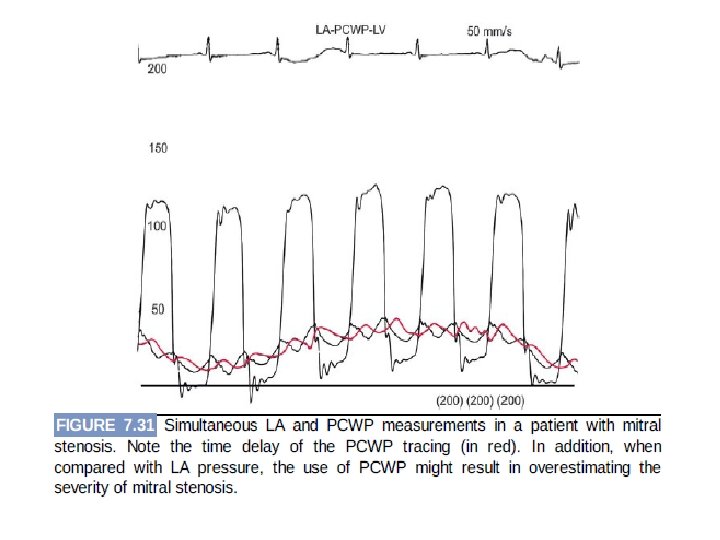
PCWP • PCWP is obtained by inflating the balloon-tipped catheter in the distal PA position until it occludes the PA branch. • So it reflects pulmonary venous pressure and, thus, LA pressure. • The V wave is larger than the A wave, and both are larger than mean PCWP. • PCWP is delayed approximately 50 to 150 milliseconds in comparison with LA pressure. • The normal mean PCWP is 12 mm. Hg or less, but values up to 15 to 18 mm. Hg may not lead to congestion
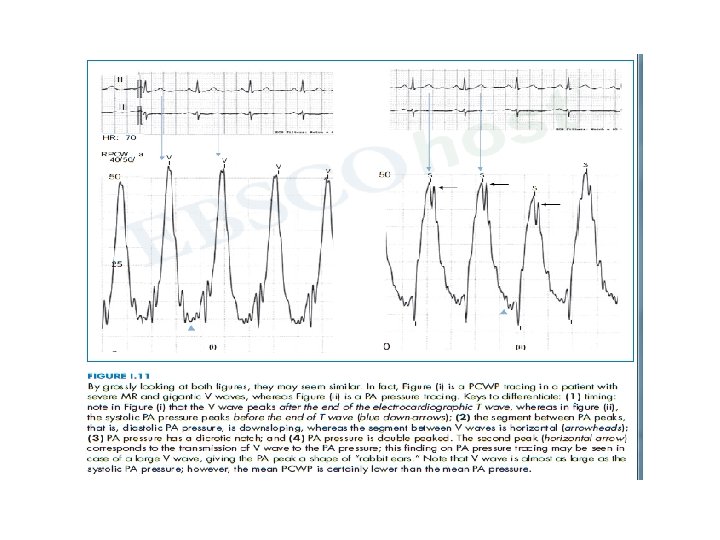
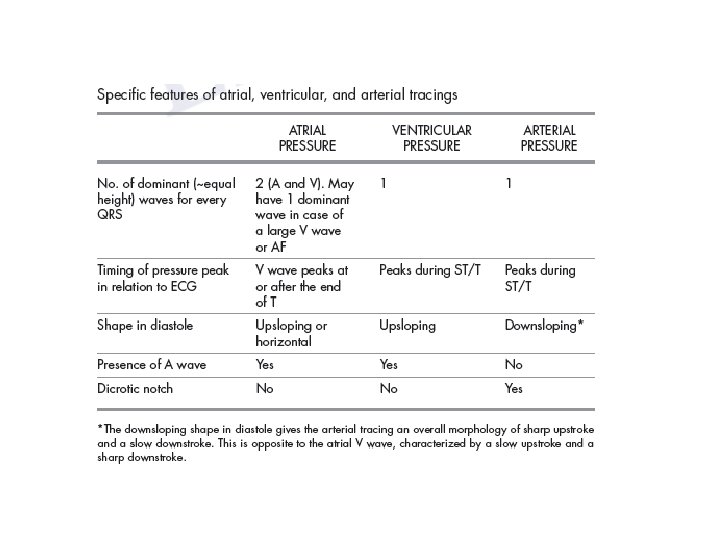
• Key points in differentiating PA pressure from PCWP • The V wave peaks after the T wave, whereas systolic PA pressure peaks during T wave. • The segment between V waves is rather horizontal or upsloping and A waves are sometimes seen • Where as the PA pressure tracing, the segment between the systolic peaks is downsloping and does not have A wave. • In difficult cases obtain blood sample from the wedged catheter tip and check oxygen saturation. – The PCWP saturation = pulmonary venous saturation (usually >95%), – PA saturation = mixed venous saturation. – best confirmatory method of proper wedging in rare cases
• Conditions where PCWP tracing overestimates the true PCWP (as well as LVEDP) – Catheter in the upper lung zones (1 or 2) – Catheter overwedging – Pulmonary hypertension with hybrid PCWP-PA tracing – Sepsis, hypoxemia, or acute lung injury with pulmonary venoconstriction and elevated pulmonary interstitial
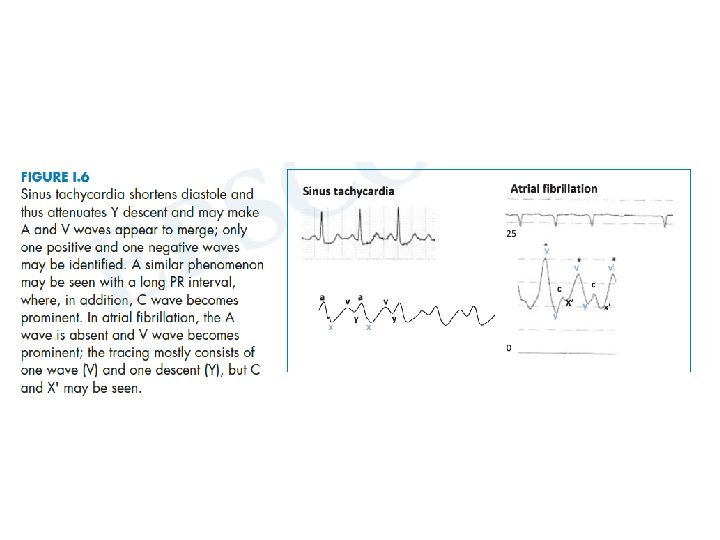
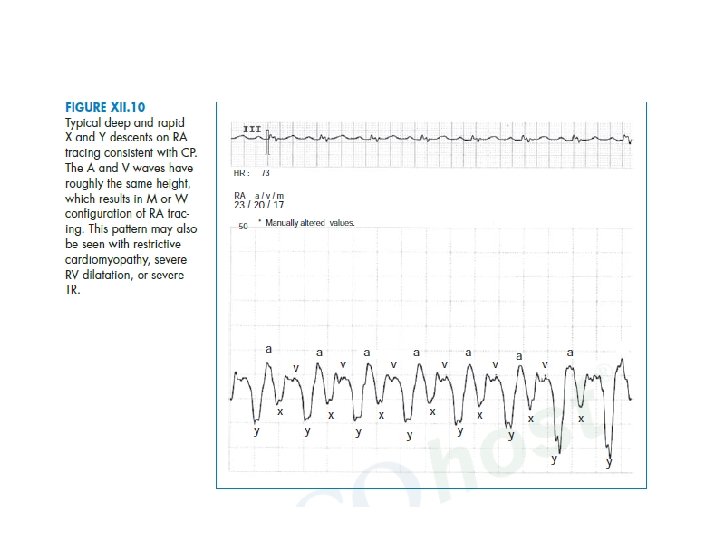
Atrial pressure tracing in various diseases • Deep X and deep Y: constrictive pericarditis • Deep X and flat Y (diastolic flow blunting): tamponade, but also sinus tachycardia • Flat X (systolic flow blunting) and deep Y: severe TR and/or RV failure • Large V wave: severe TR and/or RV failure • Ventricularized RA pressure: severe TR • Large A wave: impaired RV compliance • Equally large A and V waves: ASD
Ventricular Pressure • RV and LV waveforms are similar in morphology. • They differ mainly with respect to their magnitudes. • The durations of systole and isovolumic contraction relaxation are longer and the ejection period is shorter in the left than in the right ventricle.
LVEDP • End Diastolic pressure can be measured on the R wave of the ECG, which will coincide just after “a” wave on LV trace. • To be measured at the end expiration
4
• Hemodynamic findings in RV systolic or diastolic failure 1. -Elevated RV EDP > 8 mm. Hg 2. -Elevated mean RA pressure > 7 mm. Hg 3. -Large RA V wave 4. -Deep X and Y on RA tracing 5. -RV dip-plateau pattern
• There are key differences between arterial and ventricular tracings 1. the ventricular pressure increases in diastole, whereas arterial pressure decreases in diastole; 2. the ventricular pressure tracing in systole has a “rectangular” shape, as opposed to the “triangular” shape of arterial tracings; 3. ventricular pressure has an A wave in diastole; 4. arterial pressure has a dicrotic notch.
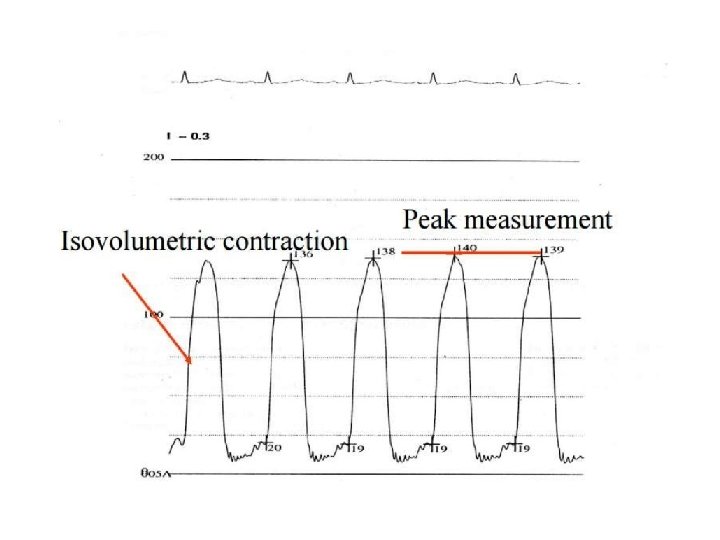
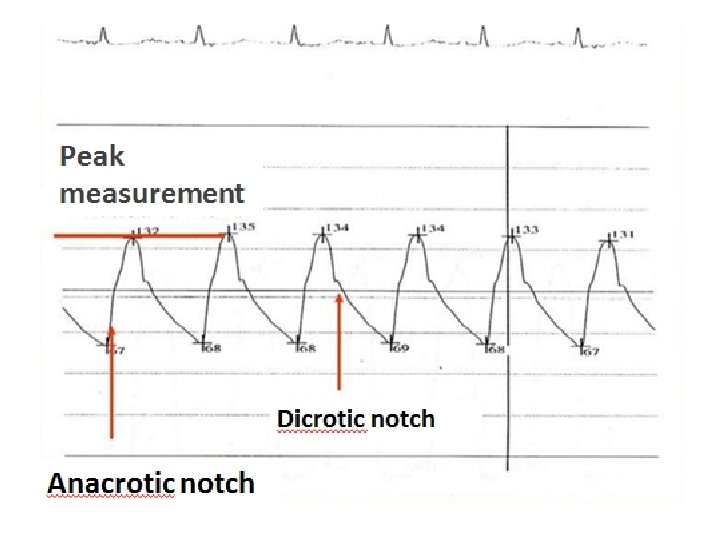
Aortic Pressure • The contour of the aortic pressure is the result of the forward wave and reflected waves. • Arterial pressure rise slightly during isovolumic contraction of the left ventricle due to bulging of the semilunar valve in the aorta, before openig called as Anacrotic notch.
• At the end of the isovolumic ventricular contraction phase, with opening of the aortic valve, the ejections phase begins and the aortic pressure starts rising. • The initial steep increase is followed by a peak and then by a decline to the Dicrotic notch • the dicrotic notch corresponds to closure of the aortic valve and end of ejection.
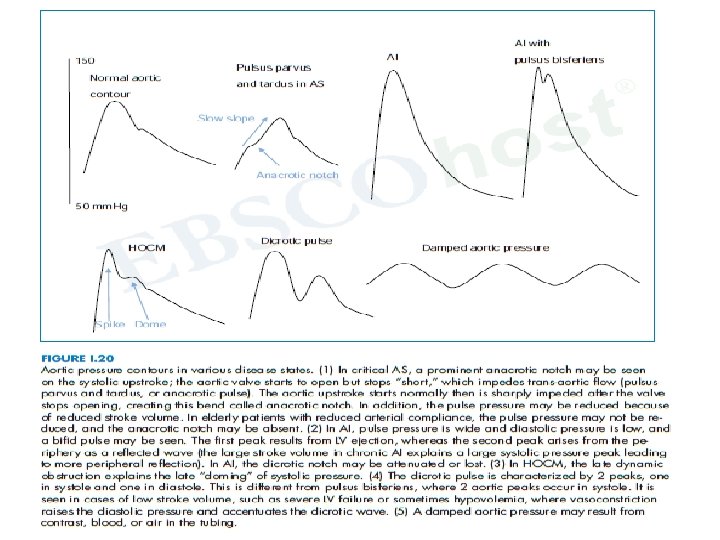
• Several aortic tracing patterns are suggestive of diseases 1. 2. 3. 4. 5. 6. Sharp downslope of the diastolic pressure with a widened pulse pressure, - suggests AI. In addition, an attenuated or absent dicrotic notch suggests AI. Late peaking suggests AS (pulsus parvus and tardus). Double peaking in systole suggests AI or HOCM. On an appropriately damped aortic tracing, the loss of dicrotic notch suggests severe AI or poor arterial compliance Gradual reduction of the systolic pressure by more than 10 mm. Hg during normal quiet inspiration suggests pulsus paradoxus, which is seen in tamponade. Every-other-beat alternation in systolic pressure suggests pulsus alternans, which reflects a severe reduction in cardiac output, as in severe LV dysfunction or severe AS, and carries a poor prognosis.
Sources of errors and Artifact 1. 2. 3. 4. 5. 6. Deterioration in Frequency Response Catheter Whip Artifact End Pressure Artifact Catheter Impact Artifact Systolic Pressure Amplification the Periphery Errors in Zero Level , Balancing, or Calibration
Deterioration in Frequency Response- • Even the smallest air bubbles have a drastic effect on pressure measurement because they cause excessive damping and lower the natural frequency (by serving as an added compliance). • When the natural frequency of the pressure measurement system falls,
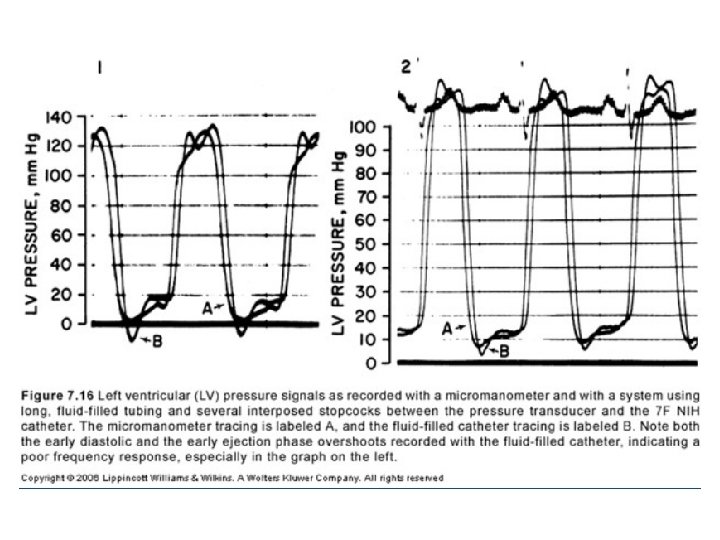
• high-frequency components of the pressure waveform may set the system in oscillation, producing the ventricular pressure overshoot commonly seen in early systole and diastole • Flushing out the catheter, manifold, and transducer dispels these small air bubbles and restores the frequency response of the pressure measurement system
The micromanometer tracing is labeled A, and the fluid -filled catheter tracing is labeled B. Note both the early diastolic and the early ejection phase overshoots reco rded with the fluid -filled catheter, indicating a poor frequency response, especially in the graph on the left
Catheter Whip Artifact • Motion of the tip of the catheter within the heart and great vessels accelerates the fluid contained within the catheter. • may produce superimposed waves of ± 10 mm. Hg. • common in tracings from the pulmonary arteries and are difficult to avoid.
End Pressure Artifact- • Flowing blood has a kinetic energy • when this flow suddenly comes to a halt, the kinetic energy is converted in part into pressure. • End-hole catheter pointing upstream records a pressure that is artifactually elevated by the converted kinetic energy. • This added pressure may range from 2 to 10 mm. Hg.
Catheter Impact Artifact • When a fluid-filled catheter is hit (e. g. , by valves in the act of opening or closing or by the walls of the ventricular chambers) , a pressure transient is created. • common with pigtail catheters in the left ventricular chamber- the terminal pigtail may be hit by the mitral valve leaflets as they open in early diastole.
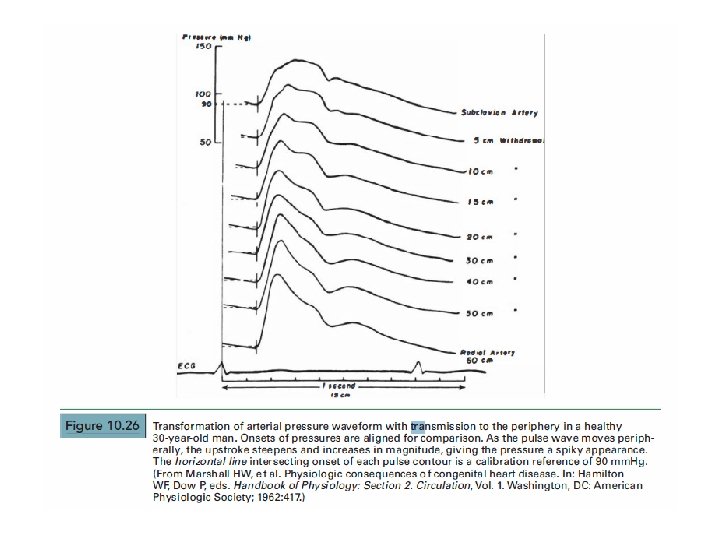
Systolic Pressure Amplification the Periphery- • The peripheral arterial systolic pressure may appear to be 20 mm. Hg higher than the left ventricular systolic pressure. • More marked in Radial artery
• Reason-the change in waveform of arterial pressure as it travels away from the heart is largely a consequence of reflected waves. • These waves, presumably reflected from the aortic bifurcation, arterial branch points , and small peripheral vessels , reinforce the peak and trough of the antegrade pressure waveform, causing amplification of the peak systolic and pulse pressures
• amplification in the periphery is particularly marked in the radial artery , especially if there is also some end pressure artifact, and may mask and distort pressure gradients across the aortic valve or left ventricular outflow tract. • Use of a double-lumen catheter (e. g. , double lumen pigtail) allows measurement of left ventricular and central aortic pressures simultaneously, thus avoiding this problem.
• Another method is the transseptal technique with a second catheter in the central aorta • third method is to use another pigtail catheter inserted from the contralateral femoral artery. • Finally, special attention to performing careful pullback tracings may also help the operator to avoid this particular error.
Errors in Zero Level , Balancing, or Calibration • All manometers must be zeroed at the same point, • the zero-reference point should be changed if the patient's position is changed during the course of the study (e. g. , if pillows are placed to prop up the patient). • Transducers requiring calibration should be calibrated before each period of use.
• If possible, all transducers should be exposed to the calibrating system simultaneously to avoid false gradients caused by unequal amplification of the same pressure signal. • If the unexpected gradient persists, catheter attachments should be switched between the two involved manifolds. An artifactual gradient reverses direction, whereas a true gradient persists after this maneuver.
Pressure tracing in various diseases
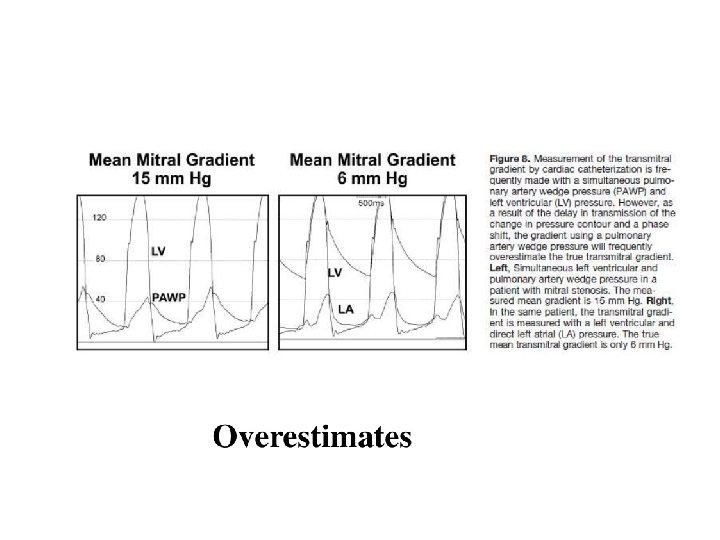
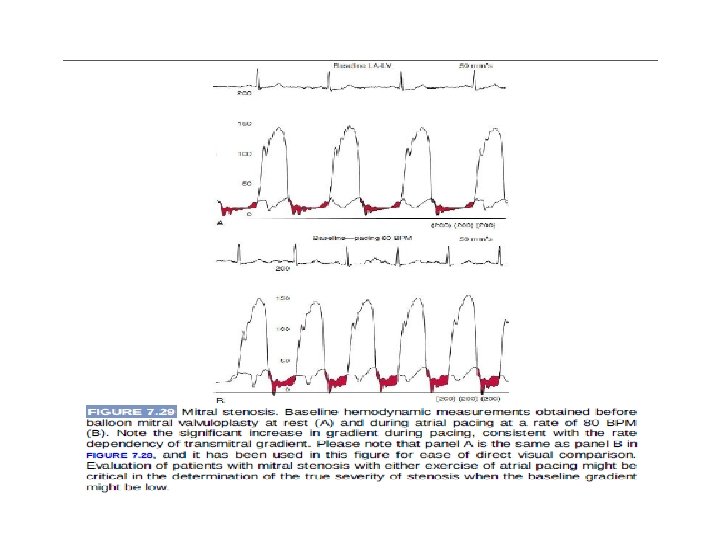
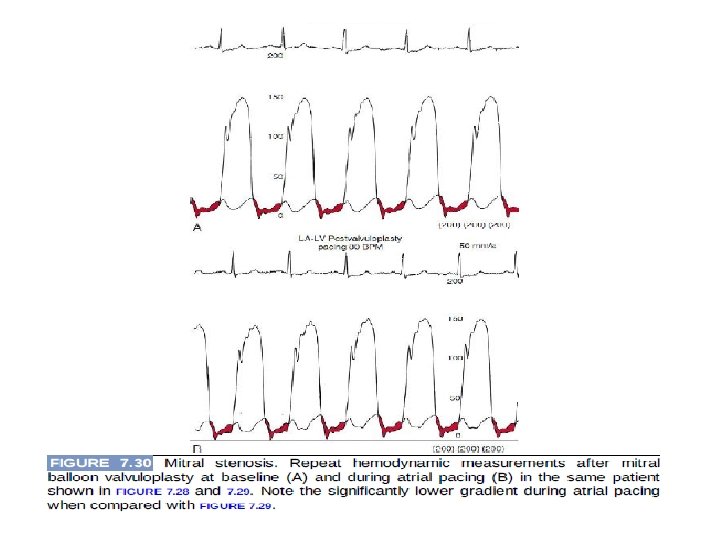
MS • Noninvasive estimations are inconsistent & pulmonary hypertension out of proportion to the apparent severity of mitral valve disease • Simultaneous PAWP and left ventricular pressure overestimates pressure gradient
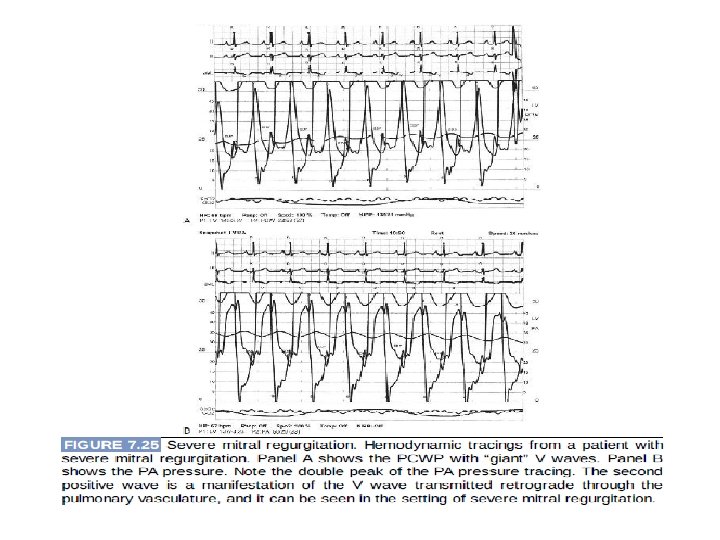
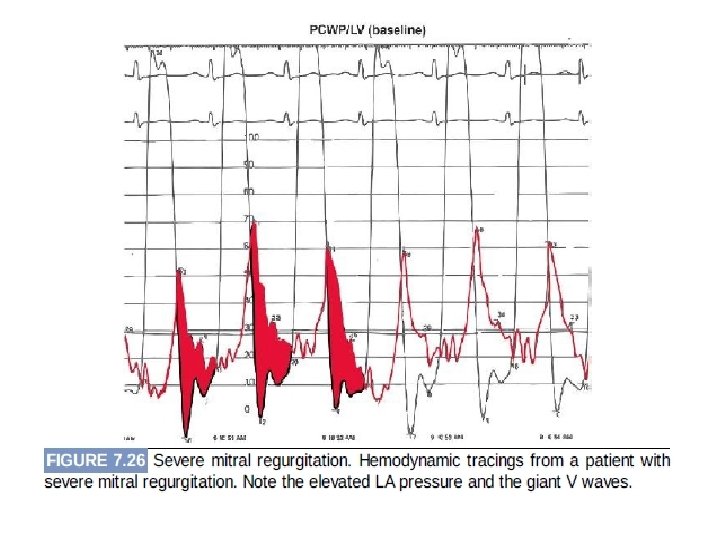
MR
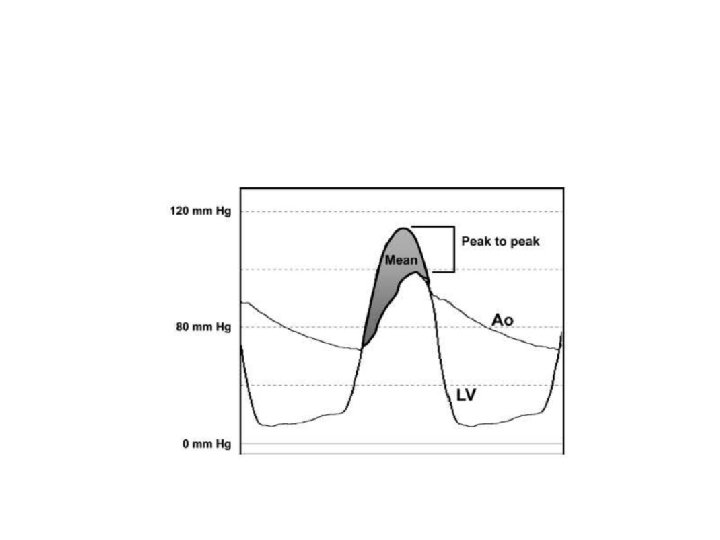
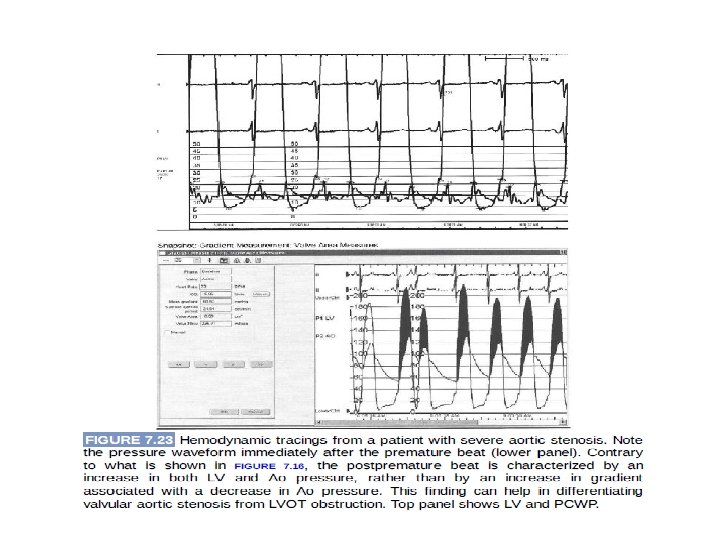
AS • Discrepancy between the physical examination and the elements of the Doppler echocardiogram • Optimal technique: record simultaneously obtained left ventricular and ascending aortic pressures • Mean gradient differences not the peak to peak gradient(peak left ventricular pressure doesn’t occur simultaneously with the peak aortic pressue)
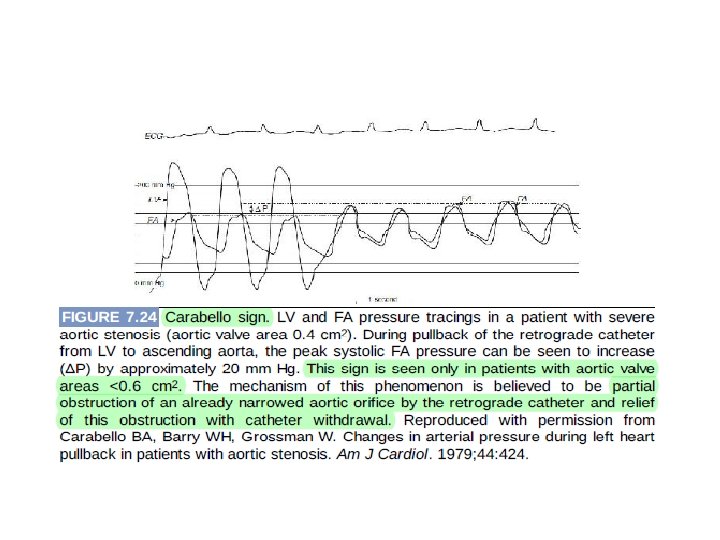
• Pullback traces with a single catheter from the left ventricle to the aorta can be helpful, but only if pt is in sinus rhythm with regular rate. • Carabello sign: Ø Critical AS Ø Catheter across the valve itself will cause further outflow obstruction Ø This sign occurs in valve areas 0. 6 cm 2 or less & when 7 F or 8 F catheters are used to cross the valve
Don’t use femoral arterial pressure: 1. Peripheral amplification of arterial wave decrease the gradient falsely 2. PAD- increase gradient falsely
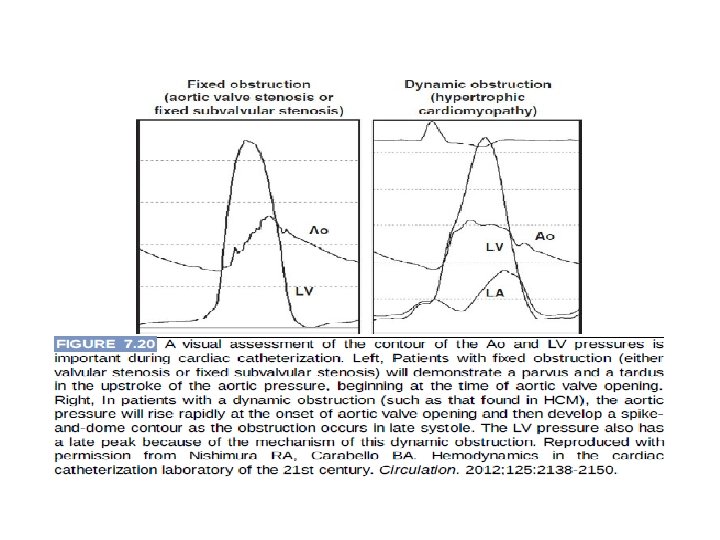
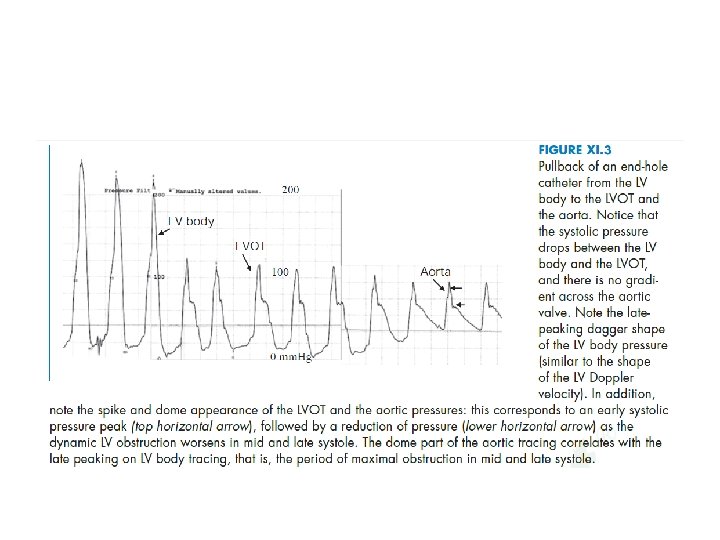
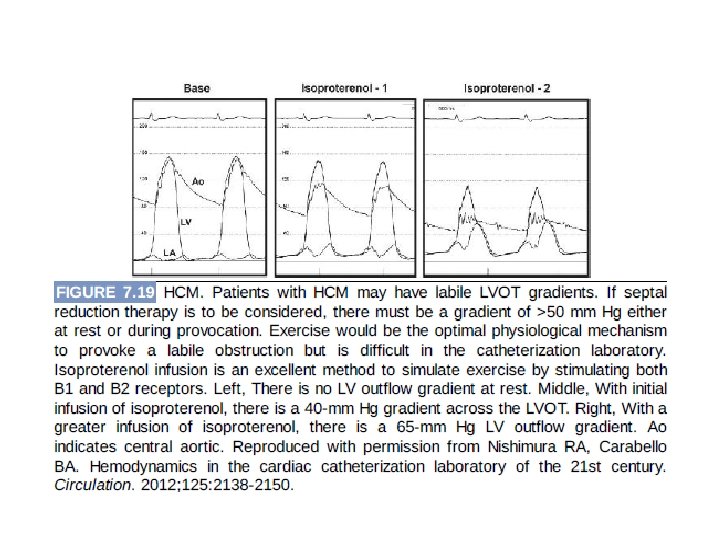
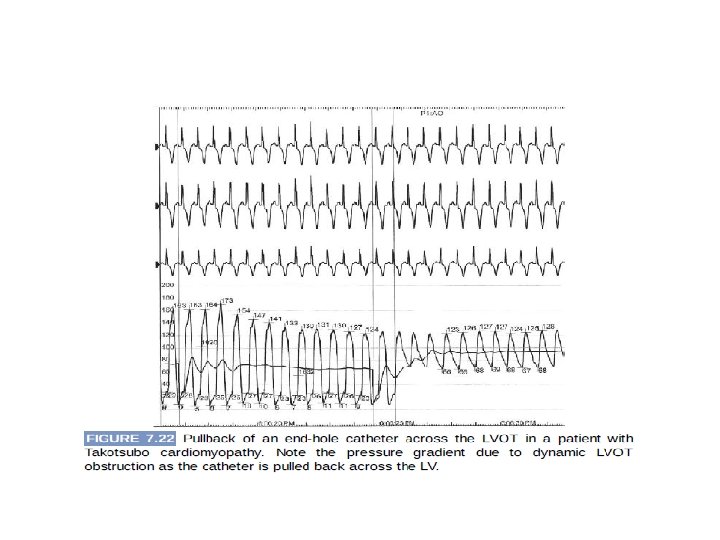
Dynamic LVOT obstruction • Dynamic LVOT obstruction: • Spike and dome pattern with an initial rapid upstroke • Late peaking left ventricular pressure.
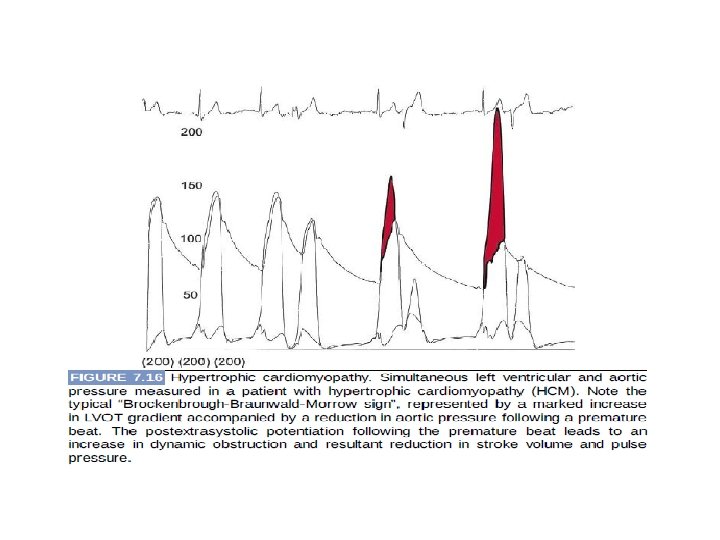
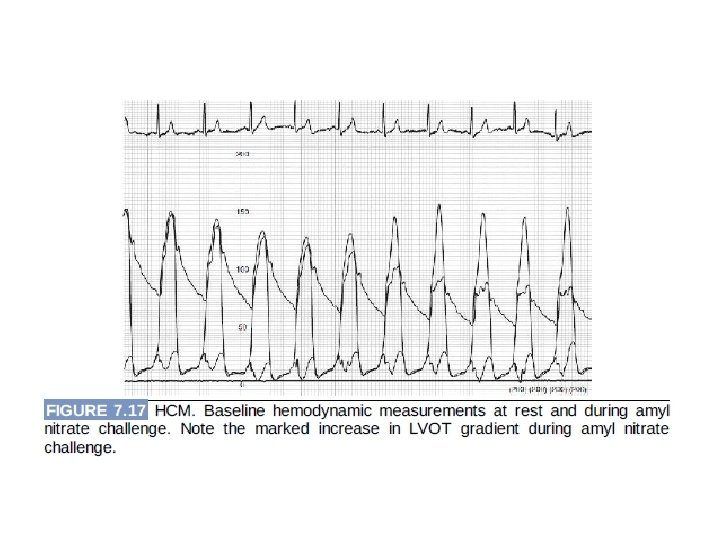
• If there is a gradient 50 mm Hg at rest, provocative maneuvers such as the valsalva maneuver or induction of a premature ventricular contraction should be performed • However, if a gradient is not provoked with these maneuvers, infusion of isoproterenol is helpful because direct stimulation of beta 1 and beta 2 receptors simulates exercise and may uncover labile outflow tract gradient.
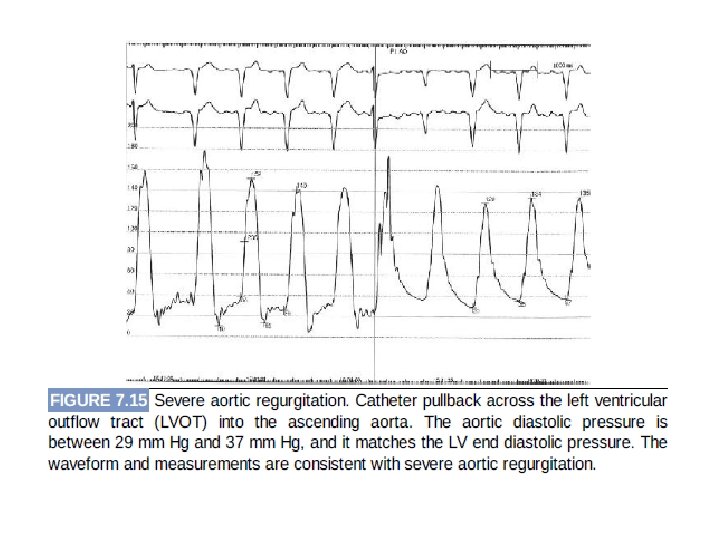
AR
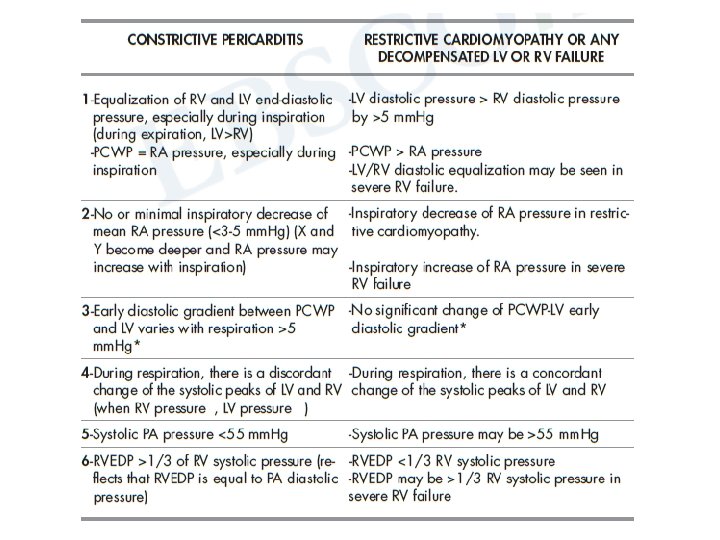
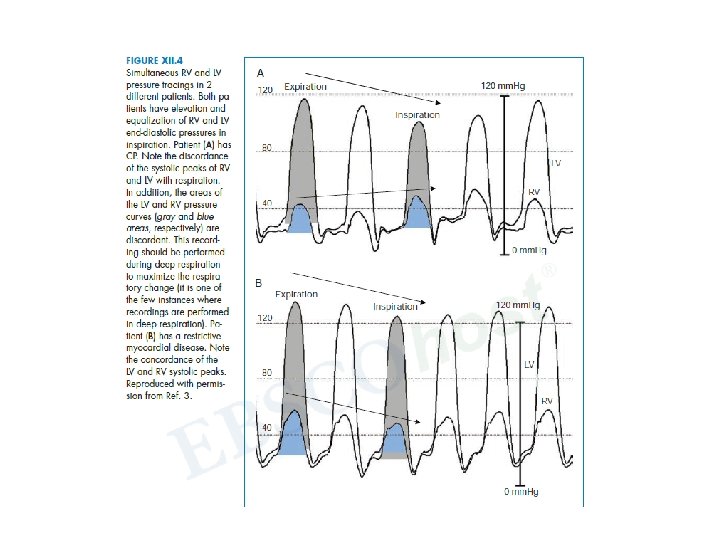
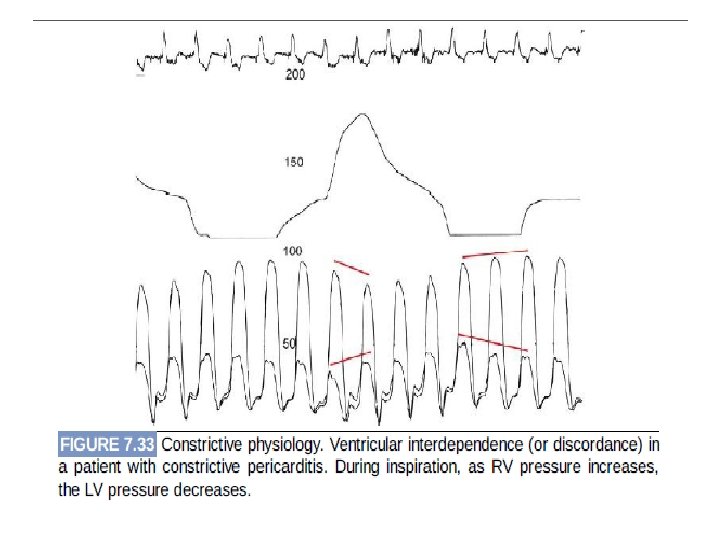
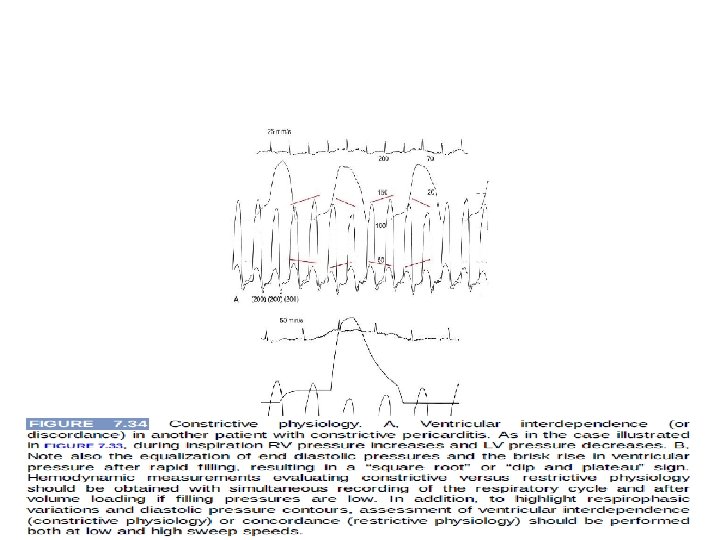
Constrictive pericarditis vs Restrictive cardiomyopathy
• Features shared by constrictive pericarditis, restrictive cardiomyopathy, and decompensated ventricular failure 1. Elevated right- and left-sided filling pressures (elevated RA pressure and PCWP) 2. Ventricular dip-plateau pattern 3. Deep atrial X and Y descents with an atrial M morphology
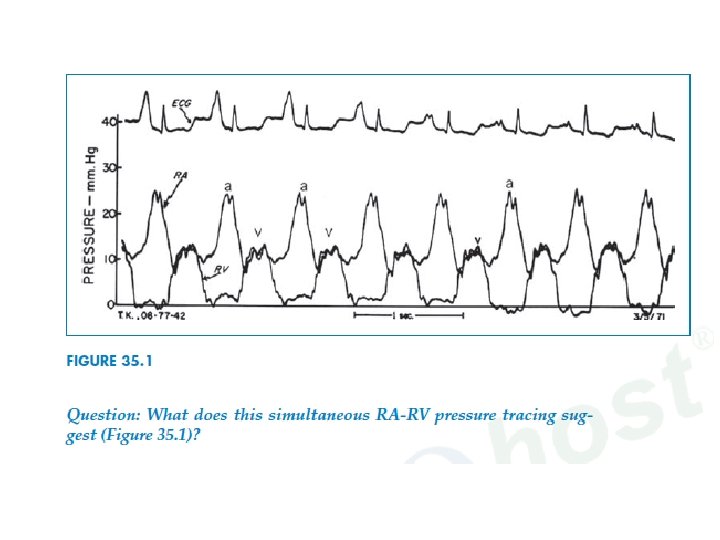
Which chambers are represented by this simultaneous recording ? What diagnosis is suggested?
• LV pressure and PCWP tracings are represented in Figure. • V wave is gigantic, over 2 times the mean PCWP, suggesting severe MR. • The large V wave makes PCWP simulate PA pressure tracing. However, as • opposed to PA pressure: 1. V wave peaks after the end of T wave • 2. The interval between V waves is horizontal (blue bars) • 3. V wave peak almost intersects with the descent of LV pressure • The patient has atrial fibrillation, hence A waves are not seen. Only • V waves and Y descents are seen. This patient has severe acute MR related • to papillary muscle fibrosis and dysfunction related to infarction.
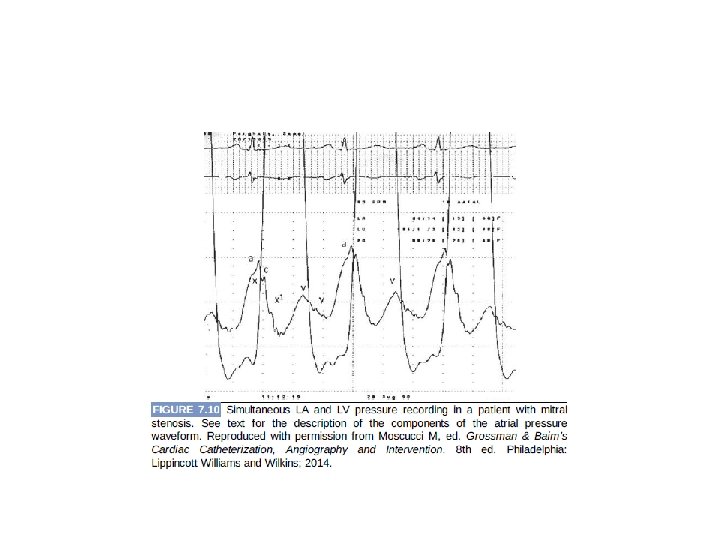
• There is a very large diastolic pressure gradient of ~25 mm. Hg between the RA and the RV, suggesting tricuspid stenosis. • RA A wave is severely increased, a typical finding in tricuspid stenosis. The RV systolic pressure is severely reduced (~10 mm. Hg), lower than the mean RA pressure, and the RV diastolic pressure has lost its A wave as a result of the reduced RV filling. • This patient is found to have an RA myxoma that is causing severe tricuspid obstruction.
Thank you