MondayTuesday Thermodynamics of aqueous solutions Ion association Pitzer


![Mass-Action Equations Ca+2 + SO 4 -2 = Ca. SO 40 [] indicates activity Mass-Action Equations Ca+2 + SO 4 -2 = Ca. SO 40 [] indicates activity](https://slidetodoc.com/presentation_image/4d6b98f8dda8f663eadd138445bc6fb3/image-15.jpg)


![What is p. H? p. H = 6. 3 + log[(HCO 3 -)/(CO 2)] What is p. H? p. H = 6. 3 + log[(HCO 3 -)/(CO 2)]](https://slidetodoc.com/presentation_image/4d6b98f8dda8f663eadd138445bc6fb3/image-52.jpg)


![What is pe? Fe+2 = Fe+3 + epe = log( [Fe+3]/[Fe+2] ) + 13 What is pe? Fe+2 = Fe+3 + epe = log( [Fe+3]/[Fe+2] ) + 13](https://slidetodoc.com/presentation_image/4d6b98f8dda8f663eadd138445bc6fb3/image-57.jpg)


- Slides: 88

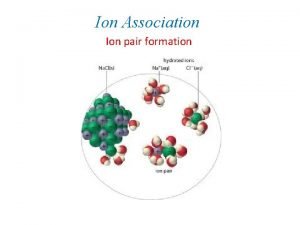
Monday-Tuesday • Thermodynamics of aqueous solutions – Ion association – Pitzer – SIT • SOLUTION – – – Units p. H—ratio of HCO 3 -/CO 2 pe—ratio of oxidized/reduced valence states Charge balance Phase boundaries • Saturation indices – Uncertainties – Useful minerals • Identify potential reactants 1

PHREEQC Programs • PHREEQC Version 3 – PHREEQC: Batch with Charting – Phreeqc. I: GUI with Charting – IPhreeqc: Module for programming and scripting • PHAST – – Serial—soon to be Multithreaded Parallel—MPI for transport and chemistry TVD (not done) 4 Windows—GUI just accepted • WEBMOD-Watershed reactive transport 2

Solutions 3

Solution Definition and Speciation Calculations SO 4 Ca Na Mg Cl Fe HCO 3 Inverse Modeling Saturation Indices Speciation calculation Reactions Transport 4

SOLUTION: Seawater, ppm Constituent p. H pe Temperature Ca Mg Na K Fe Alkalinity as HCO 3 Cl SO 4 Value 8. 22 8. 45 10 412. 3 1291. 8 10768 399. 1. 002 141. 682 19353 2712 5

Periodic_table. bmp 6

Initial Solution 1. Questions 1. What is the approximate molality of Ca? 2. What is the approximate alkalinity in meq/kgw? 3. What is the alkalinity concentration in mg/kgs as Ca. CO 3? 4. What effect does density have on the calculated molality? PHREEQC results are always moles or molality 7

Initial Solution 1. For most waters, we can assume most of the mass in solution is water. Mass of water in 1 kg seawater ~ 1 kg. 1. 412/40 ~ 10 mmol/kgw ~ 0. 01 molal 2. 142/61 ~ 2. 3 meq/kgw ~ 0. 0023 molal 3. 2. 3*50 ~ 116 mg/kgw as Ca. CO 3 4. None, density will only be used when concentration is specified as per liter. 8

Default Gram Formula Mass Element/Redox State Default “as” phreeqc. dat/wateq 4 f. dat Alkalinity Ca. CO 3 C, C(4) HCO 3 CH 4 NO 3 - N NH 4+ N PO 4 P Si Si. O 2 SO 4 Default GFW is defined in 4 th field of SOLUTION_MASTER_SPECIES in database file. 9

Databases • Ion association approach – – – – Phreeqc. dat—simplest (subset of Wateq 4 f. dat) Amm. dat—same as phreeqc. dat, NH 3 is separated from N Wateq 4 f. dat—more trace elements Minteq. dat—translated from minteq v 2 Minteq. v 4. dat—translated from minteq v 4 Llnl. dat—most complete set of elements, temperature dependence Iso. dat—(in development) thermodynamics of isotopes • Pitzer specific interaction approach – Pitzer. dat—Specific interaction model (many parameters) • SIT specific interaction theory – Sit. dat—Simplified specific interaction model (1 parameter) 10

PHREEQC Databases Other data blocks related to speciation SOLUTION_MASTER_SPECIES—Redox states and gram formula mass SOLUTION_SPECIES—Reaction and log K PHASES—Reaction and log K 11

Solutions • Required for all PHREEQC calculations • SOLUTION and SOLUTION _SPREAD – – – Units p. H pe Charge balance Phase boundaries • Saturation indices – Useful minerals – Identify potential reactants 12

What is a speciation calculation? • Input: – p. H – pe – Concentrations • Equations: – Mass-balance—sum of the calcium species = total calcium – Mass-action—activities of products divided by reactants = constant – Activity coefficients—function of ionic strength • Output – Molalities, activities – Saturation indices 13

Mass-Balance Equations Analyzed concentration of sulfate = (SO 4 -2) + (Mg. SO 40) + (Na. SO 4 -) + (Ca. SO 40) + (KSO 4 -) + (HSO 4 -) + (Ca. HSO 4+) + (Fe(SO 4)2 -) + (Fe. HSO 4+2) () indicates molality 14
![MassAction Equations Ca2 SO 4 2 Ca SO 40 indicates activity Mass-Action Equations Ca+2 + SO 4 -2 = Ca. SO 40 [] indicates activity](https://slidetodoc.com/presentation_image/4d6b98f8dda8f663eadd138445bc6fb3/image-15.jpg)
Mass-Action Equations Ca+2 + SO 4 -2 = Ca. SO 40 [] indicates activity 15

Activity WATEQ activity coefficient Davies activity coefficient 16

Uncharged Species bi, called the Setschenow coefficient Value of 0. 1 used in phreeqc. dat, wateq 4 f. dat. 17

Pitzer Activity Coefficients ma concentration of anion mc concentration of cation Ion specific parameters F function of ionic strength, molalities of cations and anions 18

SIT Activity Coefficients mk concentrations of ion Interaction parameter A = 0. 51, B = 1. 5 at 25 C 19

Aqueous Models Ion association – Pros • Data for most elements (Al, Si) • Redox – Cons • • Ionic strength < 1 Best only in Na, Cl medium Inconsistent thermodynamic data Temperature dependence 20

Aqueous Models • Pitzer specific interaction – Pros • High ionic strength • Thermodynamic consistency for mixtures of electrolytes – Cons • • Limited elements Little if any redox Difficult to add elements Temperature dependence 21

Aqueous Models • SIT – Pros • Possibly better for higher ionic strength than ion association • Many fewer parameters • Redox • Actinides – Cons • Poor results for gypsum/Na. Cl in my limited testing • Temperature dependence • Consistency? 22

Phreeqc. I: SOLUTION Data Block 23

Number, p. H, pe, Temperature 24

Solution Composition Set units! Default is mmol/kgw Select elements Set concentrations “As”, special units Click when done 25

Run Speciation Calculation Run Select files 26

Seawater Exercise A. Use phreeqc. dat to run a speciation calculation for file seawater. pqi B. Use file seawaterpitzer. pqi or copy input to a new buffer • • Ctrl-a (select all) Ctrl-c (copy) File->new or ctrl-n (new input file) Ctrl-v (paste) Units are ppm Constituent p. H p. E Temperature Ca Mg Na K Fe Alkalinity as HCO 3 Cl SO 4 Value 8. 22 8. 45 10 412. 3 1291. 8 10768 399. 1. 002 141. 682 19353 2712 27

Ion Association Model Results 28

Results of 2 Speciation Calculations Tile Ion Association Pitzer 29

Questions 1. Write the mass-balance equation for calcium in seawater for each database. 2. What fraction of the total is Ca+2 ion for each database? 3. What fraction of the total is Fe+3 ion for each database? 4. What are the log activity and log activity coefficient of CO 3 -2 for each database? 5. What is the saturation index of calcite for each database? 30

Initial Solution 2. Answers () indicates molality 1 a. Ca(total)= 1. 066 e-2 = (Ca+2) + (Ca. SO 4) + (Ca. HCO 3+) + (Ca. CO 3) + (Ca. OH+) + (Ca. HSO 4+) 1 b. Ca(total) = 1. 066 e-2 = (Ca+2) + (Ca. CO 3) 2 a. 9. 5/10. 7 ~ 0. 95 2 b. 1. 063/1. 066 ~ 1. 0 3 a. 3. 509 e-019 / 3. 711 e-008 ~ 1 e-11 3 b. No Fe+3 ion. 4 a. log activity CO 3 -2 = -5. 099; log gamma CO 3 -2 = -0. 68 4 b. log activity CO 3 -2 = -5. 091; log gamma CO 3 -2 = -1. 09 5 a. SI(calcite) = 0. 76 5 b. SI(calcite) = 0. 70 31

SATURATION INDEX The thermodynamic state of a mineral relative to a solution IAP is ion activity product K is equilibrium constant 32

SATURATION INDEX SI < 0, Mineral should dissolve SI > 0, Mineral should precipitate SI ~ 0, Mineral reacts fast enough to maintain equilibrium Maybe – Kinetics – Uncertainties 33

Rules for Saturation Indices • Mineral cannot dissolve if it is not present • If SI < 0 and mineral is present—the mineral could dissolve, but not precipitate • If SI > 0—the mineral could precipitate, but not dissolve • If SI ~ 0—the mineral could dissolve or precipitate to maintain equilibrium 34

Saturation Indices • SI(Calcite) • SI(CO 2(g)) = log(PCO 2) 35

Useful Mineral List Minerals that may react to equilibrium relatively quickly 36

PHREEQC: Reactions in a Beaker SOLUTION MIX + REACTION_TEMPERATURE SOLUTION EXCHANGE SURFACE REACTION BEAKER EQUILIBRIUM_ PHASES EQUILIBRIUM _PHASES EXCHANGE SURFACE KINETICS GAS_PHASE REACTION_PRESSURE GAS_PHASE 37

• Files (double click to edit) Data Tree – Simulation (END) • Keywords (double click to edit) – Data 38

Edit Screen • Text editor 39

Tree Selection • • • Input Output Database Errors Pf. W 40

Keyword Data Blocks Also right click in data tree—Insert keyword 41

Pf. W Style 42

Total Inorganic Carbon • Number of moles of carbon of valence 4 Alkalinity • Approximately HCO 3 - + 2 x. CO 3 -2 + OH- - H+ • Alkalinity is independent of PCO 2 43

SOLUTION_SPREAD 44

Carbon and Alkalinity solution_spread. pqi SOLUTION_SPREAD SELECTED_OUTPUT USER_GRAPH 45

Carbon Speciation and Alkalinity 46

p. H and pe Keywords SOLUTION—Solution composition END—End of a simulation USE—Reactant to add to beaker REACTION—Specified moles of a reaction USER_GRAPH—Charting 47

SOLUTION, mmol/kgw Constituent p. H pe Temperature Alkalinity Na Value 7 4 25 1 1 charge END 48

USE Solution 1 REACTION CO 2 1. 0 1, 100, 1000 mmol USER_GRAPH -axis_titles "CO 2 Added, mmol" "p. H" "Alkalinity" -axis_scale x_axis auto log -axis_scale sy_axis 0 0. 002 -start 10 GRAPH_X rxn 20 GRAPH_Y -LA("H+") 30 GRAPH_SY ALK -end 49

Input file p. H. pqi SOLUTION 1 temp 25 p. H 7 pe 4 redox pe units mmol/kgw density 1 Alkalinity 1 Na 1 charge -water 1 # kg END USE solution 1 REACTION 1 CO 2 1 1 10 1000 millimoles USER_GRAPH 1 -axis_titles "CO 2 Added, mmol" "p. H" "Alkalinity" -axis_scale x_axis auto log -axis_scale sy_axis 0 0. 002 -start 10 GRAPH_X rxn 20 GRAPH_Y -LA("H+") 30 GRAPH_SY ALK -end END 50

p. H is the ratio of HCO 3 - to CO 2(aq) Alkalinity is independent of PCO 2 51
![What is p H p H 6 3 logHCO 3 CO 2 What is p. H? p. H = 6. 3 + log[(HCO 3 -)/(CO 2)]](https://slidetodoc.com/presentation_image/4d6b98f8dda8f663eadd138445bc6fb3/image-52.jpg)
What is p. H? p. H = 6. 3 + log[(HCO 3 -)/(CO 2)] p. H = 10. 3 + log[(CO 3 -2)/(HCO 3 -)] p. H = log. K + log[(PO 4 -3)/(HPO 4 -2)] Questions 1. How does the p. H change when CO 2 degasses during an alkalinity titration? 2. How does p. H change when plankton respire CO 2? 3. How does p. H change when calcite dissolves? 52

SOLUTION, mmol/kgw Constituent p. H pe Temperature Fe(3) Cl Value 2 4 25 1 1 charge END 53

USE Solution 1 REACTION Fe. Cl 2 1. 0 1, 100, 1000 mmol USER_GRAPH -axis_titles "Fe. Cl 2 Added, mmol" "pe" "" -axis_scale x_axis auto log -start 10 GRAPH_X rxn 20 GRAPH_Y -LA("e-") -end 54

Input file SOLUTION 1 temp 25 p. H 3 pe 4 redox pe units mmol/kgw density 1 Cl 1 charge Fe(3) 1 -water 1 # kg END USE solution 1 REACTION 1 Fe. Cl 2 1 1 10 1000 millimoles USER_GRAPH 1 -axis_titles "Fe. Cl 2 Added, mmol" "pe" "" -axis_scale x_axis auto log -start 10 GRAPH_X rxn 20 GRAPH_Y -LA("e-") -end END 55

pe 56
![What is pe Fe2 Fe3 epe log Fe3Fe2 13 What is pe? Fe+2 = Fe+3 + epe = log( [Fe+3]/[Fe+2] ) + 13](https://slidetodoc.com/presentation_image/4d6b98f8dda8f663eadd138445bc6fb3/image-57.jpg)
What is pe? Fe+2 = Fe+3 + epe = log( [Fe+3]/[Fe+2] ) + 13 HS- + 4 H 2 O = SO 4 -2 + 9 H+ + 8 epe = log( [SO 4 -2]/[HS-] ) – 9/8 p. H + 4. 21 N 2 + 6 H 2 O = 2 NO 3 - + 12 H+ + 10 epe = 0. 1 log( [NO 3 -]2/[N 2] ) – 1. 2 p. H + 20. 7 pe = 16. 9 Eh, Eh in volts (platinum electrode measurement) 57

Redox and pe in SOLUTION Data Blocks • When do you need pe for SOLUTION? – To distribute total concentration of a redox element among redox states [e. g. Fe to Fe(2) and Fe(3)] – A few saturation indices with e- in dissociation reactions • Pyrite • Native sulfur • Manganese oxides • Can use a redox couple Fe(2)/Fe(3) in place of pe • Rarely, pe = 16. 9 Eh. (25 C and Eh in Volts). • pe options can only be applied to speciation calculations; thermodynamic pe is used for all other calculations 58

Iron Speciation with Phree. Plot 59

Redox Elements Element Redox state Species Carbon C(4) CO 2 Iron Fe(3) Fe+3 C(-4) CH 4 Fe(2) Fe+2 S(6) SO 4 -2 Manganese Mn(2) Mn+2 S(-2) HS- Arsenic As(5) As. O 4 -3 N(5) NO 3 - As(3) As. O 3 -3 N(3) NO 2 - U(6) UO 2+2 N(0) N 2 U(4) U+4 N(-3) NH 4+ Cr(6) Cr. O 4 -2 O(0) O 2 Cr(3) Cr+3 O(-2) H 2 O Se(6) Se. O 4 -2 H 2 O Se(4) Se. O 3 -2 H 2 Se(-2) HSe- Sulfur Nitrogen Oxygen Hydrogen H(1) H(0) Uranium Chromium Selenium 60

Seawater Initial Solution Fe total was entered. How were Fe(3) and Fe(2) concentrations calculated? For initial solutions For “reactions” 61

Final thoughts on pe • pe sets ratio of redox states • Some redox states are measured directly: – – NO 3 -, NO 2 -, NH 3, N 2(aq) SO 4 -2, HSO 2(aq) Sometimes Fe, As • Others can be assumed: – – – Fe, always Fe(2) except at low p. H Mn, always Mn(2) As, consider other redox elements Se, consider other redox elements U, probably U(6) V, probably V(5) 62

Berner’s Redox Environments • • Oxic Suboxic Sulfidic Methanic Thorstenson (1984) 63

64

Parkhurst and others (1996) 65

Summary on Solutions • • • Aqueous model SOLUTION p. H—Ratio of HCO 3 - to CO 2 pe—Ratio of oxidized to reduced state Saturation indices 66

Reaction Simulations • SOLUTION, SOLUTION_SPREAD, MIX, USE solution, or USE mix Equilibrium EQUILIBRIUM_PHASES EXCHANGE SURFACE SOLID_SOLUTION GAS_PHASE REACTION_TEMPERATURE REACTION_PRESSURE Nonequilibrium • END KINETICS REACTION 67

Keywords SOLUTION END USE REACTION_TEMPERATURE USER_GRAPH REACTION_PRESSURE 68

Plot the SI of Calcite with Temperature Seawater-t&p. pqi 69

SI Calcite for Seawater with T 70

SI Calcite for Seawater with P 71

Initial Solution 11. Exercise Rainwater, Concentration in mg/L Constituent p. H Ca Mg Na K C(4) Value 4. 5 0. 384 0. 043 0. 141 0. 036 ? Constituent Cl S(6) N(5) N(-3) P Value 0. 236 1. 3 0. 237 0. 208 0. 0003 1. Calculate the carbon concentration that would be in equilibrium with the atmosphere (log PCO 2 = -3. 5). 72

Initial Solution 11. Answer 1. Calculate the carbon concentration that would be in equilibrium with the atmosphere (log PCO 2 = -3. 5). 1. 1 e-5 mol C per kilogram water 73

Initial Solution 12. Exercise 1. Calculate the p. H and TDIC of a solution in equilibrium with the PCO 2 of air (10 -3. 5) at 25 C. 2. Calculate the p. H and TDIC of a solution in equilibrium with a soil-zone PCO 2 of 10 -2. 0 at 25 C. 3. Calculate the p. H and TDIC of a solution in equilibrium with a soil-zone PCO 2 of 10 -2. 0 at 10 C. 74

Initial Solution 12. Answers 1. p. H = 5. 66, TDIC = 13 umol/kgw 2. p. H = 4. 91, TDIC = 353 umol/kgw 3. p. H = 4. 87, TDIC = 552 umol/kgw 75

SATURATION INDEX The thermodynamic state of a mineral relative to a solution IAP is ion activity product K is equilibrium constant 76

SATURATION INDEX SI < 0, Mineral should dissolve SI > 0, Mineral should precipitate SI ~ 0, Mineral reacts fast enough to maintain equilibrium Maybe – Kinetics – Uncertainties 77

Rules for Saturation Indices • Mineral cannot dissolve if it is not present • If SI < 0 and mineral is present—the mineral could dissolve, but not precipitate • If SI > 0—the mineral could precipitate, but not dissolve • If SI ~ 0—the mineral could dissolve or precipitate to maintain equilibrium 78

Uncertainties in SI: Analytical data • 5% uncertainty in element concentration is. 02 units in SI. • 0. 5 p. H unit uncertainty is 0. 5 units in SI of calcite, 1. 0 unit in dolomite • 1 pe or p. H unit uncertainty is 8 units in SI of Fe. S for the following equation: SI(Fe. S) = log[Fe+3]+log[SO 4 -2]-8 p. H-8 pe-log K(Fe. S) 79

Uncertainties in SI: Equation • Much smaller uncertainty for SI(Fe. S) with the following equation : SI(Fe. S) = log[Fe+2]+log[HS-]+p. H-log K(Fe. S) • For minerals with redox elements, uncertainties are much smaller if the valence states of the elements in solution are measured. 80

Uncertainties in SI: Log K Apatite from Stumm and Morgan: Ca 5(PO 4)3(OH) = 5 Ca+2 + 3 PO 4 -3 + OH- Apatite from Wateq: log K = -55. 4 Log Ks especially uncertain for aluminosilicates 81

Useful Mineral List Minerals that may react to equilibrium relatively quickly 82

Initial Solution 13. Exercise Examine solution compositions in spreadsheet “solution_spread. xls”. Calculate saturation indices using phreeqc. dat. Try out Run. Phreeqc macro or copy/paste into Phreeqc. I. What can you infer about the hydrologic setting, mineralogy, and possible reactions for these waters? 83

Solution_spread. xls + is 13. xls 84

Summary Aqueous speciation model – Mole-balance equations—Sum of species containing Ca equals total analyzed Ca – Aqueous mass-action equations—Activity of products over reactants equal a constant Activity coefficient model – • • – Ion association with individual activity coefficients Pitzer specific interaction approach SI=log(IAP/K) 85

Summary SOLUTION and SOLUTION _SPREAD – – – Units p. H—ratio of HCO 3/CO 2 pe—ratio of oxidized/reduced valence states Charge balance Phase boundaries • Saturation indices – Uncertainties – Useful minerals • Identify potential reactants 86

87

88
 Markus pitzer
 Dr michael pitzer
 Michael pitzer
 Dan pitzer
 Reactions in aqueous solutions
 Balancing redox reactions in acidic solution
 Modern chemistry chapter 13
 Aqueous solutions module
 Chemical reactions section 3 reactions in aqueous solutions
 Freezing point chapter 13
 General properties of aqueous solutions
 Aqueous solution practice problems
 Electrical conductivity of aqueous solutions
 Chapter 4 reactions in aqueous solutions
 Are aqueous solutions homogeneous mixtures
 Are aqueous solutions homogeneous mixtures
 Solubility guidelines for aqueous solutions
 Chapter 4 reactions in aqueous solutions
 Chapter 4 reactions in aqueous solutions worksheet answers
 Which solution
 Ion dipolo
 Fuerzas dipolo dipolo ejemplos
 Fuerzas dipolo dipolo ejemplos
 London dispersion
 Dr. erukhimova
 Hittorf cell
 Types of reaction in non aqueous solvents
 For clarity of aqueous extract test container autoclaved at
 Urutan kelarutan perak halida dalam pelarut air
 Inorganic non aqueous solvents
 S solid liquid or gas
 Additional aspects of aqueous equilibria
 Chapter 15 water and aqueous systems
 Water and aqueous systems chapter 15 answers
 Do pickles conduct electricity
 Additional aspects of aqueous equilibria
 Aqueous reactions and solution stoichiometry
 An artificial cell consisting of an aqueous solution
 Aqueous acid base titration
 Heterogeneous aqueous systems
 Homogeneous aqueous systems
 Is water aqueous
 Liquid so2 as a non aqueous solvent
 Impression compound manipulation
 Elastomeric impression materials examples
 Chemsheets reactions of halogenoalkanes 2
 Aqueous equilibria
 Halogenoalkane to alcohol mechanism
 Derive henderson equation
 Brf3 is a protic solvent
 Non aqueous media
 Birdshot retinochoroidopathy
 Aqueous humor
 Aqueous ammonia
 Eye diagram pearson
 Conjunctivitis differential diagnosis
 Titrate
 Spiral organ of corti
 Monophasic liquid example
 Aldol reaction
 Chapter 15 water and aqueous systems
 Aqueous
 Assume that an aqueous solution of a cation
 Chapter 15 water and aqueous systems
 Why study thermodynamics
 Thermodynamics webquest
 Rubbing hands together energy
 Property tables thermodynamics
 Internal energy formula thermodynamics
 Nozzle and diffuser
 First law of thermodynamics for open system
 Thermodynamics deals with
 Stat mech
 Mech
Mech Zeroth law of thermodynamics definition
 Third law of thermodynamics derivation
 Zeroth law of thermodynamics statement
 Engineering thermodynamics
 First law of thermodynamics
 Cyclic process thermodynamics
 Residual properties in thermodynamics
 Laws of thermodynamics simple
 Statistical thermodynamics is a study of
 Free energy
 In a spontaneous irreversible process
 Isentropic compressor
 Thermodynamics 1 formula sheet
 Thermodynamic equilibrium definition
 Cop of refrigerator


