
Chapter 15 Applications of Aqueous Equilibria The Common
Chapter 15 Applications of Aqueous Equilibria
The Common Ion Effect • When the salt with the anion of a weak acid is added to an acid, – It reverses the dissociation of the acid. – Lowers the percent dissociation of the acid. • The same principle applies to salts with the cation of a weak base. • Common Ion Effect: Shift in equilibrium position that occurs when ion is added that is already part of equilibrium reaction. • Example: Na. F is added to HF solution. • The calculations are the same as last chapter. Thinkwell: The Common Ion Effect
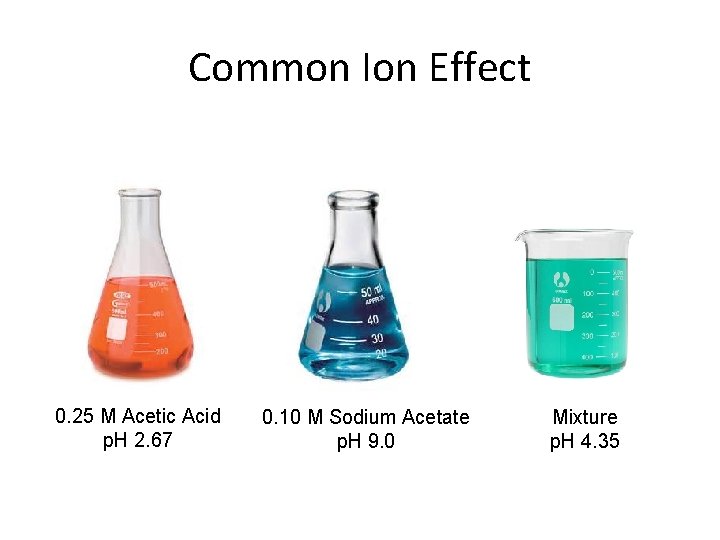
Common Ion Effect 0. 25 M Acetic Acid p. H 2. 67 0. 10 M Sodium Acetate p. H 9. 0 Mixture p. H 4. 35
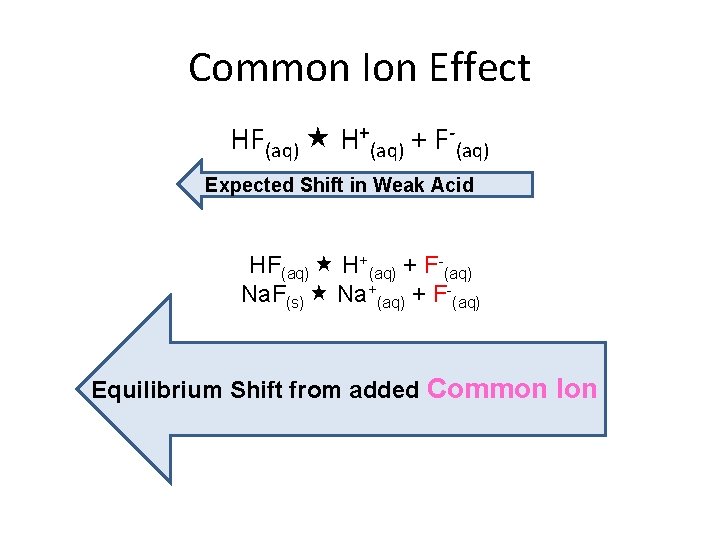
Common Ion Effect HF(aq) H+(aq) + F-(aq) Expected Shift in Weak Acid HF(aq) H+(aq) + F-(aq) Na. F(s) Na+(aq) + F-(aq) Equilibrium Shift from added Common Ion
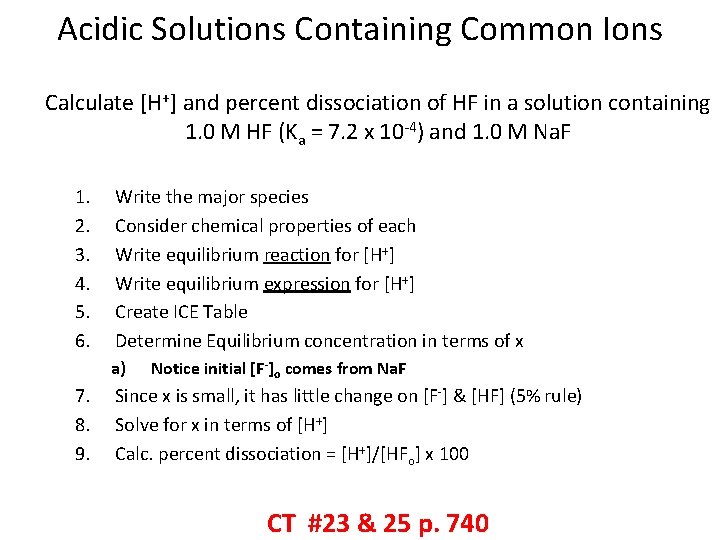
Acidic Solutions Containing Common Ions Calculate [H+] and percent dissociation of HF in a solution containing 1. 0 M HF (Ka = 7. 2 x 10 -4) and 1. 0 M Na. F 1. 2. 3. 4. 5. 6. Write the major species Consider chemical properties of each Write equilibrium reaction for [H+] Write equilibrium expression for [H+] Create ICE Table Determine Equilibrium concentration in terms of x a) 7. 8. 9. Notice initial [F-]o comes from Na. F Since x is small, it has little change on [F-] & [HF] (5% rule) Solve for x in terms of [H+] Calc. percent dissociation = [H+]/[HFo] x 100 CT #23 & 25 p. 740
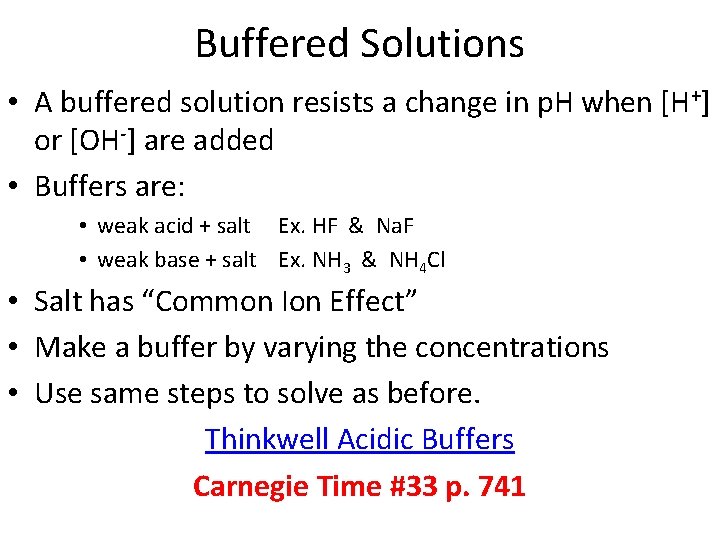
Buffered Solutions • A buffered solution resists a change in p. H when [H+] or [OH-] are added • Buffers are: • weak acid + salt Ex. HF & Na. F • weak base + salt Ex. NH 3 & NH 4 Cl • Salt has “Common Ion Effect” • Make a buffer by varying the concentrations • Use same steps to solve as before. Thinkwell Acidic Buffers Carnegie Time #33 p. 741
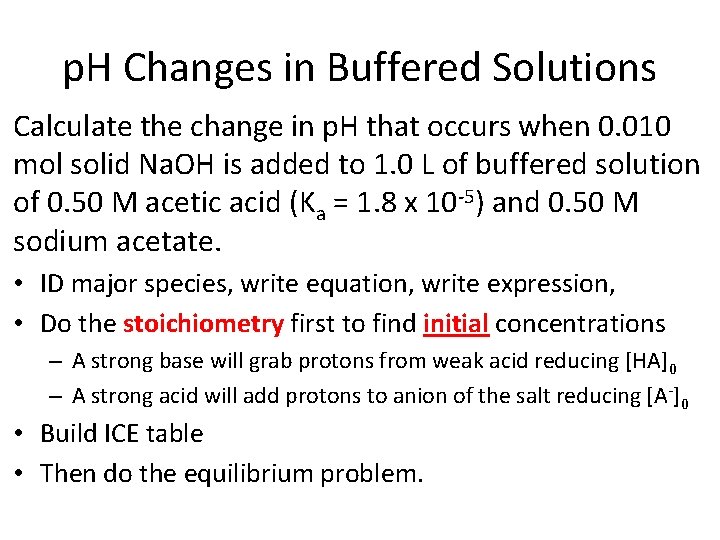
p. H Changes in Buffered Solutions Calculate the change in p. H that occurs when 0. 010 mol solid Na. OH is added to 1. 0 L of buffered solution of 0. 50 M acetic acid (Ka = 1. 8 x 10 -5) and 0. 50 M sodium acetate. • ID major species, write equation, write expression, • Do the stoichiometry first to find initial concentrations – A strong base will grab protons from weak acid reducing [HA]0 – A strong acid will add protons to anion of the salt reducing [A-]0 • Build ICE table • Then do the equilibrium problem.
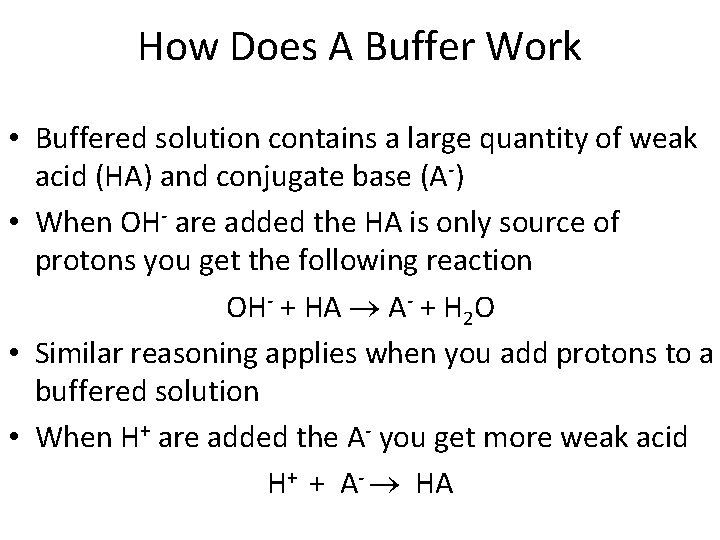
How Does A Buffer Work • Buffered solution contains a large quantity of weak acid (HA) and conjugate base (A-) • When OH- are added the HA is only source of protons you get the following reaction OH- + HA A- + H 2 O • Similar reasoning applies when you add protons to a buffered solution • When H+ are added the A- you get more weak acid H+ + A- HA
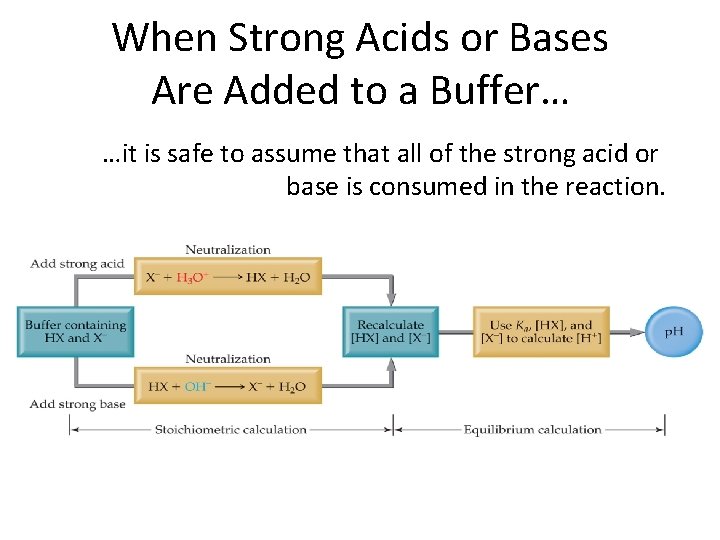
When Strong Acids or Bases Are Added to a Buffer… …it is safe to assume that all of the strong acid or base is consumed in the reaction.
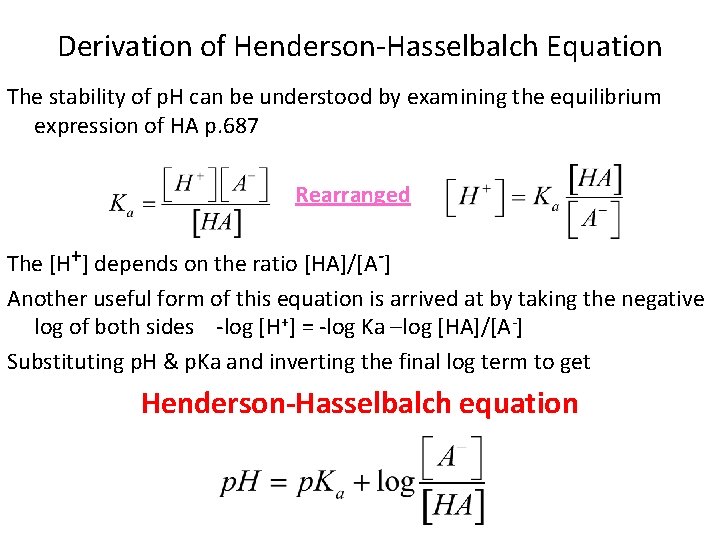
Derivation of Henderson-Hasselbalch Equation The stability of p. H can be understood by examining the equilibrium expression of HA p. 687 Rearranged The [H+] depends on the ratio [HA]/[A-] Another useful form of this equation is arrived at by taking the negative log of both sides -log [H+] = -log Ka –log [HA]/[A-] Substituting p. H & p. Ka and inverting the final log term to get Henderson-Hasselbalch equation
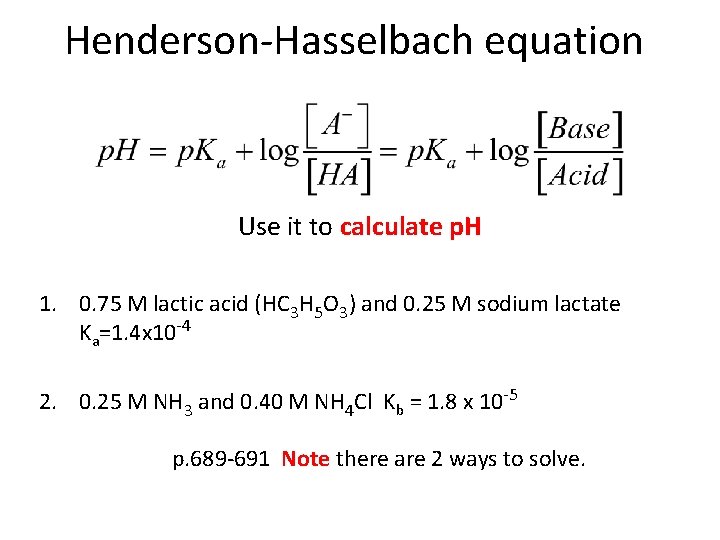
Henderson-Hasselbach equation Use it to calculate p. H 1. 0. 75 M lactic acid (HC 3 H 5 O 3) and 0. 25 M sodium lactate Ka=1. 4 x 10 -4 2. 0. 25 M NH 3 and 0. 40 M NH 4 Cl Kb = 1. 8 x 10 -5 p. 689 -691 Note there are 2 ways to solve.
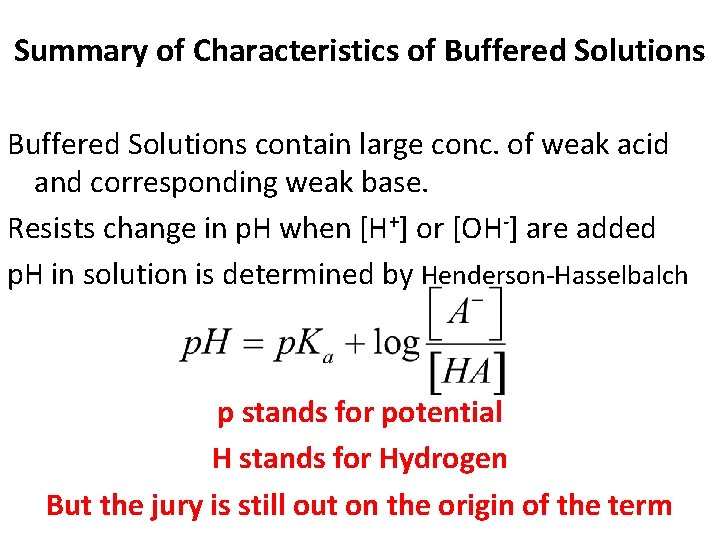
Summary of Characteristics of Buffered Solutions contain large conc. of weak acid and corresponding weak base. Resists change in p. H when [H+] or [OH-] are added p. H in solution is determined by Henderson-Hasselbalch p stands for potential H stands for Hydrogen But the jury is still out on the origin of the term
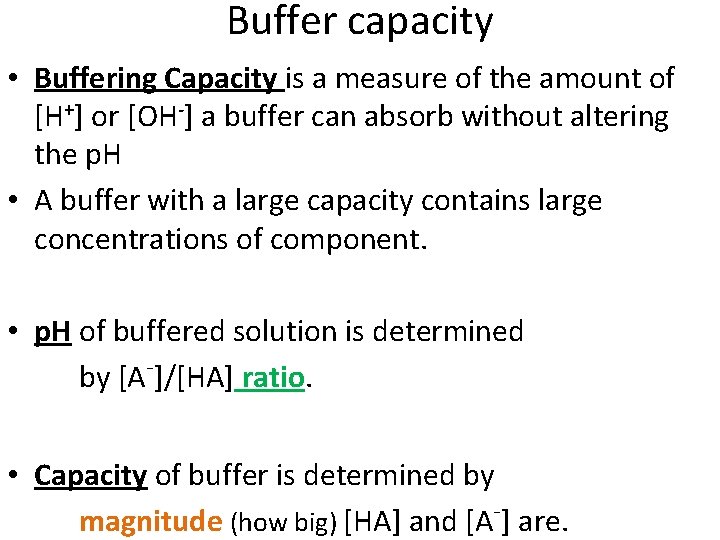
Buffer capacity • Buffering Capacity is a measure of the amount of [H+] or [OH-] a buffer can absorb without altering the p. H • A buffer with a large capacity contains large concentrations of component. • p. H of buffered solution is determined by [A-]/[HA] ratio. • Capacity of buffer is determined by magnitude (how big) [HA] and [A-] are.
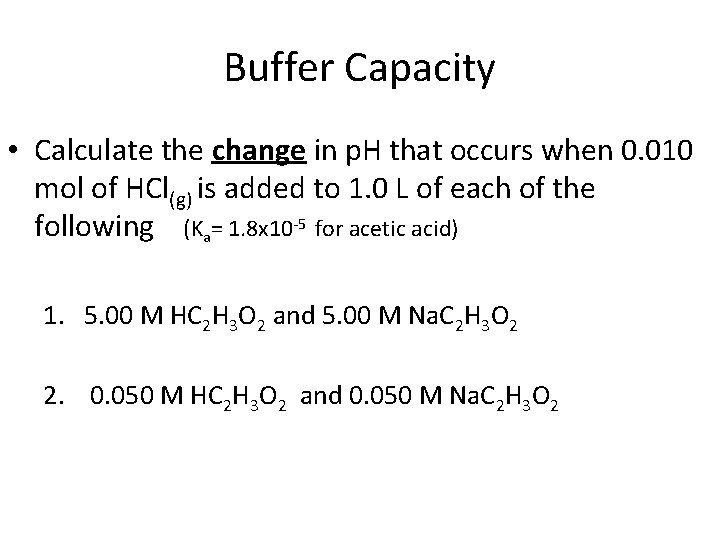
Buffer Capacity • Calculate the change in p. H that occurs when 0. 010 mol of HCl(g) is added to 1. 0 L of each of the following (Ka= 1. 8 x 10 -5 for acetic acid) 1. 5. 00 M HC 2 H 3 O 2 and 5. 00 M Na. C 2 H 3 O 2 2. 0. 050 M HC 2 H 3 O 2 and 0. 050 M Na. C 2 H 3 O 2
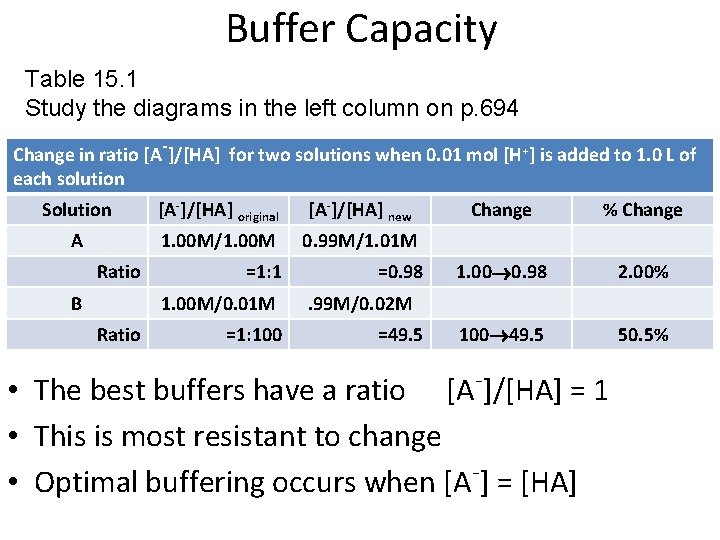
Buffer Capacity Table 15. 1 Study the diagrams in the left column on p. 694 Change in ratio [A-]/[HA] for two solutions when 0. 01 mol [H+] is added to 1. 0 L of each solution Solution [A-]/[HA] original [A-]/[HA] new A 1. 00 M/1. 00 M 0. 99 M/1. 01 M Ratio B =1: 1 1. 00 M/0. 01 M Ratio =1: 100 =0. 98 Change % Change 1. 00 0. 98 2. 00% 100 49. 5 50. 5% . 99 M/0. 02 M =49. 5 • The best buffers have a ratio [A-]/[HA] = 1 • This is most resistant to change • Optimal buffering occurs when [A-] = [HA]
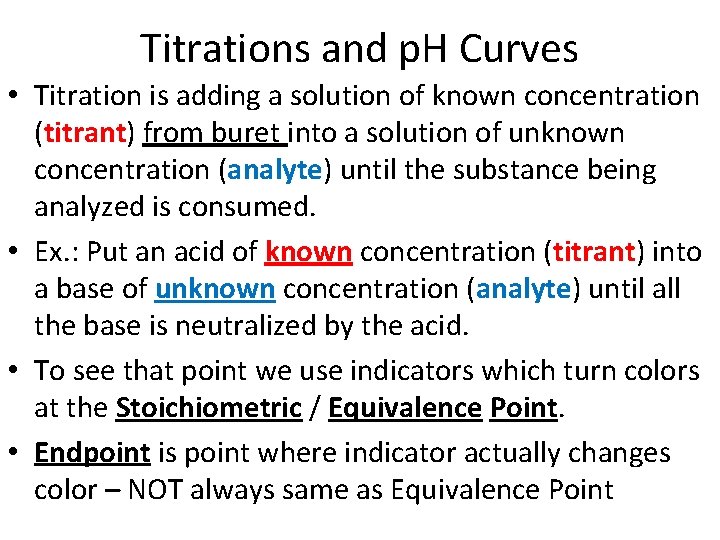
Titrations and p. H Curves • Titration is adding a solution of known concentration (titrant) from buret into a solution of unknown concentration (analyte) until the substance being analyzed is consumed. • Ex. : Put an acid of known concentration (titrant) into a base of unknown concentration (analyte) until all the base is neutralized by the acid. • To see that point we use indicators which turn colors at the Stoichiometric / Equivalence Point. • Endpoint is point where indicator actually changes color – NOT always same as Equivalence Point
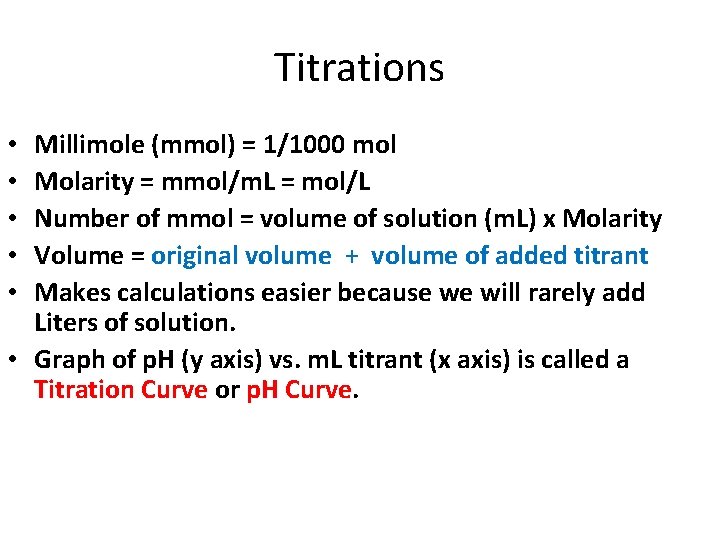
Titrations Millimole (mmol) = 1/1000 mol Molarity = mmol/m. L = mol/L Number of mmol = volume of solution (m. L) x Molarity Volume = original volume + volume of added titrant Makes calculations easier because we will rarely add Liters of solution. • Graph of p. H (y axis) vs. m. L titrant (x axis) is called a Titration Curve or p. H Curve. • • •
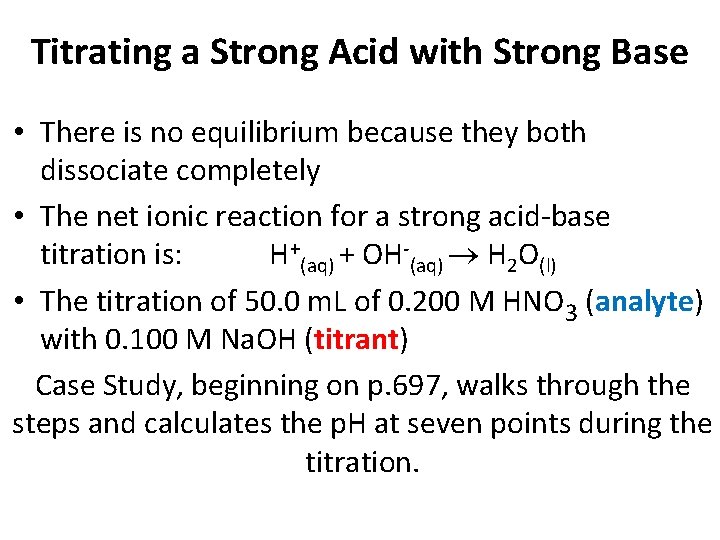
Titrating a Strong Acid with Strong Base • There is no equilibrium because they both dissociate completely • The net ionic reaction for a strong acid-base titration is: H+(aq) + OH-(aq) H 2 O(l) • The titration of 50. 0 m. L of 0. 200 M HNO 3 (analyte) with 0. 100 M Na. OH (titrant) Case Study, beginning on p. 697, walks through the steps and calculates the p. H at seven points during the titration.
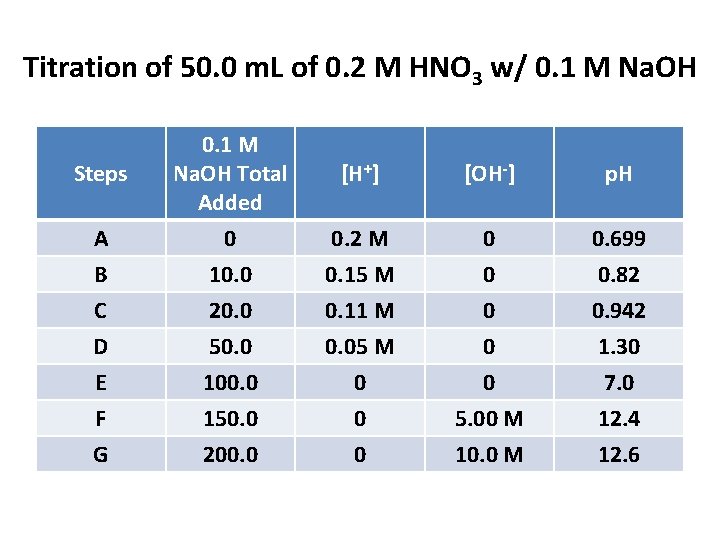
Titration of 50. 0 m. L of 0. 2 M HNO 3 w/ 0. 1 M Na. OH Steps 0. 1 M Na. OH Total Added [H+] [OH-] p. H A 0 0. 2 M 0 0. 699 B 10. 0 0. 15 M 0 0. 82 C 20. 0 0. 11 M 0 0. 942 D 50. 05 M 0 1. 30 E 100. 0 0 0 7. 0 F 150. 0 0 5. 00 M 12. 4 G 200. 0 0 10. 0 M 12. 6
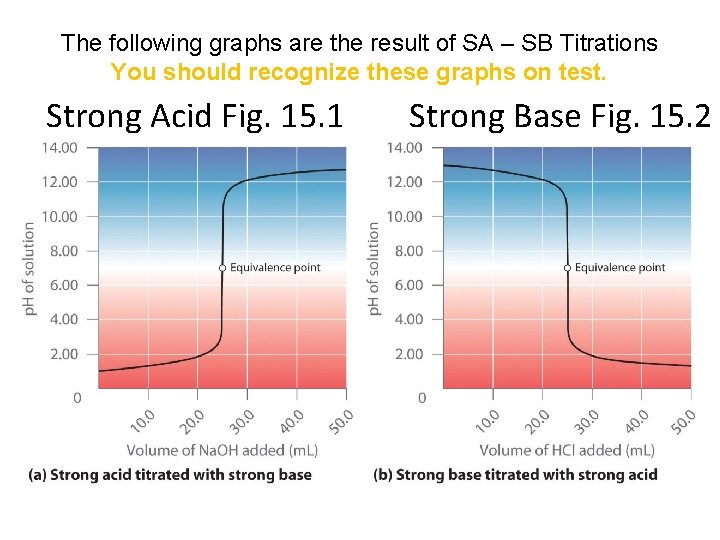
The following graphs are the result of SA – SB Titrations You should recognize these graphs on test. Strong Acid Fig. 15. 1 Strong Base Fig. 15. 2
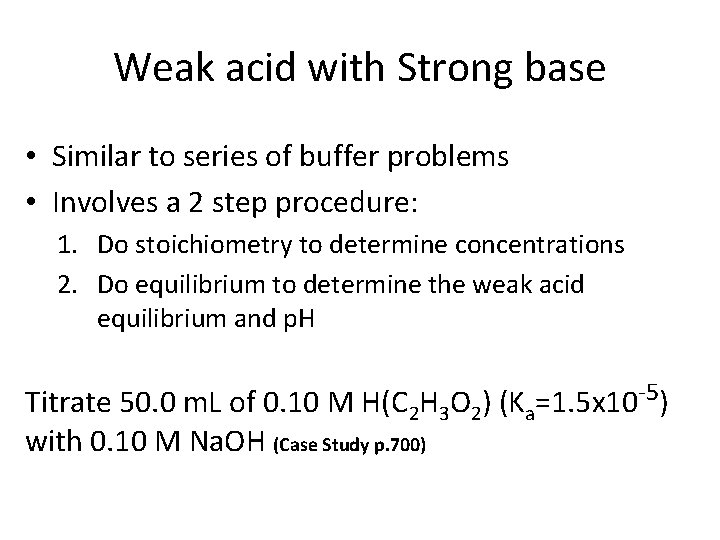
Weak acid with Strong base • Similar to series of buffer problems • Involves a 2 step procedure: 1. Do stoichiometry to determine concentrations 2. Do equilibrium to determine the weak acid equilibrium and p. H Titrate 50. 0 m. L of 0. 10 M H(C 2 H 3 O 2) (Ka=1. 5 x 10 -5) with 0. 10 M Na. OH (Case Study p. 700)
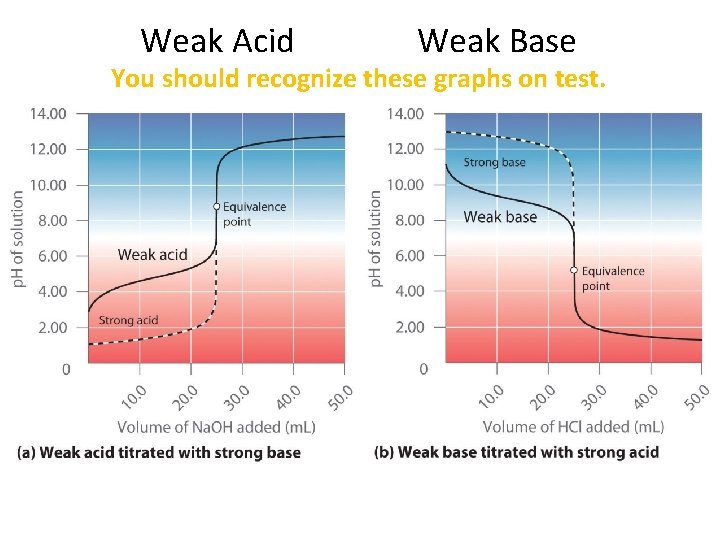
Weak Acid Weak Base You should recognize these graphs on test.
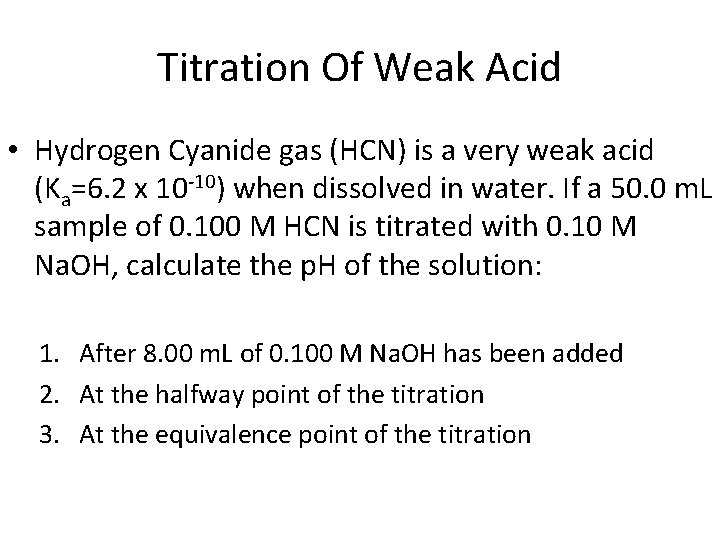
Titration Of Weak Acid • Hydrogen Cyanide gas (HCN) is a very weak acid (Ka=6. 2 x 10 -10) when dissolved in water. If a 50. 0 m. L sample of 0. 100 M HCN is titrated with 0. 10 M Na. OH, calculate the p. H of the solution: 1. After 8. 00 m. L of 0. 100 M Na. OH has been added 2. At the halfway point of the titration 3. At the equivalence point of the titration
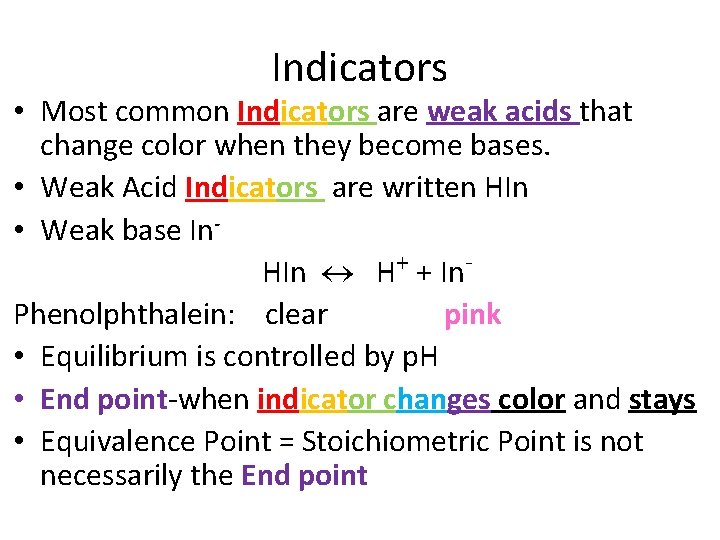
Indicators • Most common Indicators are weak acids that change color when they become bases. • Weak Acid Indicators are written HIn • Weak base In. HIn H+ + In. Phenolphthalein: clear pink • Equilibrium is controlled by p. H • End point-when indicator changes color and stays • Equivalence Point = Stoichiometric Point is not necessarily the End point
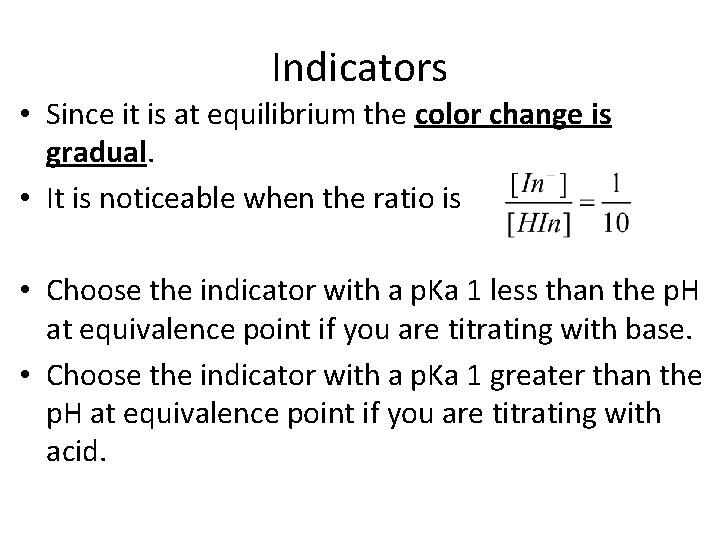
Indicators • Since it is at equilibrium the color change is gradual. • It is noticeable when the ratio is • Choose the indicator with a p. Ka 1 less than the p. H at equivalence point if you are titrating with base. • Choose the indicator with a p. Ka 1 greater than the p. H at equivalence point if you are titrating with acid.
Solubility Equilibria • Any dissociating problem is an equilibrium problem • If there is not much solid it will all dissociate • As more solid is added the solution will become saturated • Solid dissolved • The solid will precipitate as fast as it dissolves • Resulting in Equilibrium which can be used to set up an equilibrium constant expression
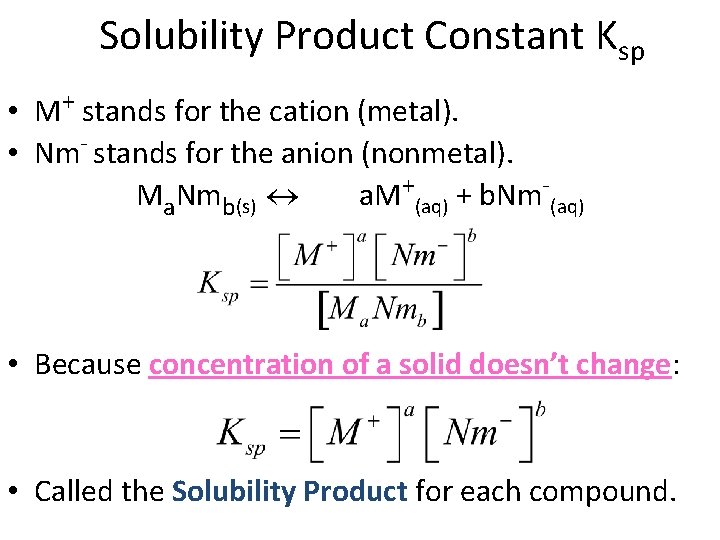
Solubility Product Constant Ksp • M+ stands for the cation (metal). • Nm- stands for the anion (nonmetal). Ma. Nmb(s) a. M+(aq) + b. Nm-(aq) • Because concentration of a solid doesn’t change: • Called the Solubility Product for each compound.
Solubility Equilibria • Solubility product = product of the concentration of ions in equation, raised to power of coefficients • Solubility is not the same as solubility product • Solubility product is an equilibrium constant • It doesn’t change except with temperature • Solubility is an equilibrium position for how much can dissolve at a certain temperature. • A common ion can change Solubility • See p. 718 & appendix p. A 24 for Table of Ksp values
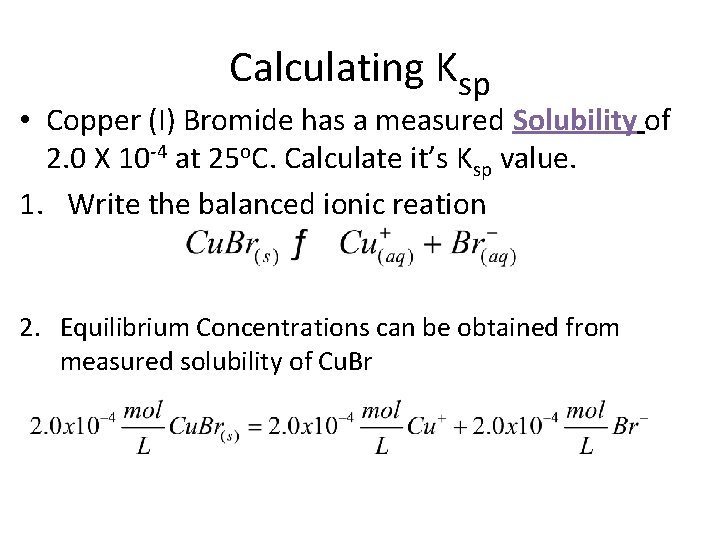
Calculating Ksp • Copper (I) Bromide has a measured Solubility of 2. 0 X 10 -4 at 25 o. C. Calculate it’s Ksp value. 1. Write the balanced ionic reation 2. Equilibrium Concentrations can be obtained from measured solubility of Cu. Br
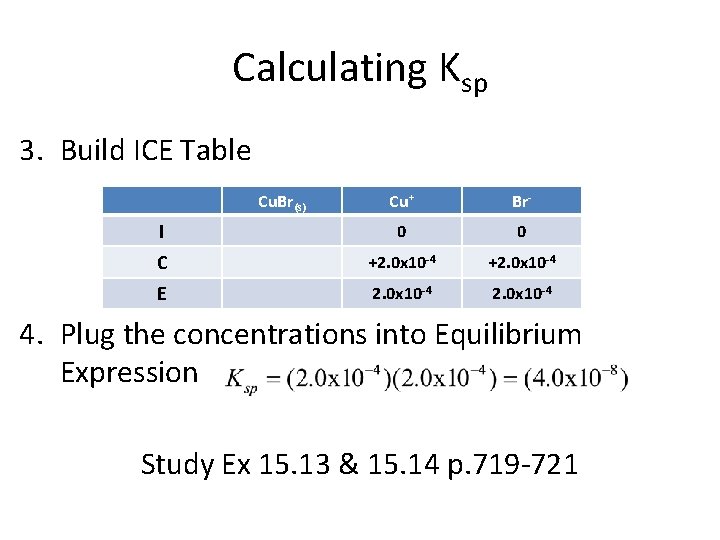
Calculating Ksp 3. Build ICE Table Cu. Br(s) Cu+ Br- I 0 0 C +2. 0 x 10 -4 E 2. 0 x 10 -4 4. Plug the concentrations into Equilibrium Expression Study Ex 15. 13 & 15. 14 p. 719 -721
Relative Solubility • Relative Solubility will only allow us to compare the Solubility of solids that fall apart into the same total number of ions. See description p. 721 • 3 FACTORS AFFECT Solubility OF IONIC SUBSTANCES: 1. 2. 3. COMMON ION p. H COMPLEX IONS Common Ion Effect • If we try to dissolve the solid in a solution with either the cation or anion already present less will dissolve, equilibrium will shift to the left. Study Ex. 15 p 723
p. H and solubility • p. H greatly affects salt’s solubility • Adding OH- or removing [H+] increases p. H decreases solubility, forces equilibrium to left • Removing OH- or adding [H+] decreases p. H increases solubility, forces equilibrium to right • For other anions if they come from a weak acid they are more soluble in a acidic solution than in water
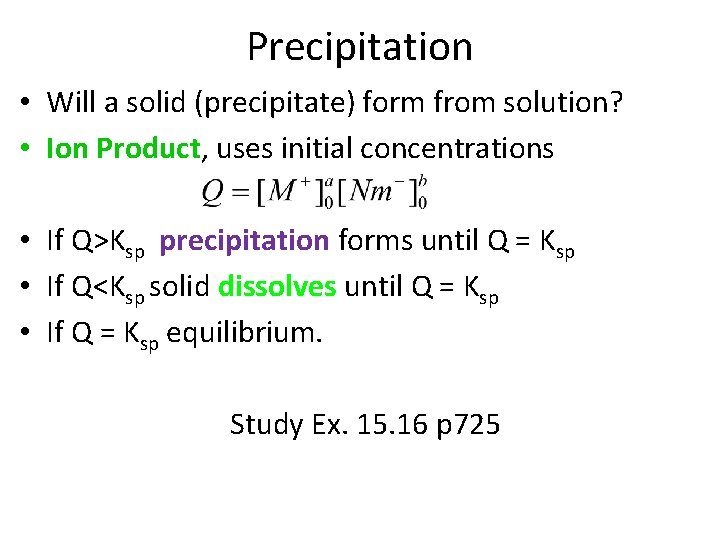
Precipitation • Will a solid (precipitate) form from solution? • Ion Product, uses initial concentrations • If Q>Ksp precipitation forms until Q = Ksp • If Q<Ksp solid dissolves until Q = Ksp • If Q = Ksp equilibrium. Study Ex. 15. 16 p 725
Selective Precipitations • Used to separate mixtures of metal ions in solutions. • Add anions that will only precipitate certain metals at a time. • Used to purify mixtures. Study Ex 15. 18 p. 728
Complex Ion Equilibria • Complex Ion is a charged species consisting of metal ion surrounded by ligand • Ligand is a Lewis base using their lone pair to stabilize the charged metal ions • Common ligands are NH 3, H 2 O, Cl-, CN • Coordination number is the number of attached ligands, most common numbers are 6, 4 & 2 • Ex. Co(H 2 O)6+2 has a coordination # of 6 • Ex. Cu(NH 3)4+2 has a coordination # of 4 • Ex. Ag(NH 3)2+ has a coordination # of 2
Complex Ion Equilibria • Usually the ligand is in large excess. • Metal ions usually add Ligands 1 step at a time: Example Ag+ + NH 3 Ag(NH 3)+ K 1 = 2. 1 x 10³ Ag(NH 3)+ + NH 3 Ag(NH 3)2+ K 2 = 8. 2 x 10³ • The formation constant or stability constant is Kx where x = step number • Individual K’s will be large so treat them as if reactions goes to equilibrium. • The complex ion will be the biggest ion in solution.
Summary • Strong acid and base just stoichiometry. • Weak acid before equivalence point –Stoichiometry –Henderson-Hasselbach • Weak acid at equivalence point Kb • Weak base after equivalence - leftover strong base.
- Slides: 37