Ecology is the study of interactions among organisms


 benefits")


 that is exposed by avalanches,")


 Denitrifying bacteria return nitrogen to the atmosphere – The Air is")


 – decreased 25%")


- Slides: 73
– Ecology is the study of interactions among organisms and their environment. – Ecosystem is a community (all the organisms in a given area) and the abiotic factors (such as water, soil, or climate) that affect them. – Stable Ecosystem – populations fluctuate at a predictable rate, supply of resources fluctuate at a predictable rate, energy flows through the system – Limiting factors – any abiotic or biotic factor that limits the numbers, reproduction, or distribution of an organism – Biotic – animals, plants, bacteria, etc. – Abiotic – water, soil, temperature, etc.
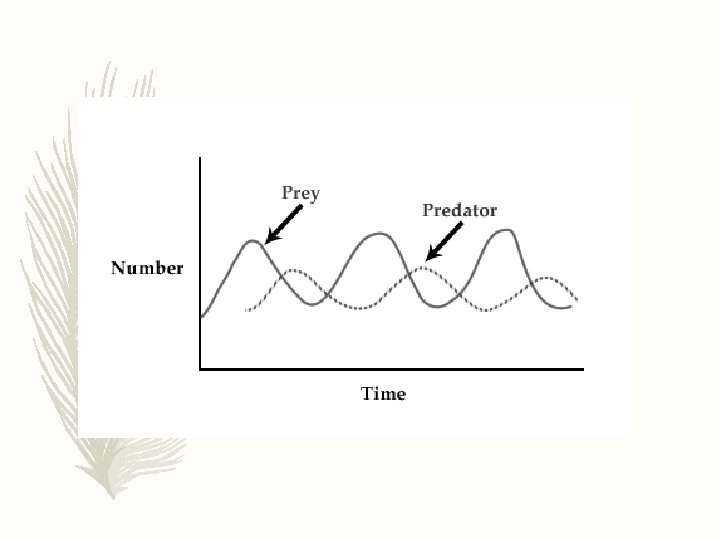
Community Interactions – Competition occurs when more than one organism uses the same resource at the same time. – Predation is when one organism eats another organism. – The organism being eaten is the prey. – The organism that eats is the predator.
– An ecological niche refers to the role of an organism in its environment including type of food it eats, how it obtains its food and how it interacts with other organisms. – Two species occupying the same niche will have to compete for resources. They will not be able to coexist.
Some organisms enhance their chances of surviving by forming symbiotic relationships – Commensalism – Mutualism – Parasitism
Parasitism – Parasitism is a symbiotic relationship in which one organism (the parasite) benefits at the expense of the other organism (the host). – Some live in or on their host – Ex: Cowbird/Other birds, Mosquito/Mammals, tapeworms/mammals
Mutualism – A symbiotic relationship in which both species benefit. – Ex: ants/acacia tree, flowering plants/pollinating insects, wood digesting bacteria/termites
Commensalism – A symbiotic relationship in which one species benefits and the other species is neither harmed or benefited. – Ex: Spanish moss/tree, barnacle/whale
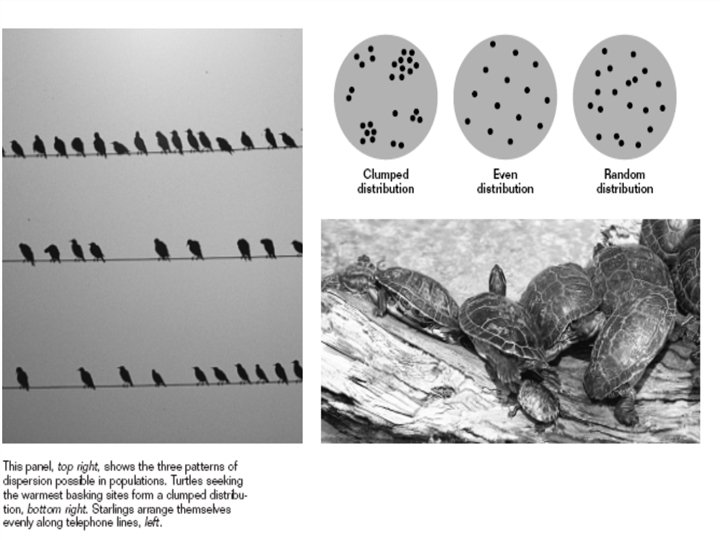
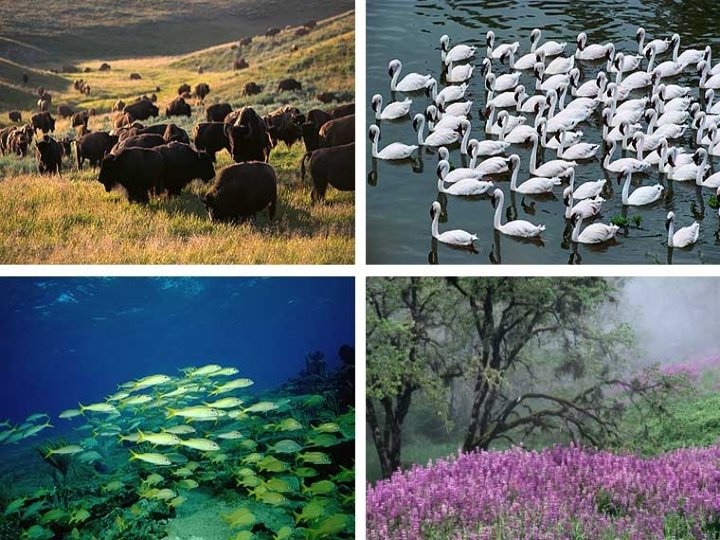
4 -1: Understanding Populations – Properties: – Size - number – Density – number/area – Dispersion: – Clumped – when food or resources are clustered – Even – defined territories (chemicals or protection) – Random – seed dispersal by wind or birds
Population Ranges – Depends on abiotic and biotic factors – Some are specialized to only certain locations – Iiwi – live only in Hawaii – Some may be able to live in larger areas – Peregrine falcon – live on all continents except Antarctica
Population Regulation – Limiting factors that affect population size: – Density-independent factors – and – Density-dependent factors
Density-dependent factors – reduce population due to an increase in population size Examples include mostly biotic factors that cause a shortage of resources (food, shelter, nesting sites, etc. ): Competition Predation Parasitism Disease
Density-independent factors – reduce population by same degree no matter population size Examples include mostly abiotic factors: weather drought floods fires seasonal cycles clear cutting forests pollution, etc
Changing Environment – Environments are constantly changing, so organisms must be able to survive a range of conditions. – How well an organism can survive different conditions (i. e. temperature & p. H) can be shown on a tolerance curve – Range of tolerance – the upper and lower limits that the organism can survive in
Tolerance Curve for Cutthroat Trout – Shows they can tolerate temps between 5 and 23°C
Acclimation/Adjustment – some organisms can change their tolerance to abiotic factors by becoming acclimated to the new condition – for example, if you raised the temperature of a goldfish bowl a degree every week, your fish might be able to tolerate higher temperatures than other goldfish
Ecological Succession: Natural changes and species replacements that take place in a community over time.
Primary Succession – Colonization of NEW land (no soil) that is exposed by avalanches, volcanoes, or glaciers to pioneer species (such as lichens and mosses). Pioneer species develop the soil that is the colonized by other plants.
Climax Community –A stable community that undergoes little or no change in species.
Secondary Succession – Sequence of changes that take place after a community is disrupted by natural disaster (fire or hurricane) or human actions. (soil present) – Occurs in all ecosystems – Forest – Pond – Coral reef – Desert
Geochemical Cycles – The energy in organisms comes from sunlight. Sunlight is an infinitely available resource. – The materials organisms are made from (water, carbon, nitrogen) are not constantly replenished like sunlight. – These materials have been recycled by the Earth since life began.
Carbon Cycle – Carbon and is cycled from an abiotic factor to existing within biotic parts of the environment and back to abiotic through photosynthesis, respiration, decomposition, combustion, and erosion/weathering of limestone rock. CO 2 + H 2 O + energy(light) C 6 H 12 O 6 + O 2 + H 2 O CO 2 + H 2 O + energy(ATP)
Carbon Cycle CO 2 C 6 H 12 O 6 CO 2
Nitrogen Cycle – Nitrogen is an element necessary to building proteins. – Nitrogen (N 2) is abundant in the atmosphere but cannot be used by plants in that form. – Nitrogen fixation - Bacteria in the soil “fix” the nitrogen so plants can use it. – The nitrogen enters the soil through animal waste and decomposition. – Denitrification - Denitrifying bacteria break down the nitrogen compounds in the soil and release nitrogen into the atmosphere.
Nitrogen Cycle (pee) Denitrifying bacteria return nitrogen to the atmosphere – The Air is 78% nitrogen but plants can’t use it.
Water Cycle/Hydrologic Cycle – Drinking water, transpiration, respiration, photosynthesis, and elimination are biotic contributions to the water cycle. – Transpiration – evaporation from leaves of plants. – http: //glencoe. mheducation. com/sites/dl/free/007869510 4/164155/00044678. html (Water Cycle Brain Pop Video)
Respiration Urination
Human Impact CLEAN WATER WASTES – An increasing population effects the amount of available clean water. – An increasing population has an effect on the amount of waste that is produced. – If clean water is being depleted at a greater rate than it can be purified, it is not considered renewable. – More waste is produced than can be managed effectively. – Some waste products require complicated and costly means for removal once they are introduced into the environment.
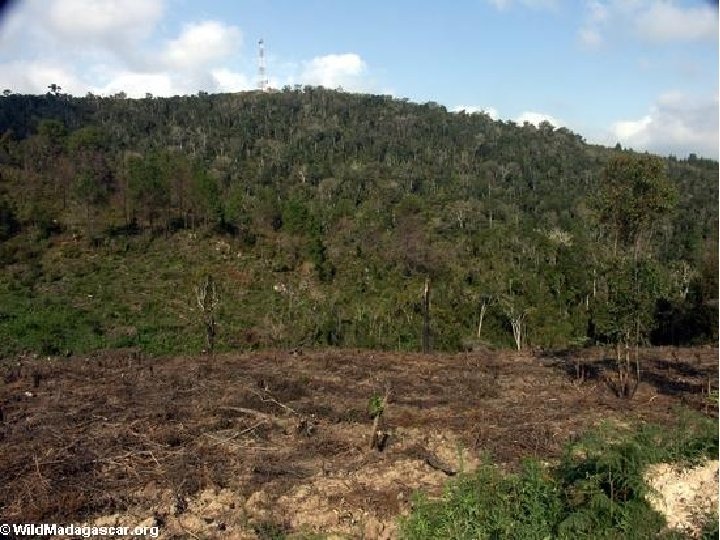
SOIL DEPLETION – An increasing population can have an effect on the amount of available fertile soil for agriculture (food resources). – Soil is often lost when land is cleared, making the land unsuitable for agriculture. DEMAND FOR LAND – Demand for land (for agriculture or habitation) has led to deforestation. – As forests are cut down, there are fewer trees to absorb atmospheric carbon dioxide. The increase in atmospheric carbon dioxide contributes to global warming. – Deforestation can increase the rate of erosion and decrease the rate of soil generation.
Earth’s Atmosphere Ozone – Ozone comes from oxygen produced from photosynthesis – It blocks a large amount of radiation from the sun
Burning of Fossil Fuels – Increases the greenhouse gases released in the atmosphere (carbon dioxide). – Increases global temperatures (global warming) that affect sea levels, climate, and atmospheric composition. – Produces acid rain (pollutants in the air combining with water to cause the normal water p. H to be lowered) – Acid rain decreases the p. H of the soil and aquatic ecosystems – Can leach nutrients from soils or destroy plant life and affect the types of organisms that can survive there.
Global Warming – Earth’s temperature depends on how much of the sun’s radiation enters the atmosphere and how much escapes back into space. – The greenhouse effect – Greenhouse gases (carbon dioxide, oxygen, methane, and water vapor) trap sunlight that normally reflects back into space. – This increases the temperature of our planet (global warming). Amount of CO 2 in the atmosphere Greenhouse effect Average Global Temperature Plant cover on Earth Rate of photosynthesis Amount of CO 2 absorbed by plants Amount of CO 2 in the atmosphere higher increases increases decreases lower decreases decreases increases
Greenhouse effect
Blue Line = Average Global Temperature Red Line = Atmospheric CO 2
Human Populations & Impact – Population Growth Rate – – – Birth rate Death rate Immigration rate (movement into a population) Emigration rate (movement out of a population) (Birth + immigration) – (death + emigration) = Growth Rate – If growth rate is negative, population is decreasing – If growth rate is positive, population is increasing
Linear Model n. Linear Growth n. A population increases by a specific increment each time. n. EX: Getting paid per hour at work
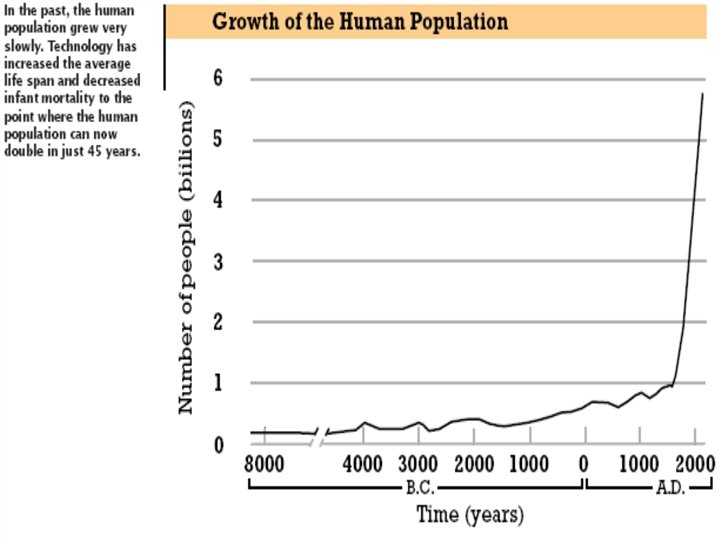
Exponential Model – J Curve – Describes a rapidly growing population after a few generations – Assumes birth and death rates are constant – Makes a J-shaped curve on a graph – Limitations to the model: – Limiting factors – factors that restrict population growth – Food, space, resources, competition, etc.
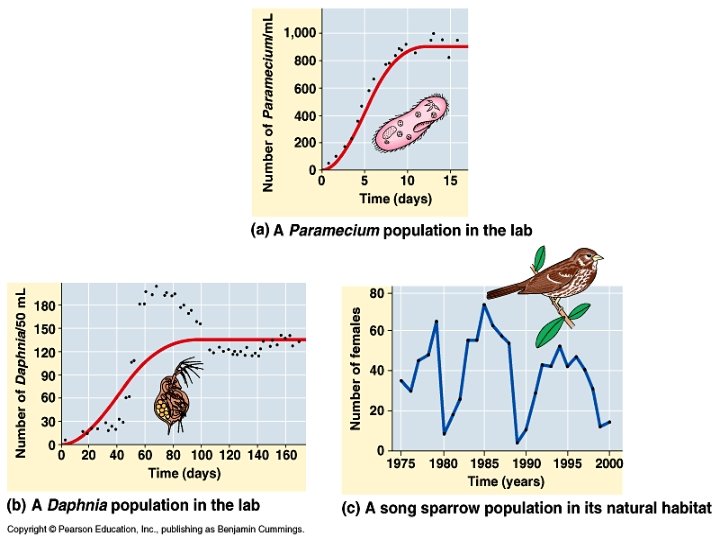
Logistic Model – S Curve – Builds on exponential model, but takes limiting factors into account – Knows birth rates decline and death rates increase as the population size increases – Determines the carrying capacity (K) – the number of individuals a population can support over a long period of time – Makes an S-shaped curve on a graph – Assumes carrying capacity is constant
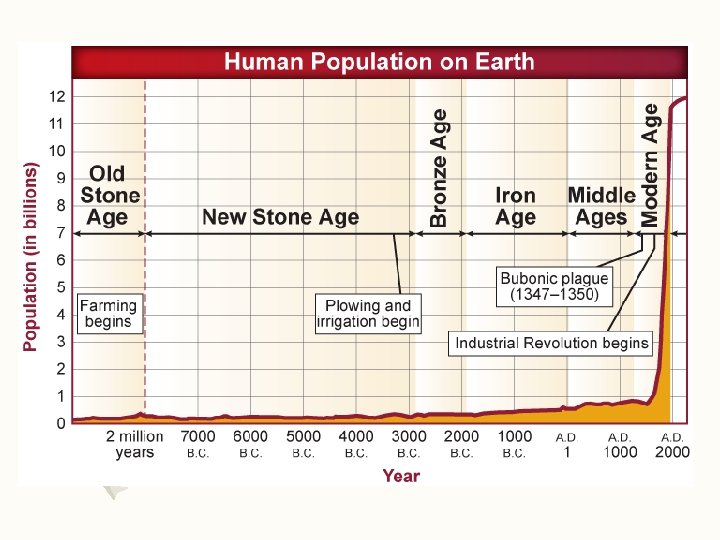
Human Population Growth – Hunter-gatherer Lifestyle – Small nomadic populations – High mortality rates among young – Slow population growth – Agricultural Revolution – Began to domesticate animals and cultivate food – Stabilizing and increasing food supplies – Population increased faster
Human Population Growth – Population Explosion: – Bubonic plague (1347 -1352) – decreased 25% of European population – Acceleration of population growth after 1650, due to a decrease in death rates with: – Increased sanitation and hygiene – Disease control – More food available – Better economic conditions
Human Population Growth Today – Global growth rate at all time high in the 1960 s at 0. 021 per capita – Growth rate is slowly decreasing due to a decrease in birth rates (currently at 0. 014) – Sample problems: – 1970 had 3. 7 billion people with rate of 0. 0196 – 1999 had 6 billion people with rate of 0. 014 – October 31, 2011 – 7 billion people worldwide
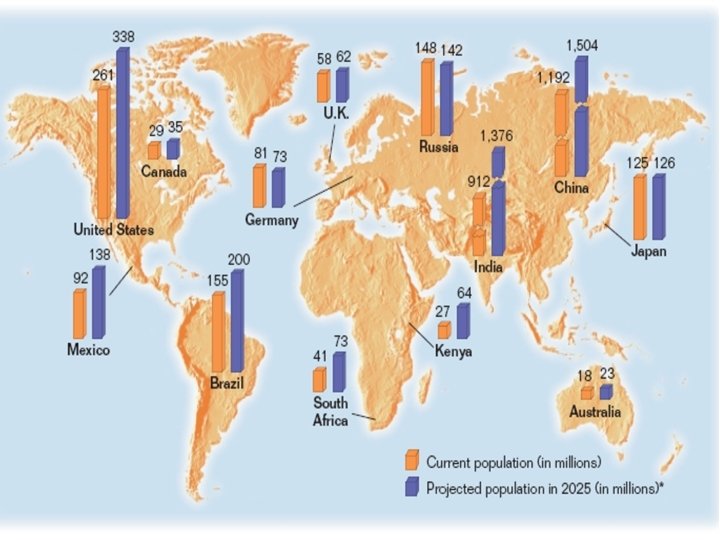
Population Today – Developed countries – modern, industrialized countries – United States, Japan, Germany, France, the United Kingdom, Australia, Canada, and Russia – 20% of population w/ growth rate of 0. 01 per capita – Undeveloped countries – poorer nonindustrialized countries – Most of Asia, Central America, South America, and Africa – 80% of population w/ growth rate of 0. 02 per capita
Population Dynamics – Dynamic – change in size and composition over time – Birth rate – Death rate (mortality rate) – Life expectancy – Age structure – Patterns of mortality – Demography – study of human populations
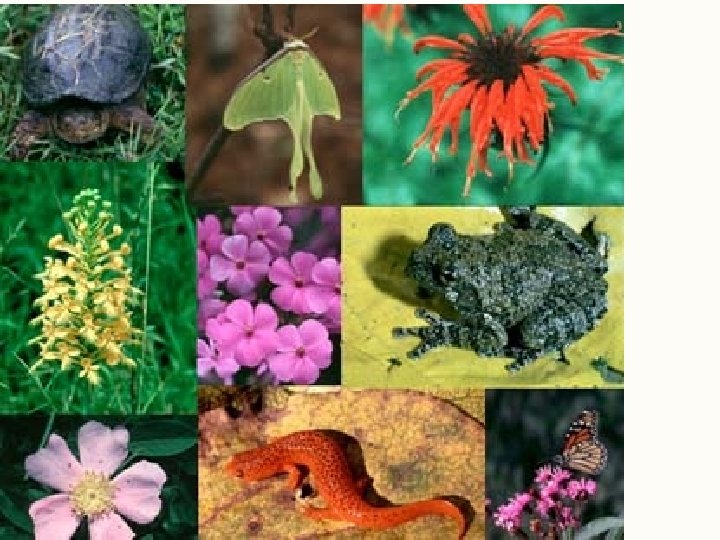
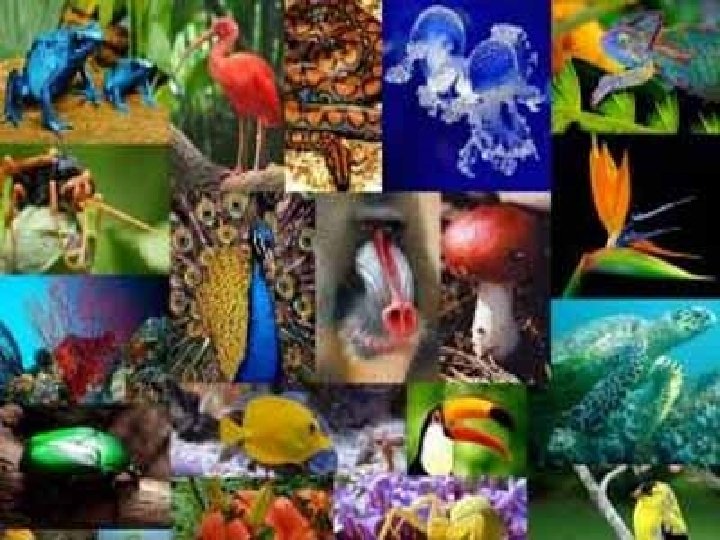
Biodiversity – variation of living things in an area – Genetic diversity – variation of genes in a population – Species diversity – variation in the number of species in an area – Ecosystem diversity – variation of ecosystems within the biosphere – Extinction – the complete loss of a species
Importance of Biodiversity – Economic value – Provides medicines and shelters – Provides food, clothing, energy, – Aesthetic value – Beauty – Scientific value – Useful information to study
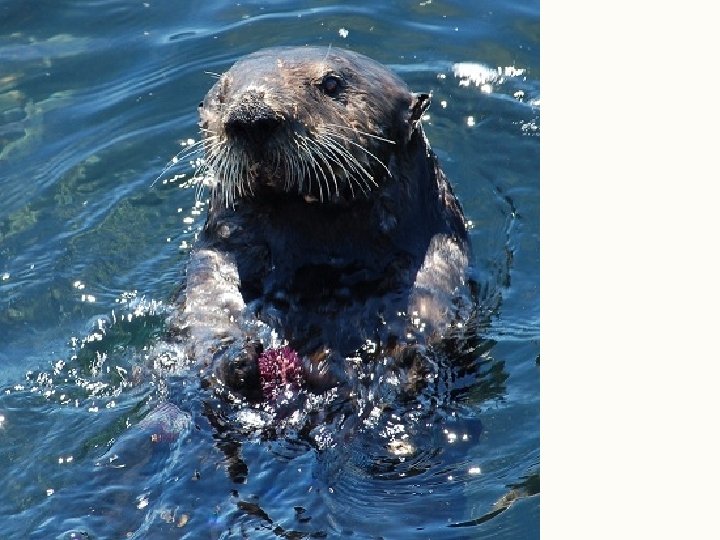
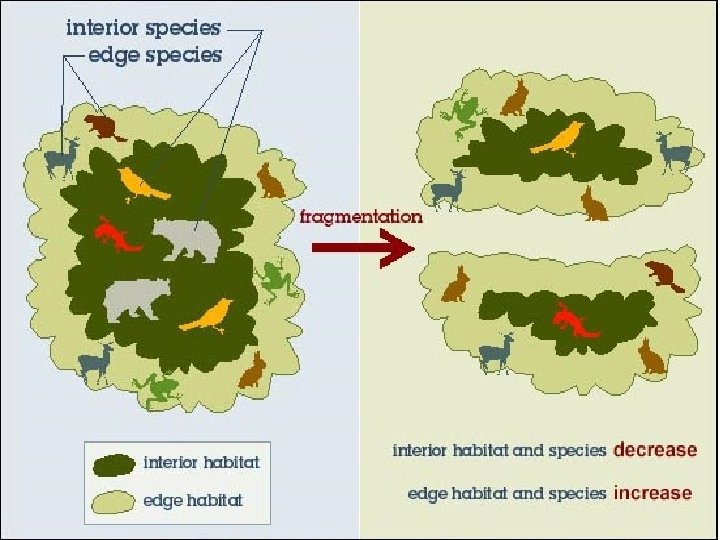
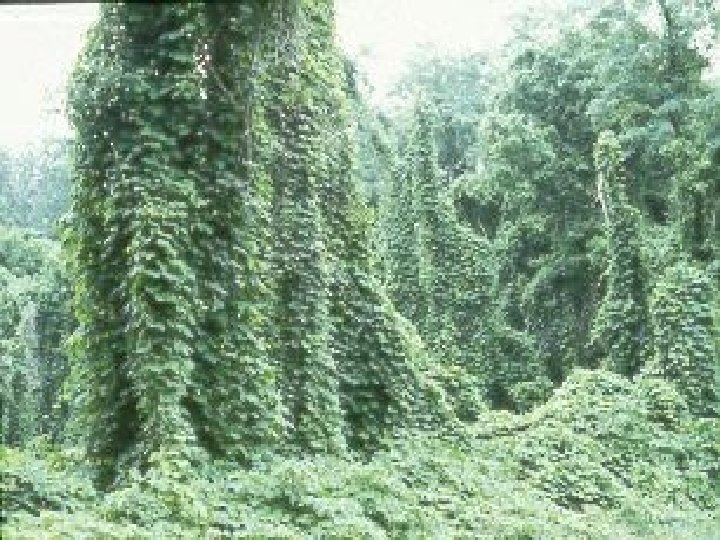
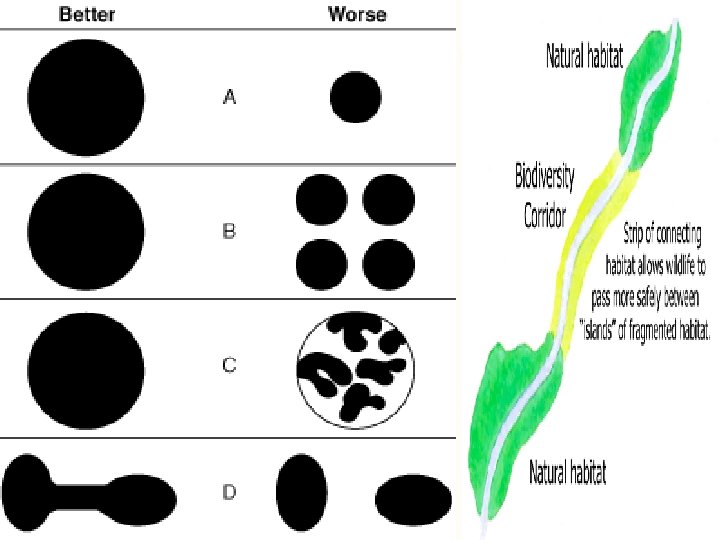
Factors that Threaten Biodiversity – Overexploitation – excessive use – Habitat loss – Destruction of habitats – Disruption of habitats – Keystone species – important species for the ecosystem – Fragmentation of habitat – Edge effects
Factors that Threaten Biodiversity – Pollution – Biological magnification – increasing concentration of toxicity as you go up the food chain – Acid precipitation – eutrophication – Introduced Species
Conserving Biodiversity – Maintain Natural Resources – Renewable resources – replaced faster than consumed (Ex. Solar energy) – Nonrenewal resources – used faster than replaced (Ex. Fossil fuels) – Sustainable use – using materials at a rate where they can be replaced or recycled
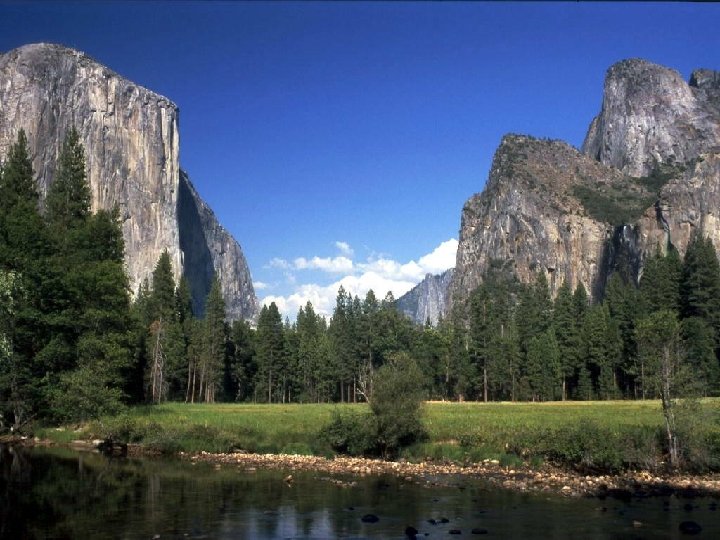
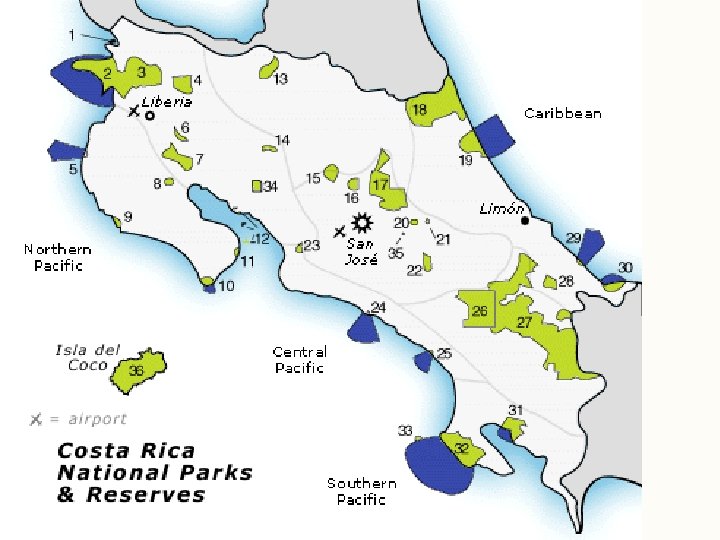
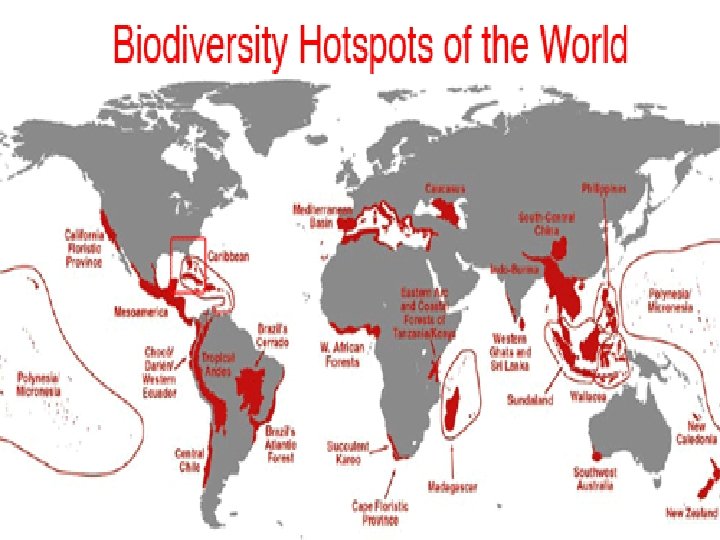
Conserving Biodiversity – Protected areas in US – National Park System – Protected areas Internationally – 7% of land areas are reserves – Biodiversity Hot Spots – Areas with endemic species which are not found anywhere else – Corridors between habitat fragments
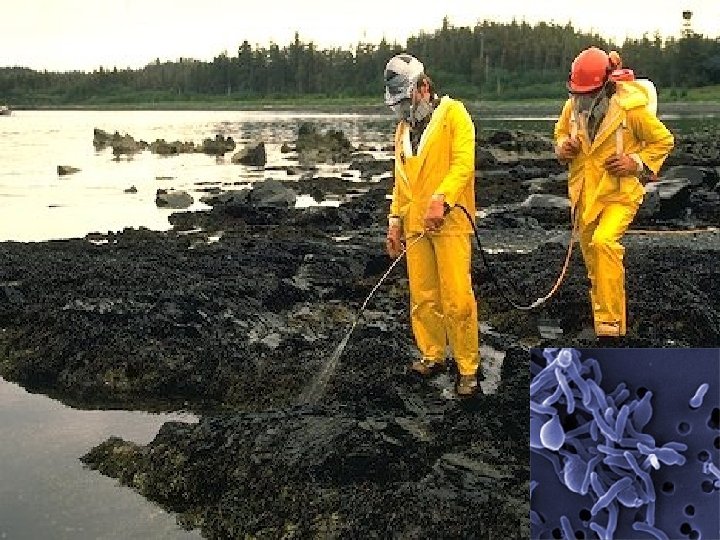
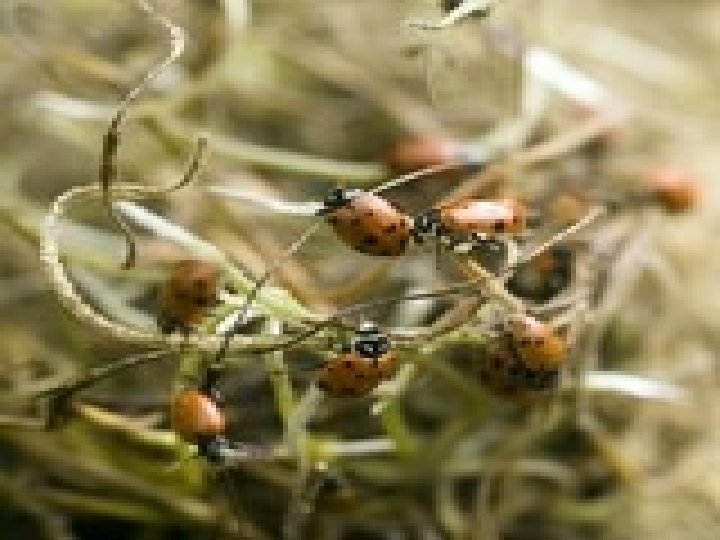
Conserving Biodiversity – Restoring Ecosystems – Bioremediation – use of living organisms to clean an area that is polluted – Biological Augmentation – adding natural predators to keep species in balance – Legally Protecting Biodiversity – Endangered Species Act
Human Carrying Capacity § Scientists are concerned about the human population reaching or exceeding the carrying capacity. § An important factor is the amount of resources from the biosphere that are used by each person.
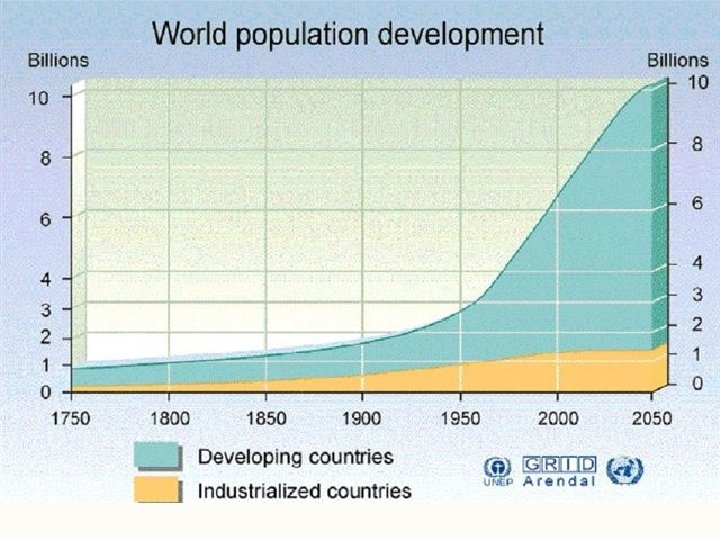
Human Population Growth – Population growth world-wide has grown exponentially. It is predicted that the population will continue to grow at a rapid rate. – As humans reach Earth’s carrying capacity population growth will slow due to an increase in the death rate and a decrease in the birth rate as a result of: – ○ Food and water shortages – ○ Pollution of the environment
Humans are the only species that can change its carrying capacity through the use of technology. – Technology is the application scientific knowledge in order to find solutions to problems or develop products to help meet the needs of humans. – Technology has also contributed to the pollution of the air, water, and land.