Ecology The study of the interactions among organisms


 100 I 10 II 1 III 0. 1 0")


 120 Lynx 80 6 40 3 0 0 1850 1875")


 60– 64 n")


 both species benefit from the relationship. n.")


- Slides: 94
Ecology The study of the interactions among organisms and their environment!
Interactions
Abiotic and Biotic Factors Levels of interactions depend on: n Biotic factors - the biological influences on organisms within an ecosystem n n n Ex - all the living things with which an organism might interact. Abiotic Factors – the physical, or nonliving, factors that shape ecosystems n Ex – temperature, precipitation, soil type, sunlight, weather
Interactions & Interdependence Biosphere Biome Ecosystem Community Population Individual
Levels of Interactions • • Species - group of organisms so similar to one another that they can breed and produce fertile offspring. Populations - groups of individuals that belong to the same species and live in the same area. Communities - groups of different populations that live together in a defined area. Ecosystem - collection of all the organisms that live in a particular place, together with their nonliving, or physical, environment.
Levels of Interactions • • Biome - group of ecosystems that have the same climate and similar dominant communities. Biosphere - contains all the portions of the planet where all life exists, including: üLand üWater üAir, or atmosphere
Biomes
Biomes There aquatic and terrestrial biomes! n Aquatic biomes - determined primarily by the depth, flow, temperature, and chemistry of the overlying water. n Terrestrial Biomes - characterized by certain soil and climate conditions and assemblages of plants and animals. n
Biomes n The climate of a region is an important factor in determining which organisms can survive there. n Within a biome, temperature and precipitation can vary over small distances.
Biomes n The world's major terrestrial biomes include: n n n n n Tropical rain forest Savanna Desert Chaparral Temperate grassland Temperate broadleaf forest Coniferous forest Taiga Tundra
60°N 30°N 0° Equator 30°S 60°S
Major Biomes Biome Tropical Rain Forest Tropical Savanna Desert Temperate Grassland Chaparral Temperate Broadleaf Forest Northwestern Coniferous Forest Boreal Forest (Taiga) Tundra Precipitation high Temperature Soil hot poor Diversity Trees high dense Grasses sparse variable low moderate mild variable summer hot clay poor rich moderate sparse moderate absent dense sparse dense summer low, winter moderate summer hot poor low medium summer moderate, winter cold summer mild, winter cool summer mild, winter cold rich high dense sparse rocky, low dense acidic poor, acidic moderate dense sparse Poor, low Permafrost medium high moderate low absent sparse
Biomes
Population Ecology Looks at the changes in a population
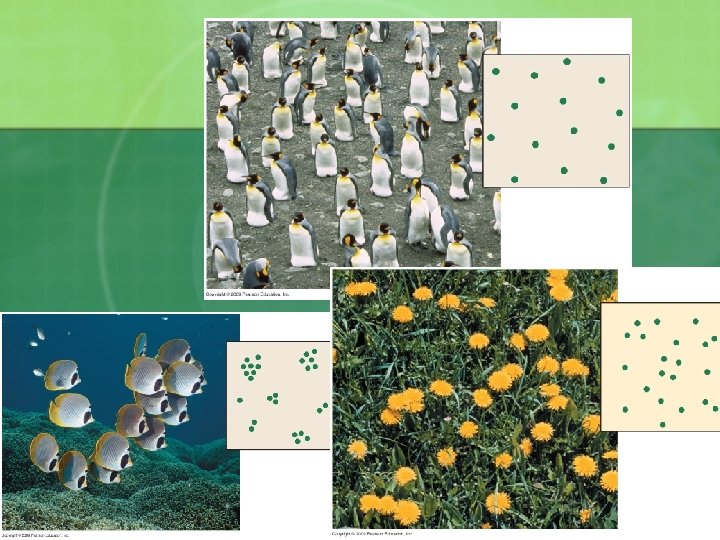
Population Density and Dispersion Density - Is the number of individuals of a species per unit area or volume n Dispersion – the way the individual’s are spaced out n Clumped – grouped together; usually due to food availability n Random – spaced in an unpredictable way; flowers from where seeds land n Uniform – an even distribution; usually seen with territorial animals n
Life Tables Life tables - track survivorship over the life span of individuals in a population n Can use this information to make survivorship curves n
Survivorship Curves Plot the proportion of individuals alive at each age Type I – produce few offspring, provide good care (humans, large mammals) Type II – intermediate, survivorship is constant over the life span. No more vulnerable at any stage. (invertebrates and rodents) Type III – low survivorship for the very young followed by a period of high survivorship for those who live to a certain age. Large number of offspring with little care. (fish)
Percentage of survivors (log scale) 100 I 10 II 1 III 0. 1 0 50 Percentage of maximum life span 100
Characteristics of a Population n Three important characteristics of a population are its: n geographic distribution n density n growth rate
Growth Rate Three factors can affect population size: n the number of births n the number of deaths n Immigration and emigration numbers n A population can grow when its birthrate is greater than its death rate. n
Exponential Growth Under ideal conditions with unlimited resources n Occurs when the individuals in a population reproduce at a constant rate. n The population becomes larger and larger until it approaches an infinitely large size. n
Exponential Growth – J curve Exponential Growth
Logistic Growth In nature, exponential growth does not continue in a population for very long. n As resources become less available, the growth of a population slows or stops. n Logistic growth - when a population's growth slows or stops following a period of exponential growth. n
Logistic Growth – S shape
Logistic Growth Carrying Capacity – limits populations n Carrying capacity – is the largest number of individuals of a population that a given environment can support n When a population reaches the carrying capacity of its environment, its growth levels off. The average growth rate is zero. n Limiting factors – factors that causes the population growth to decrease n
Limiting Factors • Density – Dependent Limiting Factors - depends on population size • Examples ücompetition üpredation üparasitism üDisease • These factors occur more when a population is large and dense. • Small, scattered populations are not affected as much.
Limiting Factors n Density Independent Limiting Factors – do not depend on the population size; affect all populations in the same way Examples ü unusual weather ü natural disasters ü seasonal cycles ü certain human activities—such as damming rivers and clear-cutting forests q Usually there is a rapid decline of the population n
Boom and bust cycles Some populations fluctuate in density with regularity n Booms- have rapid exponential growth n Busts – population falls to a minimum level n Caused by n Food shortages n Predator-prey interactions n
Hare population size (thousands) 120 Lynx 80 6 40 3 0 0 1850 1875 1900 Year 9 1925 Lynx population size (thousands) 160 Snowshoe hare
Populations Population Growth can be Logistic growth Exponential growth characterized by No limits on growth Unlimited resources represented by Constant growth rate J-shaped curve characterized by Limits on growth which cause a Falling growth rate represented by S-shaped curve
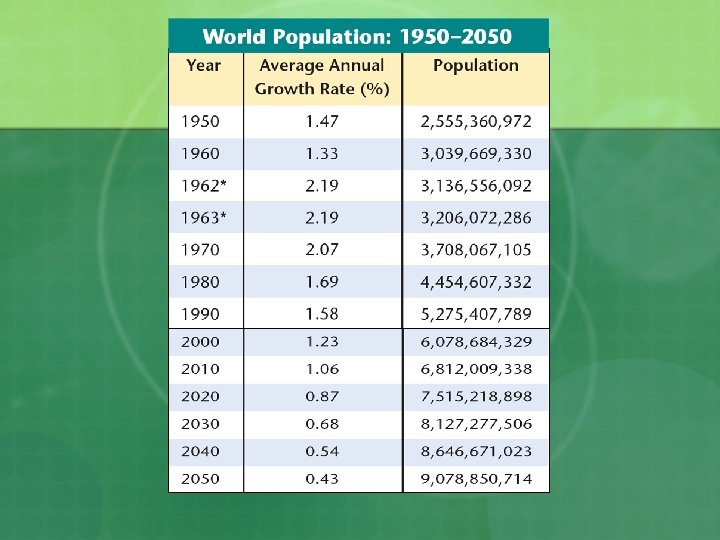
Human Population n Over the past century, population growth in the USA, Japan, and much of Europe has slowed dramatically. n This is called a demographic transition, a dramatic change in birth and death rates.
Human Population n The size of the human population tends to increase with time. For most of human existence, the population grew slowly due to limiting factors. n About 500 years ago, the human population began growing more rapidly. n Life was made easier and safer by advances in agriculture and industry. n Death rates were dramatically reduced due to improved sanitation, medicine, and healthcare, while birthrates remained high. n
Human Population Our advances allowed for exponential growth. Human Population Growth
Human Population n The demographic transition has three stages. In stage 1, there are high death rates and high birthrates. n In stage 2, the death rate drops, while the birthrate remains high. The population increases rapidly. n In stage 3, the birthrate decreases, causing population growth to slow. n
Human Population n The demographic transition is complete when the birthrate falls to meet the death rate, and population growth stops.
Human Population U. S. Population 80+ Males Females n Age (years) 60– 64 n 40– 44 20– 24 0– 4 Percentage of Population Demographers can predict future growth using models called age-structure diagrams. Age-structure diagrams show the population of a country broken down by gender and age group.
Human Population In Rwanda, there are many more young children than teenagers, and many more teenagers than adults. n This age structure diagram predicts a population that will double in about 30 years. Rwandan Population n Age (years) 80+ Males Females 60– 64 40– 44 20– 24 0– 4 Percentage of Population
Human Population Ecologists suggest that if growth does not slow down, there could be serious damage to the environment and global economy. n Economists assert that science, technology, and changes in society may control the negative impact of population growth. n
Community Ecology
Habitat vs Niche n The area where an organism lives is called its habitat. A habitat includes both biotic and abiotic factors.
Habitat vs Niche n Niche - the full range of physical and biological conditions in which an organism lives and the way in which the organism uses those conditions. n. The range of temperatures that an organism needs to survive n. Its place in the food web n. Its interactions with other organisms
Community Interactions n Competition occurs when organisms of the same or different species attempt to use an ecological resource in the same place at the same time. n n Resource - any necessity of life, such as water, nutrients, light, food, or space. Competitive exclusion principle - states that no two species can occupy the same niche in the same habitat at the same time.
Community Interactions n The distribution of these warblers avoids direct competition, because each species feeds in a different part of the tree.
Types Community Interactions n. Predation - An interaction in which one organism captures and feeds on another organism
Types of Community Interactions n. Symbiosis - Any relationship in which two species live closely together n. Symbiotic relationships include: n mutualism n commensalism n parasitism
Community Interactions n Mutualism: (+ / +) both species benefit from the relationship. n. N - fixing bacteria: The bacteria make nitrogen compounds to be used by the plants. The plants give the bacteria moisture and nutrients. n Commensalism: one member of association benefits and the other is neither helped nor harmed. (+ / o ) n Sharks: the remora attaches to the shark and gets uneaten bits of food. The shark gets nothing but is unharmed. n Parasitism: one organism lives on or inside another organism and harms it. (+ / -) n Athlete’s foot: the parasites feed on the host.
Disturbances and Succession • • Disturbances can occur that alter the community Ecological succession - series of changes in a community that occur over time after a disturbance – There are 2 types of succession – primary and secondary
Succession n Primary succession n Occurs on surfaces where no soil exists. (After a volcanic eruption). The first species to populate the area are called pioneer species. Usually what happens: 1. A volcano destroys the land. 2. Lichens appear. 3. Mosses and grasses appear. 4. Tree seedlings and shrubs move in.
Succession
Succession n Secondary Succession n n Biggest difference is that there is already soil present. Components of an ecosystem can be changed by natural events, such as fires.
Ecosystem Ecology Energy Flows
Energy Flow Where does the energy for life processes come from? • • • SUNLIGHT Without a constant input of energy, living systems cannot function.
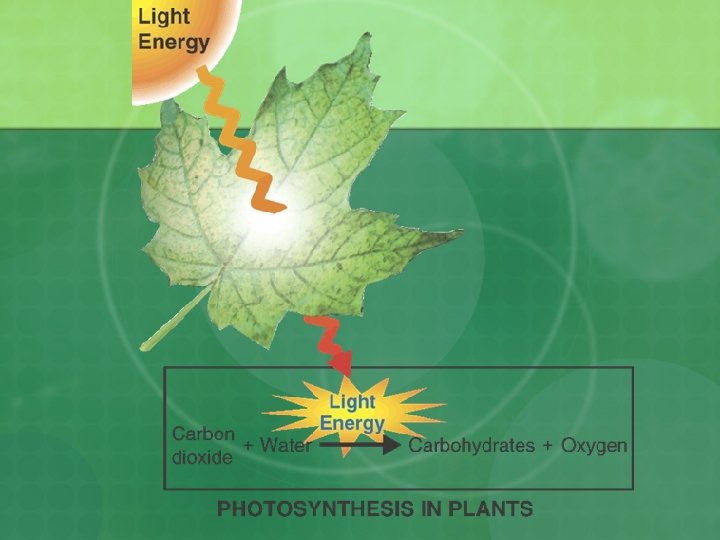
Energy Flow • Autotrophs use energy from sunlight to turn simple inorganic compounds into complex organic molecules. • • • Examples - plants, some algae, and certain bacteria Also known as producers Most autotrophs harness solar energy through photosynthesis.
Energy Flow • Heterotrophs – rely on other organisms for their energy and food supply • Cannot harness energy directly from the physical environment. o Also called consumers.
Energy Flow • Types of heterotrophs. ü Herbivores eat plants. ü Carnivores eat animals. ü Omnivores eat both plants and animals. ü Detritivores feed on plant and animal remains and other dead matter. ü Decomposers (bacteria and fungi) break down organic matter.
Feeding Relationships • • The relationships between producers and consumers connect organisms into feeding networks based on who eats whom. Energy flows through an ecosystem in one direction, from the sun or inorganic compounds to autotrophs (producers) and then to various heterotrophs (consumers).
Feeding Relationships • Food Chains - series of steps in which organisms transfer energy by eating and being eaten. Zooplankton Algae Small Fish Squid Shark
Feeding Relationships • Food Webs feeding relationship in an ecosystem that forms a network of complex interactions. • Links all the food chains in an ecosystem together.
Dominant and Keystone Species Dominant Species – is the species that is most abundant in the food chain/web n Keystone Species n These organisms are usually not the most abundant but they play a huge role in the food chain n Usually if this organism is removed from the food chain, the food chain can collapse n
Trophic Structures • Each step in a food chain or food web is called a trophic level. • • • Producers make up the first trophic level. Consumers make up the second, third, or higher trophic levels. Each consumer depends on the trophic level below it for energy.
Trophic Structures • Ecological pyramid - a diagram that shows the relative amounts of energy or matter contained within each trophic level. • There are three kinds: üEnergy pyramids üBiomass pyramids üPyramids of numbers
Energy Pyramid • Shows the relative amount of energy available at each trophic level. • Only part of the energy that is stored in one trophic level is passed on to the next level. 0. 1% Third-level consumers 1% Second-level consumers 10% First-level consumers 100% Producers
Energy Pyramid • • The more levels that exist between a producer and a top-level consumer in an ecosystem, the less energy that remains from the original amount. Only about 10 % of the energy available within one trophic level is transferred to organisms at the next trophic level.
Biomass Pyramid • • Biomass - total amount of living tissue within a given trophic level A biomass pyramid represents the amount of potential food available for each trophic level in an ecosystem. 50 grams of human tissue 500 grams of chicken 5000 grams of grass
Pyramid of Numbers • Shows the relative number of individual organisms at each trophic level.
Ecological Pyramids Energy Pyramid Shows the relative amount of energy available at each trophic level. Organisms use about 10 percent of this energy for life processes. The rest is lost as heat. Biomass Pyramid Represents the amount of living organic matter at each trophic level. Typically, the greatest biomass is at the base of the pyramid. Pyramid of Numbers Shows the relative number of individual organisms at each trophic level.
Ecosystem Ecology Matter Cycles
Matter Cycles • • • Forms of matter are passed from one organism to another & from one part of the biosphere to another through biogeochemical cycles. Matter can cycle because biological systems do not use up matter, they transform it. Matter is assembled into living tissue or passed out of the body as waste products.
Water Cycle
Carbon Cycle n n n Carbon is the key ingredient of living tissue. Biological processes - photosynthesis, respiration, and decomposition Geochemical processes - erosion and volcanic activity Biogeochemical processes - burial and decomposition of dead organisms and their conversion under pressure into coal and petroleum (fossil fuels) Human activities - mining, cutting and burning forests, and burning fossil fuels
CO 2 in Atmosphere Photosynthesis Volcanic activity feeding Respiration Erosion Human activity Decomposition Respiration CO 2 in Ocean Uplift Deposition Photosynthesis Fossil fuel feeding Deposition Carbonate Rocks
Nitrogen Cycle n n n All organisms require nitrogen to make proteins. Some bacteria live in the soil and on the roots of plants called legumes. They convert nitrogen gas into ammonia in a process known as nitrogen fixation. Other bacteria in the soil convert ammonia into nitrates and nitrites. Producers can use the nitrogen when converted Consumers eat producers Decomposers return nitrogen to the soil
Nitrogen Cycle N 2 in Atmosphere Synthetic fertilizer manufacturer Atmospheric nitrogen fixation Decomposition Reuse by consumers Uptake by producers Bacterial nitrogen fixation Decomposition excretion NH 3 NO 3 and NO 2 Decomposition excretion Reuse by consumers
Phosphorus Cycle Phosphorus is essential to organisms because it helps form DNA and RNA. n Some phosphate is released into the soil and water as sediments wear down. n Some phosphate stays on land cycles between organisms and the soil. n
Phosphorus Cycle The Phosphorus Cycle Organisms Land Ocean Sediments
Conservation Ecology Humans and the Environment
Biodiversity n n Biodiversity - the sum total of the variety of all organisms in the biosphere. Ecosystem diversity includes the variety of habitats, communities, and ecological processes in the living world. Species diversity is the number of different species in the biosphere. Genetic diversity is the sum total of all the different forms of genetic information carried by all organisms living on Earth today.
Biodiversity Insects 54. 4% Protists 4. 2% Other Animals 19. 7% Plants 18% Fungi Bacteria 0. 3% 3. 4% Species Biodiversity
Biodiversity is one of Earth's greatest natural resources. n We are losing biodiversity! n Why is this important? n Species of many kinds have provided us with foods, industrial products, and medicines— including painkillers, antibiotics, heart drugs, antidepressants, and anticancer drugs. n
Threats to Biodiversity n Human activity can reduce biodiversity by: Altering habitats - deforestation n Pollution – fossil fuels (cause acid rain) n Hunting species to extinction n Introducing toxic compounds into food webs – biological magnification n Global climate change n Introducing foreign species to new environments – invasive species n
Biological Magnification Occurs when toxic compounds accumulate in the tissues of organisms. n When DDT enters food webs, it undergoes biological magnification. n In biological magnification, concentrations of a harmful substance increase in organisms at higher trophic levels in a food chain or food web. n
Biodiversity Magnification of DDT Concentration Fish-Eating Birds 10, 000 Large Fish Small Fish 1, 000 100, 000 Zooplankton 10, 000 Producers Water 1000 1
Global Climate Change n n Many ecologists are concerned about strong evidence that climate is changing. Since the late 19 th century, average temperatures have risen about 0. 6° Celsius. Since 1980, average temperatures have risen between 0. 2 and 0. 3 Celsius degrees. The term used to describe the increase in the average temperature of the biosphere is global warming.
Global Climate Change n One sign of global warming is melting polar ice.
1938 1981 2005
Global Climate Change n n The geological record shows that Earth’s climate has changed repeatedly during its history. Researchers must determine whether the current warming trend is part of a larger, natural cycle of climate change, or whether it is caused by human activity. A widely accepted hypothesis is that current warming is related to human activities that add CO 2 and other greenhouse gases to the atmosphere. The burning of fossil fuels adds carbon dioxide to the atmosphere faster than the carbon cycle removes it.
Our Future Possible Effects of Global Warming n n n Most recent computer models suggest that average global surface temperatures will increase by 1 to 2° Celsius by the year 2050. Sea levels may rise enough to flood coastal areas, affecting coastal ecosystems as well as human communities. Parts of North America may experience more droughts during the summer growing season.
Invasive / Introduced Species n n n Are plants and animals that humans transport around the world (accidentally or intentionally). Invasive species are introduced species that reproduce rapidly because their new habitat has no predators to control their population. Hundreds of invasive species—including zebra mussels in the Great Lakes—are already causing ecological problems in the United States.
Our Future
Conserving Biodiversity n n Conservation is the wise management of natural resources, including the preservation of habitats and wildlife. Protecting an ecosystem will ensure that the natural habitats and the interactions of many different species are preserved at the same time. Protecting resources for the future can require people to change the way they earn their living today. Conservation regulations must be informed by solid research and must try to maximize benefits while minimizing economic costs.
Overall Goal n Humans should strive for - Sustainable development n This is a way of using natural resources for human needs without depleting them n There are laws in place to help with this.