0 TRANSPORT ECONOMICS MPETREN Transport economics Transport Economics
")


")


")
")


")
")
")
")


 • • • Many buyers and sellers No barriers to entry")


 – it is unneccessary for the market to be in")


 seperately, charging the highest")


")


 Fogel (1964) – Railroads and economic growth Purvis (1985) – highway")


 • CBA estimates and totals up the equivalent money value")


 • Alternative approaches to generating a forecats of demand for existing,")
 • Methods for identifying and projecting seasonal change • Methods forecasting")


 will be determined")

- Slides: 167
0. TRANSPORT ECONOMICS (MPE_TREN)
Transport economics • Transport Economics explores the efficient use of society’s scarce resources for the movement of people and goods. • Its numerous case studies illustrate the economic principles, discuss testable hypothesis, analyze econometric results, and examine each study’s implications for public policy.
Course 1. 2. 3. 4. 5. 6. 7. 8. Transport markets Demand elasticity Transport demand issues Efficiency Transport costs Imperfect competition Pricing Regulation 9. Ownership 10. Subsidy 11. Transport and development 12. Transport appraisal 13. Demand forecasting
Empirical Project • The major task will be to write an empirical project in transport economics.
Course Evaluation • 50% - seminar’s activity • 50% - defense of empirical project
Contact • Zdeněk Tomeš • tomes@econ. muni. cz
1. TRANSPORT MARKETS
Market analysis • Market demand supply • State regulation and intervention • Ceteris paribus clause
The law of demand Law of demand states that, all else being constant, as the price of a product increases (↑), quantity demanded falls (↓)
Demand curves Figure 3. 1
Demand determinants • • • Income ↑ Price of substitutes ↑ Price of complements ↓ Fashion Expectations
Case 1: Impact of income on demand
Theory of supply The law of supply is a fundamental principle of economic theory which states that, all else equal, an increase in price results in an increase in quantity supplied
Supply determinants • • • The cost of production Government policy The price of goods in joint supply Natural shocks Aims of producer
Case 2: British bus industry
Market workings • Putting together demand supply
2. TRANSPORT DEMAND ELASTICITY
Elasticity of demand is the responsiveness of demand to a change in one of its determinants
Price elasticity of demand = Percentage Change in Quantity Demanded/Percentage Change in Price
Determinants of PE • The number and closeness of alternative modes of travel (subsitutes) • Proportion of disposable income spent on the mode of travel • Time dimension
Price elasticity of demand estimates of passenger transport
Price elasticities
Cross price elasticity = Percentage change in quantity demanded of service A/Percentage change in price of service B
Cross price elasticities intercity passenger transport demand in Canada, mid range values, Oum and Gillen (1983)
Estimates of cross-elasticities of transport demand
Income elasticity = Percentage change in quantity demanded/Percentage change in income
South East Britain income rail elasticities (2002)
Historical income and price elasticities Zdroj: Fouquet (2011)
3. TRANSPORT DEMAND ISSUES
The Notion of Need • There are some advocates of the idea that transport services, or at least some of them, should be allocated according to need rather than effective demand. • The idea is that just as everyone in a civilized society is entitled to expect a certain standard of education, medical care, security and so on, so they are also entitled to enjoy a certain minimum standard of transport provision.
The problem of rural demand • The provision of public transport services to satisfy demand in rural areas has always been problematic. • Such services have high costs, but low revenues due to low load factors. They are uneconomic. • However, the demand for these services is very real, as rural populations require them to get to work, to do their shopping, to access schools and medical care and for social reasons.
The problem of rural demand This problem has worsened in recent times for four main reasons: 1. 2. 3. 4. Greater car usage Growth of urban conurbations Public services concentrated in urban centres Population ageing
Problem of peak • In economics it is usually assumed that demand is constant per unit of time • In transport economics this assumption cannot be made as there are peaks in demand tht occur on a regular basis
Distribution of traffic by time of the day, UK, 2004: Cars
Distribution of traffic by time of the day, UK, 2004: Goods vehicles
Valuation of time • The importance of travel time in transport economics should now be apparent. • Transport time savings re normally considered to be a major component of any scheme designed to improve transport efficiency.
Value of time • A value of time can be inferred from logit model by looking at changes in the dependent variable that result from change in either time or costs difference.
Value of time • There differences between values of working times and non-working times. • Also there are differences in the values of walking/waiting times and in-vehile times. • This has important consequences for design fo public transport.
Demand for car • While demand for cars is not a strictly transport matter, the importance of the automobile in travel behaviour, land use patterns and the enviroment makes it a matter of considerable interest to transport economist.
Demand for car Two approaches to modelling demand for car ownership: • Hedonic approach • Product life cycle
4. EFFICIENCY
Scarcity, choice and opportunity cost • Any resource is scarce • If individuals cannot have all that they want, then choices need to be made • Opportunity cost is the next best alternative forgone These three principles can be illustrated on production possibility frontier.
A Production Function as a Frontier
Efficiency • The inputs/outputs ratio is the main base for assessing whether a given operation can be described as efficient or not.
Technical, cost and allocative Technical efficiency = minimum level of inputs to produce maximum level of outputs Cost efficiency = most cost efficient input minimization Allocative efficiency = cost effcieincy + right quantities
Technical and allocative efficiency
Service efficiency and effectiveness
DEA + Tobit • DEA = non parametric method for the estimation of production functions. It is used to empirically measure productive efficiency. • Tobit regression = to identify the determinants of DEA efficiency scores
Efficiency in railways – Driessen (2006)
Efficiency in railways – Driessen (2006)
Efficiency in railways – Driessen (2006)
Efficiency in railways – Driessen (2006)
5. TRANSPORT COSTS
Introduction • A major factor affecting supply is the cost of production • Monetary costs + Time costs = Generalised costs of transport • How to maintain downward pressure on public transport costs?
Short run and long run • Short run = at least one factor of production is fixed • Long run = variations in output can be achieved through variation of all of the inputs
SR production, total, average and marginal product
Case: Mode cost comparison
The short run average cost curve
The importance of average cost in the business model of low-cost airlines
The long run production function
The long run average cost curve
6. IMPERFECT COMPETITION
Perfect competition (assumption) • • • Many buyers and sellers No barriers to entry or exit All firms are profit maximisers All consumers are utility maximizers Perfect information Homogenous product No economies of scale Non rivarly in consumption Absense of externalities No governemnt intervention
Barriers to entry • • Firm size High sunk costs Product differentiation Legal protection Control of factors of production Exclusive dealership Branding
Disadvantages of monopoly • Production inefficiencies • Higher prices charged and lower output produced • Reduction of consumer surplus and is regressive • Net welfare loss • X-efficiency • The market no longer regulates itself
Advantages of monopoly • • A higher level of expenditure on R a D Market size – a natural monopoly Wasteful competition Hotellings law
Contestable markets Baumol (1982) – it is unneccessary for the market to be in perfect competition in order to produce economically efficient results. It is enough to be a contestable market. Contestable market = entry to the market is free and exit is costless
Case: Contestability in airlines The sector is becoming more contestable because: • Control over landing slots is lower • The spread of information through Internet • The frequent flyer initiative is on retreat • The growth of LCA
Oligopoly • • • Few sellers, many buyers Barriers to entry are significant Non price competition Product differentiation Tacit collusion
Downie competitive process
British bus industry - demand
British bus industry - supply
British bus industry – key changes
7. PRICING
Introduction • Pricing is a vital component in the economics of transport • The price determine who gets and who doesn’t get a particular service, but also determines the distribution of rewards between the provider and the user • The imperfect market structures are characterized by higher rewards for the providers
The principles of pricing • In most cases, transport services are subsidised and/or regulated, however a basic understanding of pricing principles is needed • In order to achieve economic efficiency, the price should equal the marginal cost • In imperfect competition markets, it is possible to observe price discrimination, predatory pricing, price fixing and congestion pricing
Price discrimination • Price discrimination refers to a situation where a company charges particular consumers a higher price than others for the same product for reasons unrelated to cost. • The seller must possess a degree of market power, must be able to divide the market and market segments must have differing elasticities of demand.
Perfect price discrimination • To sell each unit (or ticket) seperately, charging the highest price that each consumer is prepared to pay • If this was achievable, the seller would obtain the entire consumer surplus from the consumer • The seller must know the exact shape of each consumer’s demand charge each consumer the maximum price they are prepared to pay
Case: Sale of airline tickets • On a typical airline flight there are three classes, namely First, Business and Economy. • Figure on the next slide refers to travel in a particular class and the assumption is made that the marginal cost of one extra passenger is constant up to the point where the aircraft reaches full capacity • At this point the MC curve becomes perfectly inelastic
Airline price discrimination
Yield management in the aviation
Loss making operator and perfect price discrimination
Predatory pricing • Predatory pricing occurs when a firm with maket power reduces its price below cost in the short run so as to obtain abnormal profit in the long run. • Predatory pricing is aimed at either achieving or maintaining a monopoly situation, with the price set so as to bankrupt competitors, „encourage“ them to merge or in fact collude.
Predatory pricing • The consumer may benefit in the short run from lower prices, due lower competition such activity may not be in the public interest in the long run. • In practise it can be very difficult to prove that such activity has taken place • Predatory pricing is an appealing strategy in a segmented market
Price fixing • Firms in oligopolistic markets such as the airline sector often face a dilemma as to whether to compete with each other or to collude • Price fixing is a situation when oligopoly firms agree on the price they are going to sell their goods or services in order to remov price competitiveness and thus increase their profits
8. REGULATION
Introduction • This presentation is concerned with control and specifically the control by relevant authorities on the levels and behavour of trasnport users and operators under their control • It concerns all areas of transport, whether that be public, private or freight
Government control of transport markets can be achieved through one of two measures: • Regulation - control through direct command; i. e. telling operators what to do • Ownership – the transport authority can own the assets and the means of production. The market is brought into public sector and thus it does not have to operate along market principles
Forms of regulation • Specify the price to be charged • Specify the maximum increase in price allowed • Regulate the (final) price through the tax charged on the good or service • Specify the rate of return (profit) to be gained • Through introducing yardstick competition • Specify a minimum frequency • Limit market entry
The rationale for the regulation • To overcome the markt failure or imperfect/assymetric information • The market can no longer regulate itself • To correct for externalities • To ensure the quality of the service provided • To provide a transport service where none exsited before • To improve efficiency within the industry
The drawbacks of economic regulation • • • Limits free enterprise Inefficient, second best solution Assymetry of information The issue of regulatory capture Cumbersome regulatory procedures make avoidance of regulatory measures possible
Case: Regulaton of the British railway industry • 1945 - 1994 – British Rail. Vertically and horizontally integrated single nationalized operator in the UK. • 1994 - 1997 – British railway reform. British Rail divided into 104 separate companies with the main purpose to introduce competition at all levels of railway operation (train operating companies, rolling stock leasing companies, infrastructure maintenance amd renewal companies). • The majority of these companies were privatized
British infrastructure provider • The one exception was the infrastructure provider, where it was considered that the advantages of having a single national network operator significantly outweighed the drawbacks of splitting the network up into separate geographical areas. • This therefore left a monopoly provider of the infrastructure throughout the country • This was organized into a company called Railtrack which was floated on the stock exchange • All infrastructure access charges were to be at full cost • As a result, the firm would return a profit and receive no direct subsidy except to assist the funding of railway investment • The strong regulation was introduced to prevent the abuse of monopoly power
British rail industry regulatory structure 1997 - 2001
What went wrong? • Railtrack investment needs, costs overruns on the major infrastructure projects • Railtrack had effectively very little control over its own costs; loss of engineering expertise • Broken rail at Hatfield (October 2000), resulting in a train derailment and four fatalities. Railtrack panicked and overreacted imposing severe speed limits on the network leading to widespread delays and chaos (2000 – 2001). • Under the terms of track access agreements, Railtrack had to pay more than 500 m GBP to train operating companies as a result of the disruption caused. • This combined with major cost overruns led to bankruptcy of Railtrack in October 2001 and it was replaced by nonprofit organization Network Rail.
British rail infrastructure provider – results
9. OWNERSHIP
Reasons for public ownership • • Eradicate wasteful competition Military significance Public goods Essential to the economy A large employer Key industry High project development costs
Reasons for reform • Increasing discontent with the model of public ownership • Changing macroeconomic enviroment combined with social change • The desire to introduce competition into the provision of transport services
Ownership forms • • • Central government department Centralised provision The municipal department Delegate to third party PPP partnership Private enterprise
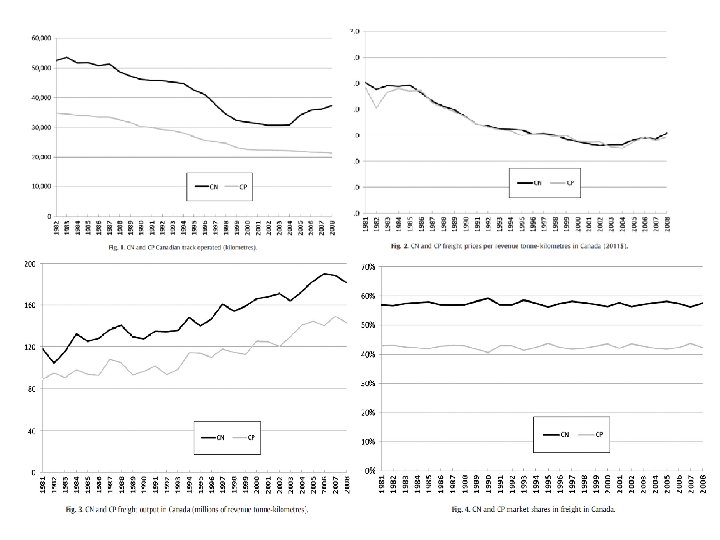
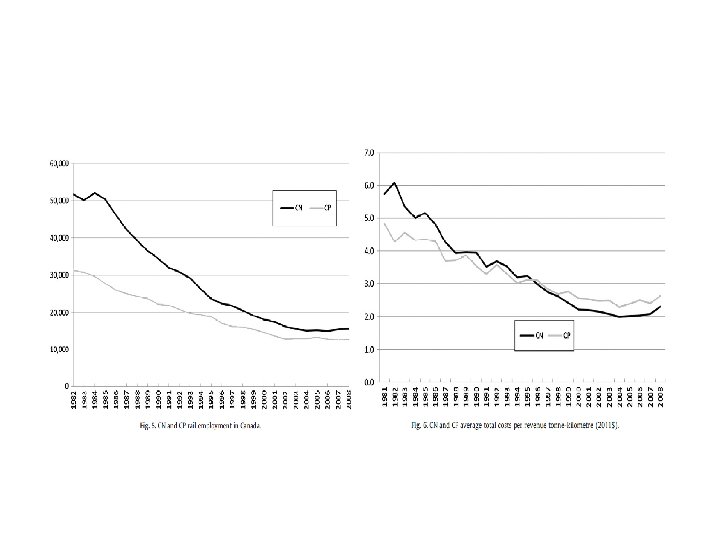
Efficiency of private and public railroad in Canada The efficiency of public and private firms is usually compared in industries which have heavy regulation and limited competition. In this paper we present a case study in which the effects of property rights can be isolated from the effects of regulation on noncompetitive markets. We compare the postwar (1956 – 1975) productivity performance of the Canadian National (public) and Canadian Pacific Railroads (private). Contrary to the predictions of the property rights literature, we find no evidence of inferior performance by the government-owned railroad. We conclude that any tendency toward inefficiency resulting from public ownership has been overcome by the benefits of competition. Caves, D. W. – Christensen, L. R. (1980): The Relative Efficiency of Public and Private Firms in a Competitive Enviroment: The Case of Canadian Railroads. Journal of Political Economy
Privatization of Canadian National This article describes and analyzes the privatization of Canadian National Railway (CN), a large railroad privatization (1995). It uses data from 1990 to 2011 to compare CN's post-privatization operating performance with its pre-privatization performance. The overall results demonstrate that CN performed substantially better following privatization, both from an operational perspective and from a broader social welfare perspective. We find statistically significant increases over the long term (16 years following privatization) in sales, capital investment, assets, profitability, productivity, dividends and corporate taxes paid. There was little change in the capital structure of CN and a significant decrease in employment. Using Canadian Pacific Railway as a basis for the counterfactual, we estimate that CN's privatization generated social welfare gains of approximately $25 billion in 2011 Canadian dollars. The Canadian government received almost half of these gains, while CN's shareholders (most of whom were non-Canadian) captured the rest. Boardman, A. E. , Laurin, C. , Moore, M. A. , & Vining, A. R. (2013). Efficiency, profitability and welfare gains from the Canadian National Railway privatization. Research in Transportation Business & Management, 6, 19 -30.
10. SUBSIDY
Introduction Subsidy plays a vital role in the operation of transport markets, because they are made up of a combination of market forces and the actions of transport planning authorities, with subsidy playing the pivotal role in reconciling these two forces in the actual market place
Subsidy or payment for public service? • The payment of subsidy is closely related to aspects of regulation • With the general move away from transport provision through traditional forms of public ownership towads far more private sector involment, many argue that there is no longer a subsidy but rather a payment for the performance of a contract for providing a service • The issue is further complicated by the fact, that paying transport subsidies has also a very strong political dimension
The rationale for subsidisation • In support of land use efficient modes of transport • To lessen the impact of enviromentally unfriendly modes of transport • To support economic development or regeneration of an area • To support socially necessary services
Subsidy to operators to correct for underconsumption (supply side measure)
Demand side measures • Far more straightforward • Used to correct for a demand side market failure • Specific groups and individuals are targeted to receive the subsidy • In effect the individual is given a concession (a reduced fare) to use a service
Drawbacks of paying subsidy • • It is always a second best solution Can lead to inefficient operation The winners curse syndrom Subsidise a service that doesnt actually need a subsidy
Cross-subsidization occurs where the profits of one route or service are used to pay for the losses on another route or service. It has often been used in the past to reduce the level of total subsidy Drawbacks: • Hides true costs of providing a particual service • Users of profitable routes are penalized • There are better instruments to ensure provision of services
Methods of paying subsidy • • Deficit subsidy Net cost contract Full cost contract Design, Built, Operate and Maintain (DBOM)
Economies of density and subsidy in railways
11. TRANSPORT AND DEVELOPMENT
Learning Outcomes • The link between economic development and transport • Causation: demand led and supply led effects • Impact of transport on economic growth • Transport role in the local economy • The link between transport and wider social development issues
Economic and transport growth Freight transport and real GDP, Great Britain
Economic and transport growth Passengerkilometers travelled and real GDP, Great Britain
Direction of causation? • The association between transport volumes and GDP has long been recognized, there remains real question over the direction of causation • Is it that as income rise, more goods are demanded and transported? • The alterantive hypothesis is that advances in freight transport will result in reduced transport costs an it will lead to more goods produced
Supply led view – transport leads to economic development To adopt a supply led model is to suggest that the casual relationship is that improving the transport infrastructure of an area will automatically stimulate economic activity. This would occur for a number of reasons: • Widening of markets, increased production and multiplier effects • Indirect effects on employment in construction and operation
Demand led models – economic development drives demand for transport • Contrasting with the supply led view is the alternative idea that transport provision is a invaraibly a response to a basic demand, hence the casual relationship is that economic development leads to a demand for better transport facilities • Without a basic demand for an area’s goods and services, then irrespective of the quality of the transport infrastructure this will never stimulae that demand
Synthesis • There is no clear answer to the direction of causation and the two are closely assosiated • Under a supply led view improving transport services and/or upgrading the infrastructure is a necessary and sufficient condition for imporved trasnport to lead to economic development • Under a demand led view, however, it is a necessary but not sufficient condition, i. e. the only condition required. There has to also be a basic derived demand for transport services in rder for transport developments to then facilitate economic development.
Empirical evidence (examples) Fogel (1964) – Railroads and economic growth Purvis (1985) – highway development and economic growth Aschauer (1989) – elasticity of aggregated output with respect to infrastructure spending Harmatuck (1997) – return on infrastructure investment will decline as maintanance expenditure goes up Rodriguez-Pose (2004) – impact of European transport investment on economic development (almost zero)
Decoupling transport from GDP • There is a very close association between freight and passenger traffic and GDP • This has now become a major problem, due to negative impact of transport on the enviroment • Decoupling = GDP can continue to grow without being associated with the growth of traffic • Is decoupling achievable?
Transport and local economy • The role of transport in the local economy → the extent to which the multiplier effect is allowed to function at the local level from any external injection • The better physical links within the local economy → the easier it is for the benefits to have a full impact • Physical separation of production and consumption
Location • Many theorists suggest that firms of similar nature will tend to be located near to each other for various reasons. • Examples: Silicon Valley, Moravian Manchester …. . • Improved transport links to create inustrial clusters? • The local economy, transport and housing market
12. TRANSPORT APPRAISAL
Learning Outcomes • Understand why we appraise • Understand main methods of appraisal • Have an appreciation of how these methods vary across Europe • Be able to critique some of the key asumption on whcih appraisal is based
Transport investment • Transport investment involves expenditure on particular project in situation of limited resources. • The task is to choose the project that brings maximum return
Appraisal • Appraisal is a way of predicitng how much utility we as society will derive from the expenditure on one project compared to another, by predicting the utility that will arise from each • It is fundamental to realise that, inherent in appraisal there is some kind of prediction or forecasting required
Cost benefit analysis (CBA) • CBA estimates and totals up the equivalent money value of the benefits and costs to establish whetjer they rae worthwhile. • The result of CBA is a number; this shows the ratio of benefits to costs. • The basis of CBA is that a monetary value needs to be allocated to all benefits and costs
How does CBA work? • • • Choose options Choose length of time Use a predictive model Calculate time savings Take away benefits from cost to find out whether benefits exceed costs and, if so, by how much
Key elements of CBA • • • Project appraisal period The benefits that are assessed Forecasting and modelling Present value Values of time Accident valuation Operating costs Revenue Discounting
Criticism and problems with CBA • Valuing time savings • Discount rate and length of time of project appraisal • What does NPV show us? • Equity and distributional effects • Project pricing – optimism and inaccuracy
Costs and benefits of high speed rail
CBA of HSR in Spain
CBA of HSR in Britain
CBA of proposed HSR in Britain
13. TRANSPORT FORECASTING
Learning Outcomes (1) • Alternative approaches to generating a forecats of demand for existing, new or improved services • Issues surrounding asking people how they or the public would react to new or improved transport services and the problems taht will occur • Methods for identifying and projecting demand for existing services when no major changes are expected
Learning Outcomes (2) • Methods for identifying and projecting seasonal change • Methods forecasting demand when significant change is expected in the economic and social envrioment • Methods forecasting the impact of new or improved services in a competitive enviroment
Aim • In order to assess if the provision of a new or improved transport service makes economic sense we need to have some idea of how public will respond, both immediately and in the far distant future • Forecasting is about collecting information from all relevant sources and analysing it in a consistent structured fashion.
General approaches There are three approaches to forecasting demand: 1. Qualitative: Surveys and Sampling 2. Time series analysis 3. Econometric techniques
Qualitative Methods • Qualitative Forecasting Methods are based on surveys of either potential customers or experts • The major problem is identyfying who to ask
Time series analysis In time series analysis we seek to identify the three elements: 1. The Trend 2. Seasonal or Cyclical Factors 3. The unusual (sometimes termed the stochastic factor or noise)
Econometric methods The modelling process involves 6 stages: 1. Understanding the Problem 2. Obtaining the Data 3. Specifying the Model 4. Estimating the specified Model 5. Validating the Model 6. Simulation/Forecasting
The gravity model The model that predicts the level of tranport between two locations to be dependent upon their respective population sizes and the distance between them
Econometric demand models The demand for particular mode (road, rail, air) will be determined by income, price, joureny times, frequency and comparative quality
Modelling choice • It is often the case that we are more concerned with forecasting the share of existing traffic than the growth of that traffic • Logit models