The Met Office Glo Sea 5 System Description





- Slides: 65
The Met Office Glo. Sea 5 System Description and Latest Results Jeff Knight and many other colleagues, Met Office Hadley Centre 13 th Session of the Forum on Regional Climate Monitoring, Assessment and Prediction for Asia (FOCRAII), 24 th April 2017 www. metoffice. gov. uk © Crown Copyright 2017, Met Office
The Met Office Global Seasonal Forecast System: Glo. Sea 5 www. metoffice. gov. uk © Crown Copyright 2016, Met Office
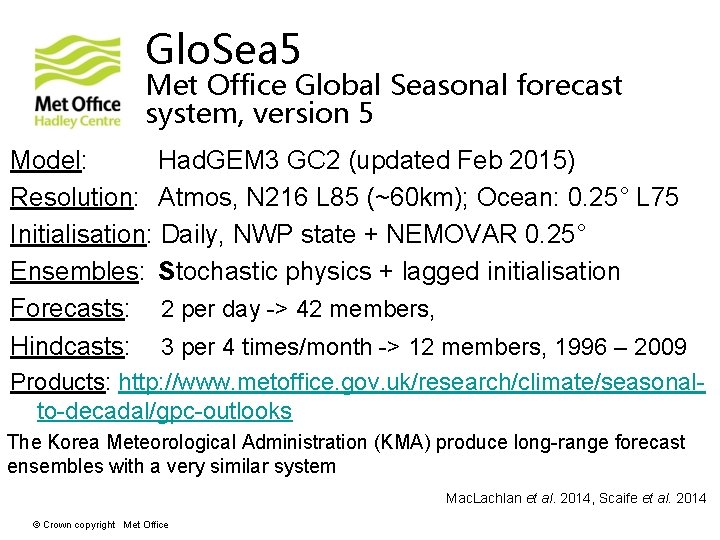
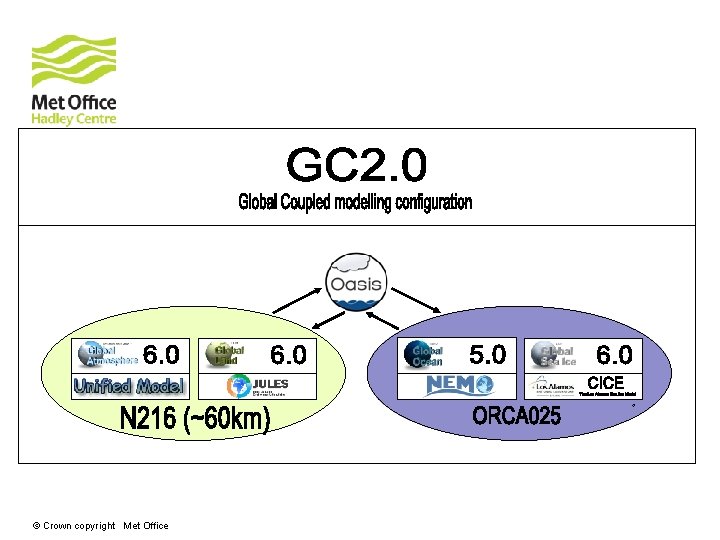
Glo. Sea 5 Met Office Global Seasonal forecast system, version 5 Model: Had. GEM 3 GC 2 (updated Feb 2015) Resolution: Atmos, N 216 L 85 (~60 km); Ocean: 0. 25° L 75 Initialisation: Daily, NWP state + NEMOVAR 0. 25° Ensembles: Stochastic physics + lagged initialisation Forecasts: 2 per day -> 42 members, Hindcasts: 3 per 4 times/month -> 12 members, 1996 – 2009 Products: http: //www. metoffice. gov. uk/research/climate/seasonalto-decadal/gpc-outlooks The Korea Meteorological Administration (KMA) produce long-range forecast ensembles with a very similar system Mac. Lachlan et al. 2014, Scaife et al. 2014 © Crown copyright Met Office
© Crown copyright Met Office
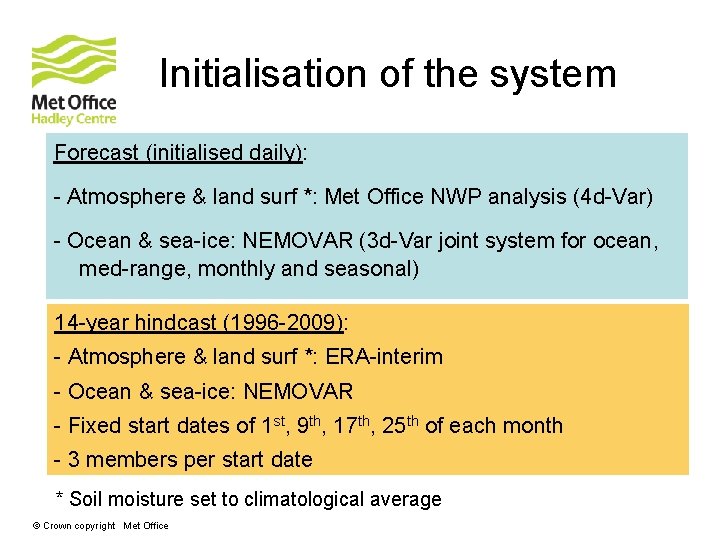
Initialisation of the system Forecast (initialised daily): - Atmosphere & land surf *: Met Office NWP analysis (4 d-Var) - Ocean & sea-ice: NEMOVAR (3 d-Var joint system for ocean, med-range, monthly and seasonal) 14 -year hindcast (1996 -2009): - Atmosphere & land surf *: ERA-interim - Ocean & sea-ice: NEMOVAR - Fixed start dates of 1 st, 9 th, 17 th, 25 th of each month - 3 members per start date * Soil moisture set to climatological average © Crown copyright Met Office
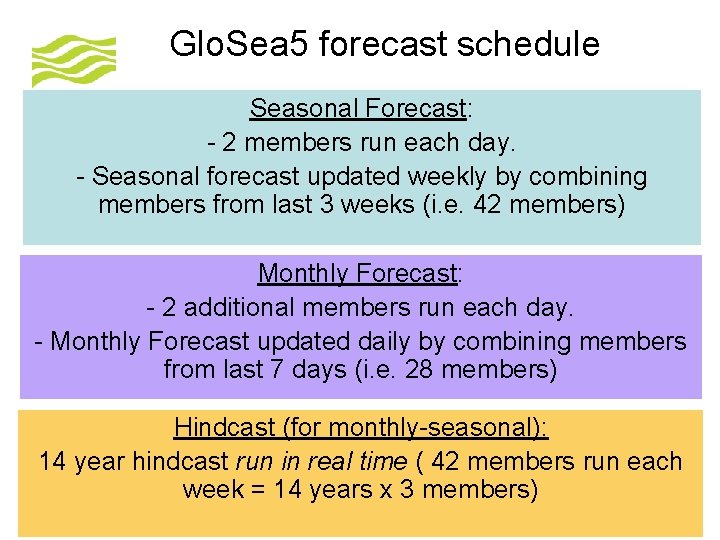
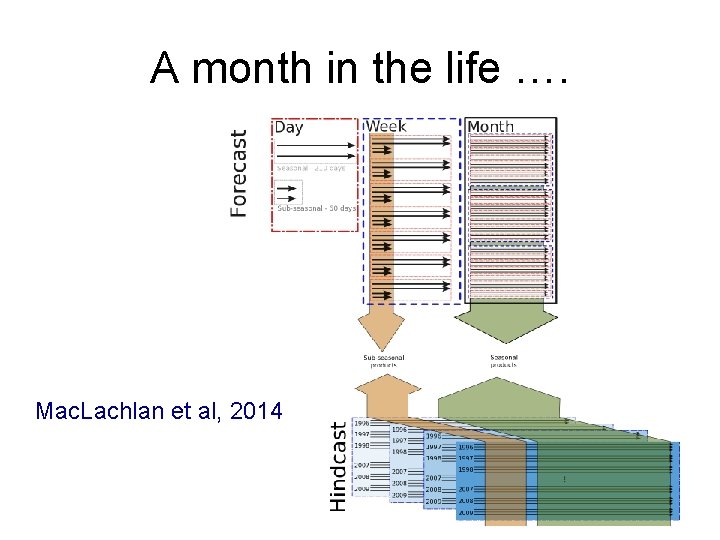
Glo. Sea 5 forecast schedule Seasonal Forecast: - 2 members run each day. - Seasonal forecast updated weekly by combining members from last 3 weeks (i. e. 42 members) Monthly Forecast: - 2 additional members run each day. - Monthly Forecast updated daily by combining members from last 7 days (i. e. 28 members) Hindcast (for monthly-seasonal): 14 year hindcast run in real time ( 42 members run each week = 14 years x 3 members) © Crown copyright Met Office
A month in the life …. Mac. Lachlan et al, 2014
Products Met Office website: http: //www. metoffice. gov. uk/research/climate/sea sonal-to-decadal/gpc-outlooks Lead Centre for Long-Range Forecast Multi. Model Ensemble (hosted by Korea Meteorological Administration): https: //www. wmolc. org/ www. metoffice. gov. uk © Crown Copyright 2017, Met Office
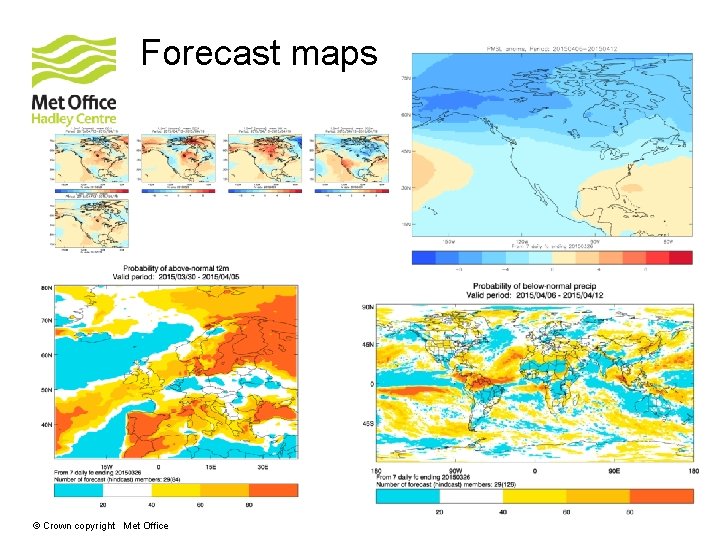
Forecast maps © Crown copyright Met Office
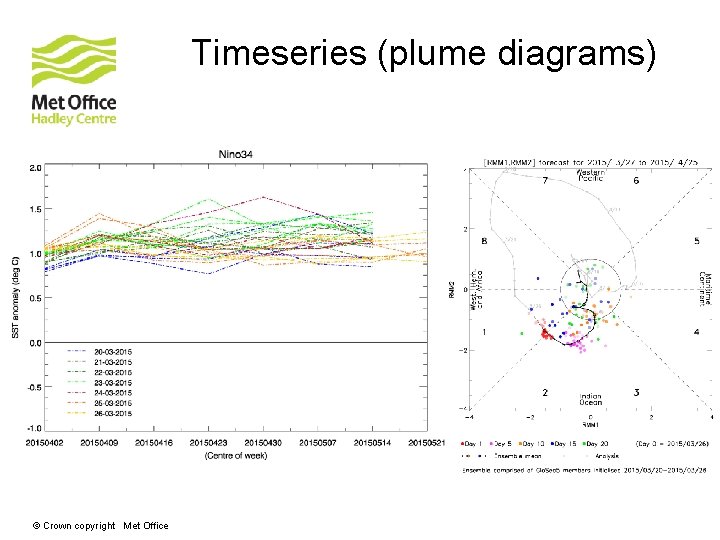
Timeseries (plume diagrams) © Crown copyright Met Office
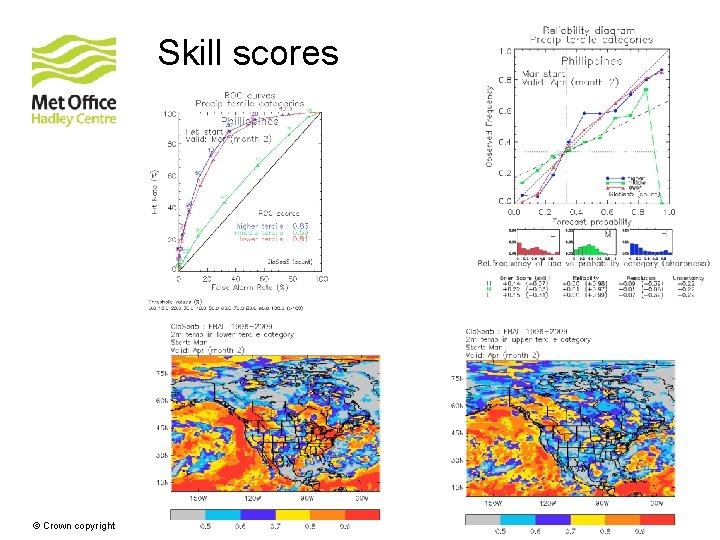
Skill scores © Crown copyright Met Office
New developments in Glo. Sea 5 www. metoffice. gov. uk © Crown Copyright 2016, Met Office
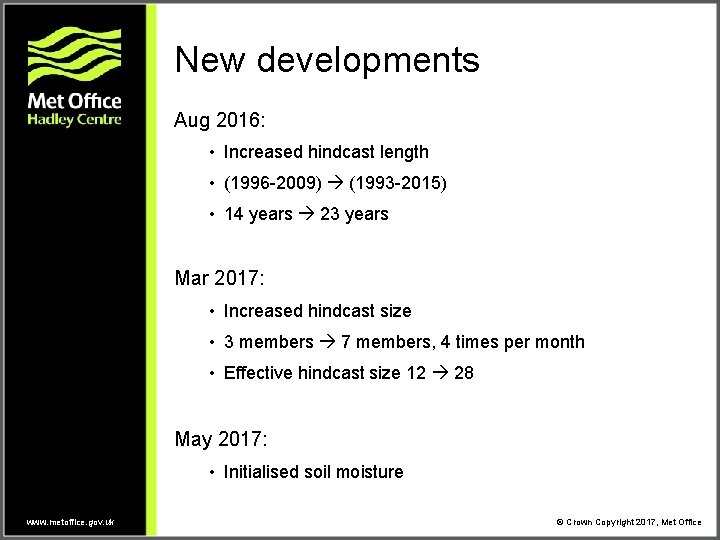
New developments Aug 2016: • Increased hindcast length • (1996 -2009) (1993 -2015) • 14 years 23 years Mar 2017: • Increased hindcast size • 3 members 7 members, 4 times per month • Effective hindcast size 12 28 May 2017: • Initialised soil moisture www. metoffice. gov. uk © Crown Copyright 2017, Met Office
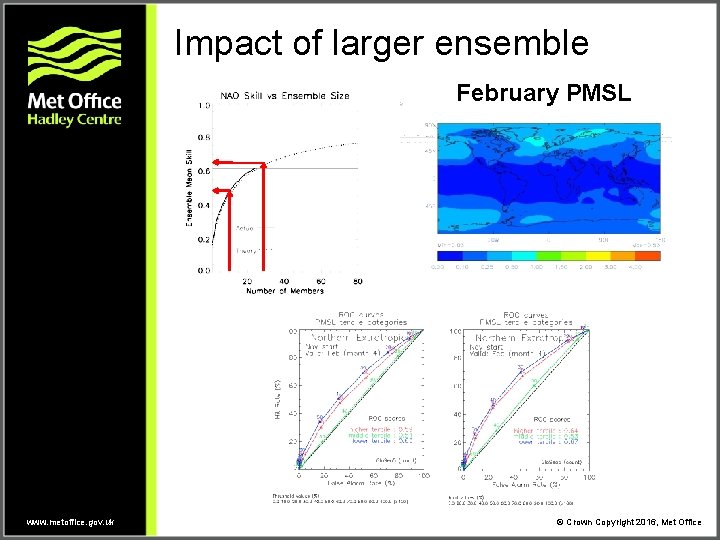
Impact of larger ensemble February PMSL www. metoffice. gov. uk © Crown Copyright 2016, Met Office
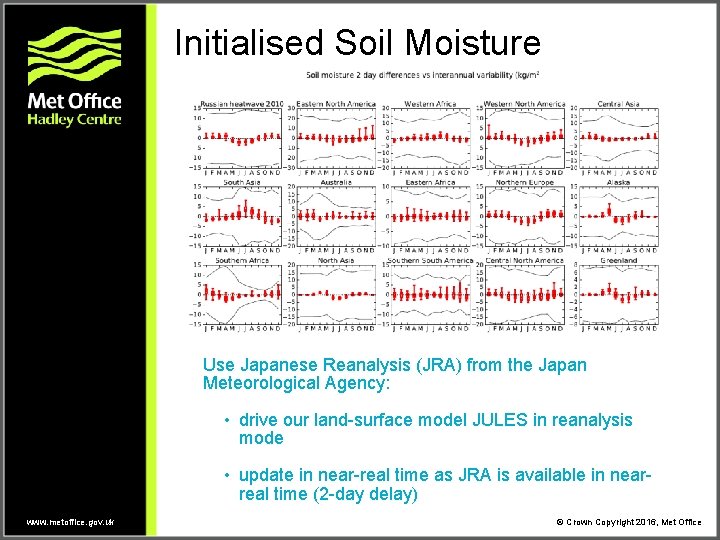
Initialised Soil Moisture Use Japanese Reanalysis (JRA) from the Japan Meteorological Agency: • drive our land-surface model JULES in reanalysis mode • update in near-real time as JRA is available in nearreal time (2 -day delay) www. metoffice. gov. uk © Crown Copyright 2016, Met Office
The 2015 -16 El Niño: impacts in UK and China www. metoffice. gov. uk © Crown Copyright 2016, Met Office
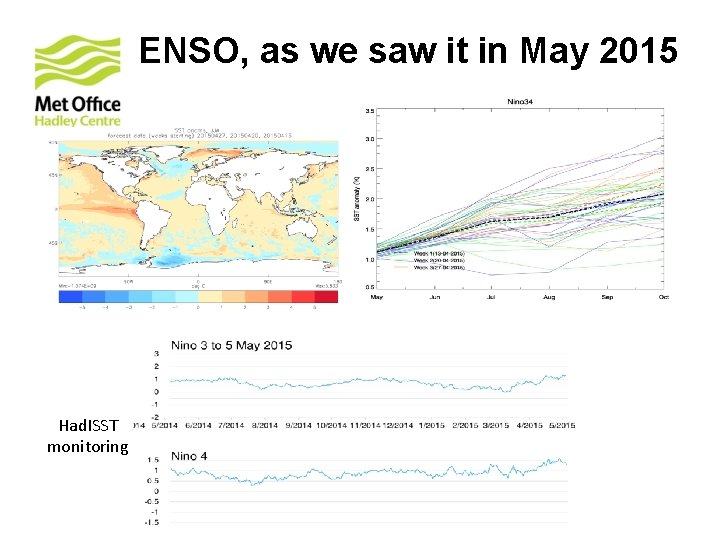
ENSO, as we saw it in May 2015 Had. ISST monitoring
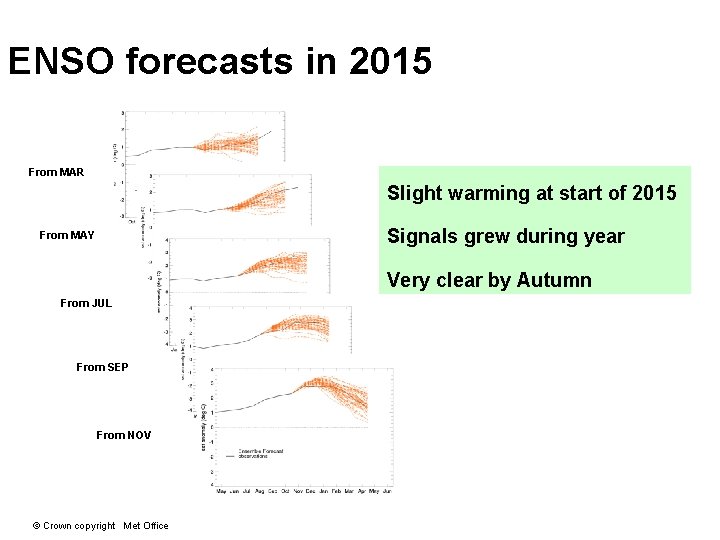
ENSO forecasts in 2015 From MAR Slight warming at start of 2015 Signals grew during year From MAY Very clear by Autumn From JUL From SEP From NOV © Crown copyright Met Office
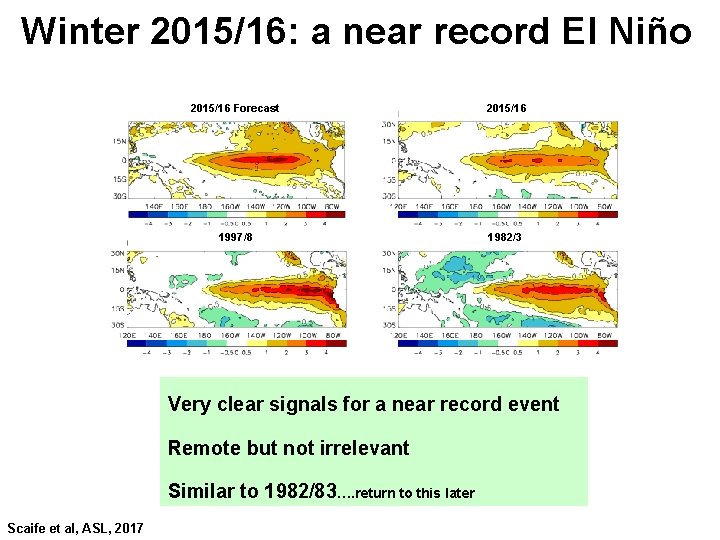
Winter 2015/16: a near record El Niño 2015/16 Forecast 2015/16 1997/8 1982/3 Very clear signals for a near record event Remote but not irrelevant Similar to 1982/83…. return to this later Scaife et al, ASL, 2017
Europe: Dec 2015 metoffice. gov. uk © Crown copyright
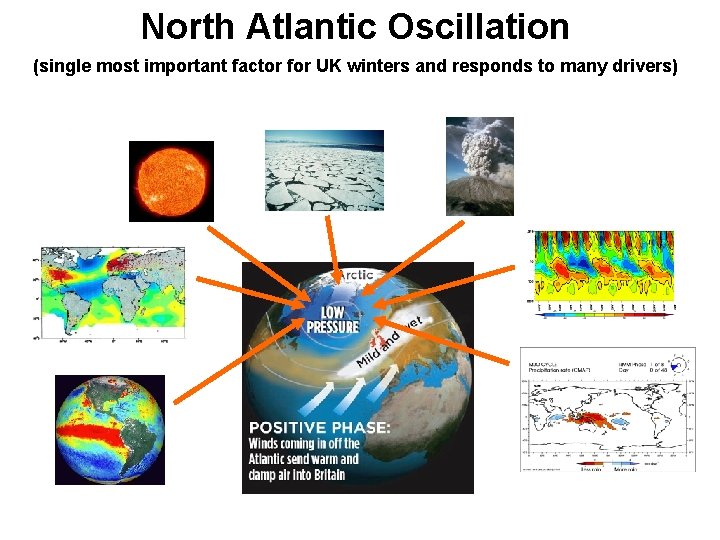
North Atlantic Oscillation (single most important factor for UK winters and responds to many drivers)
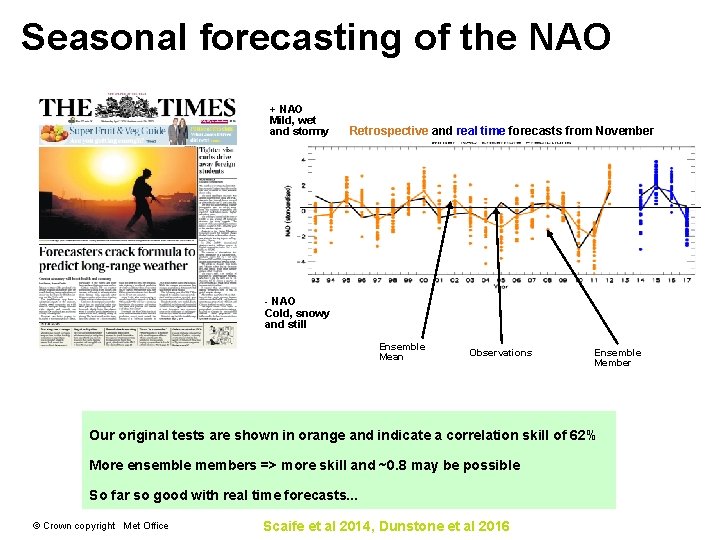
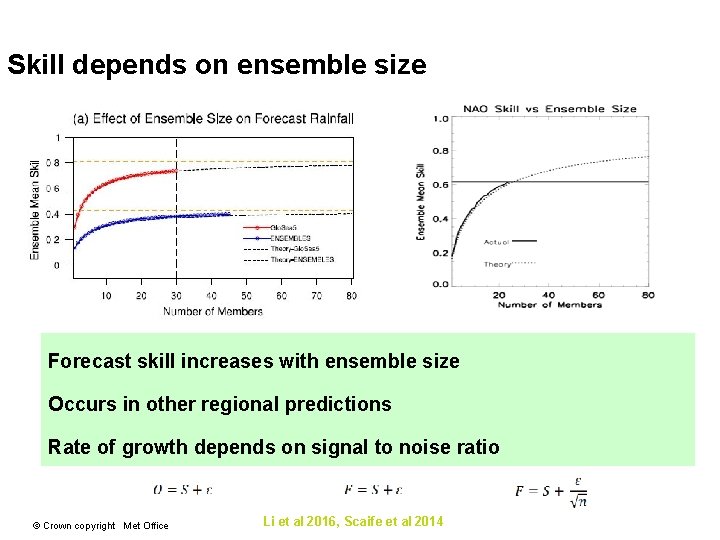
Seasonal forecasting of the NAO + NAO Mild, wet and stormy Retrospective and real time forecasts from November - NAO Cold, snowy and still Ensemble Mean Observations Ensemble Member Our original tests are shown in orange and indicate a correlation skill of 62% More ensemble members => more skill and ~0. 8 may be possible So far so good with real time forecasts. . . © Crown copyright Met Office Scaife et al 2014, Dunstone et al 2016
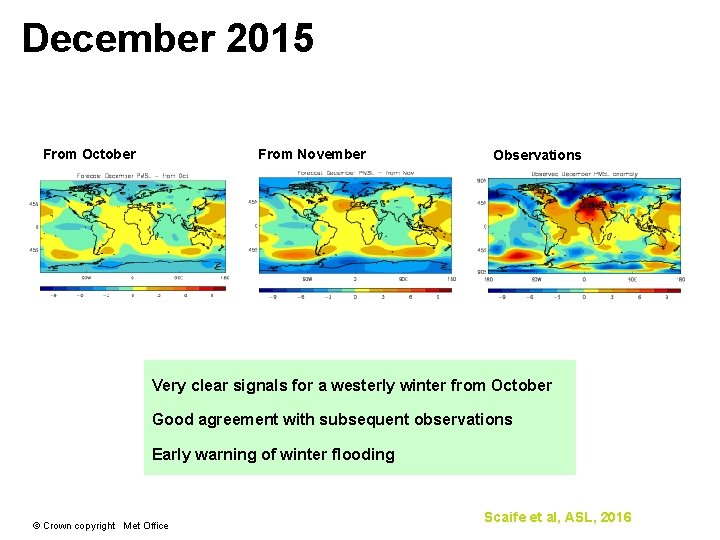
December 2015 From October From November Observations Very clear signals for a westerly winter from October Good agreement with subsequent observations Early warning of winter flooding © Crown copyright Met Office Scaife et al, ASL, 2016
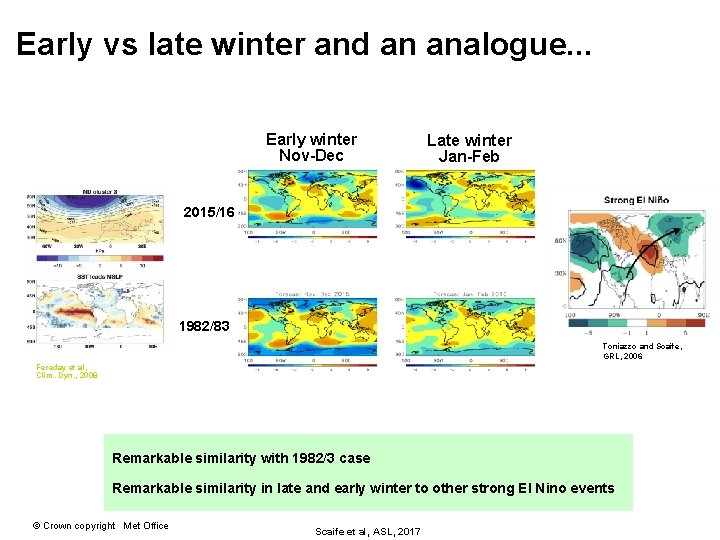
Early vs late winter and an analogue. . . Early winter Nov-Dec Late winter Jan-Feb 2015/16 1982/83 Toniazzo and Scaife, GRL, 2006 Fereday et al, Clim. Dyn. , 2008 Remarkable similarity with 1982/3 case Remarkable similarity in late and early winter to other strong El Nino events © Crown copyright Met Office Scaife et al, ASL, 2017
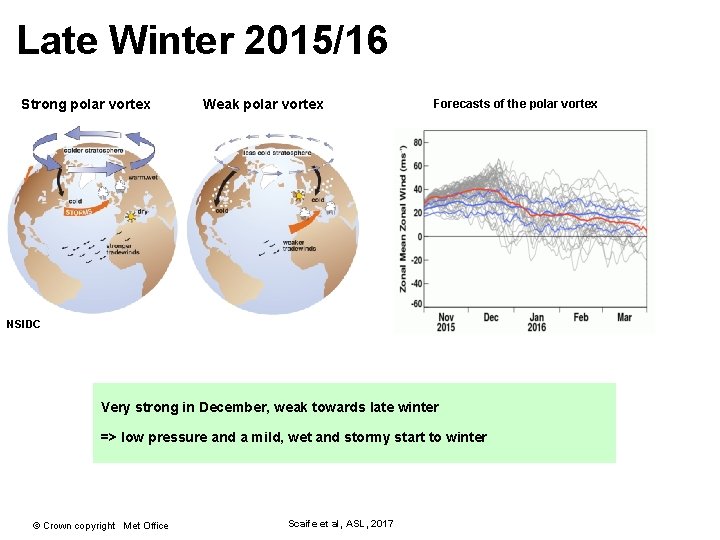
Late Winter 2015/16 Strong polar vortex Weak polar vortex Forecasts of the polar vortex NSIDC Very strong in December, weak towards late winter => low pressure and a mild, wet and stormy start to winter © Crown copyright Met Office Scaife et al, ASL, 2017
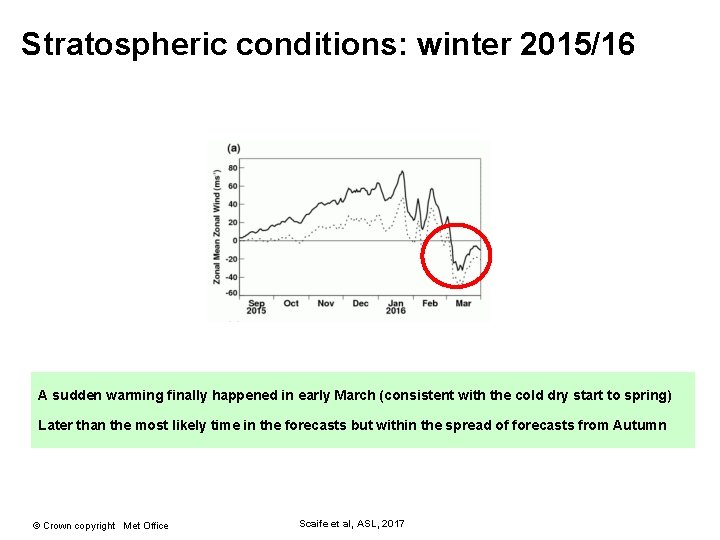
Stratospheric conditions: winter 2015/16 A sudden warming finally happened in early March (consistent with the cold dry start to spring) Later than the most likely time in the forecasts but within the spread of forecasts from Autumn © Crown copyright Met Office Scaife et al, ASL, 2017
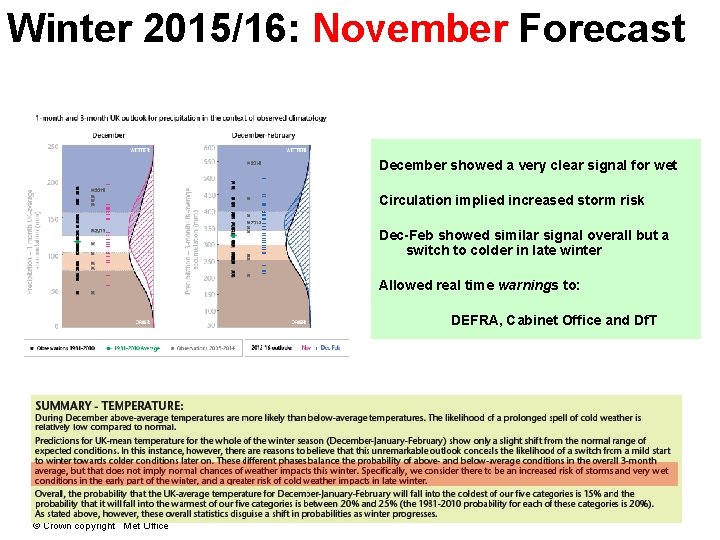
Winter 2015/16: November Forecast December showed a very clear signal for wet Circulation implied increased storm risk Dec-Feb showed similar signal overall but a switch to colder in late winter Allowed real time warnings to: DEFRA, Cabinet Office and Df. T © Crown copyright Met Office
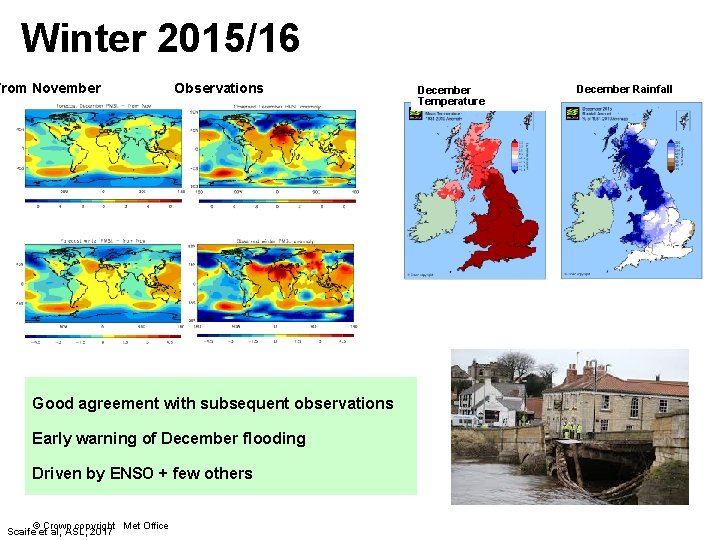
Winter 2015/16 From November Observations Good agreement with subsequent observations Early warning of December flooding Driven by ENSO + few others © Crown copyright Met Office Scaife et al, ASL, 2017 December Temperature December Rainfall
China: summer 2016 metoffice. gov. uk © Crown copyright
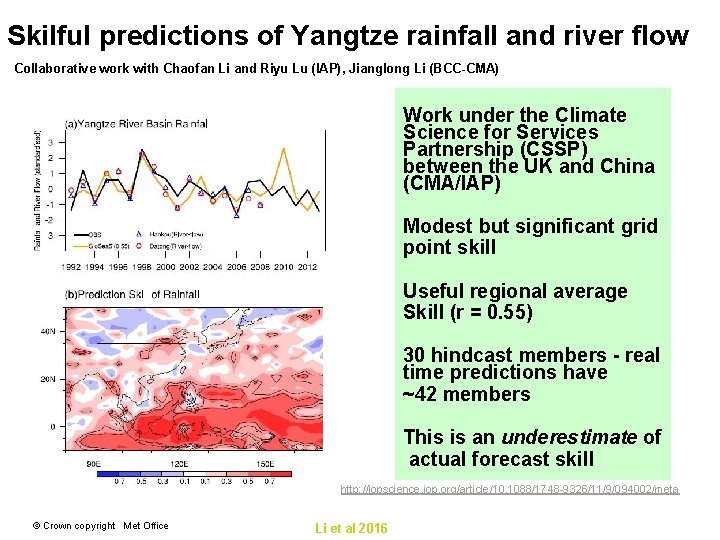
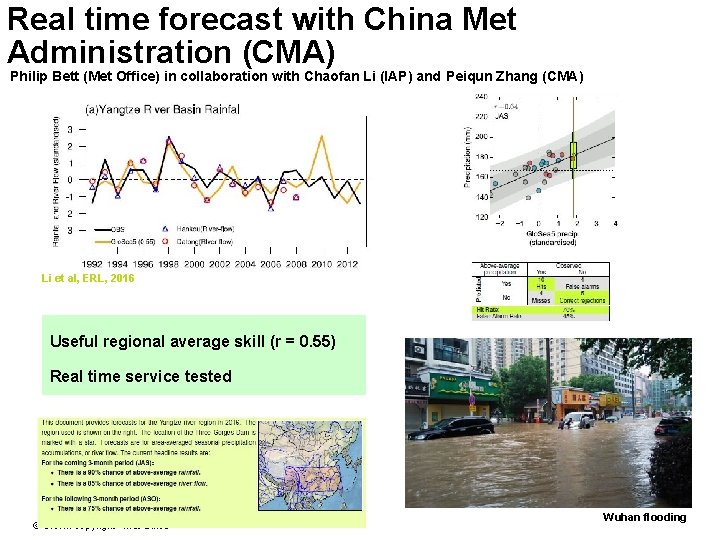
Skilful predictions of Yangtze rainfall and river flow Collaborative work with Chaofan Li and Riyu Lu (IAP), Jianglong Li (BCC-CMA) Work under the Climate Science for Services Partnership (CSSP) between the UK and China (CMA/IAP) Modest but significant grid point skill Useful regional average Skill (r = 0. 55) 30 hindcast members - real time predictions have ~42 members This is an underestimate of actual forecast skill http: //iopscience. iop. org/article/10. 1088/1748 -9326/11/9/094002/meta © Crown copyright Met Office Li et al 2016
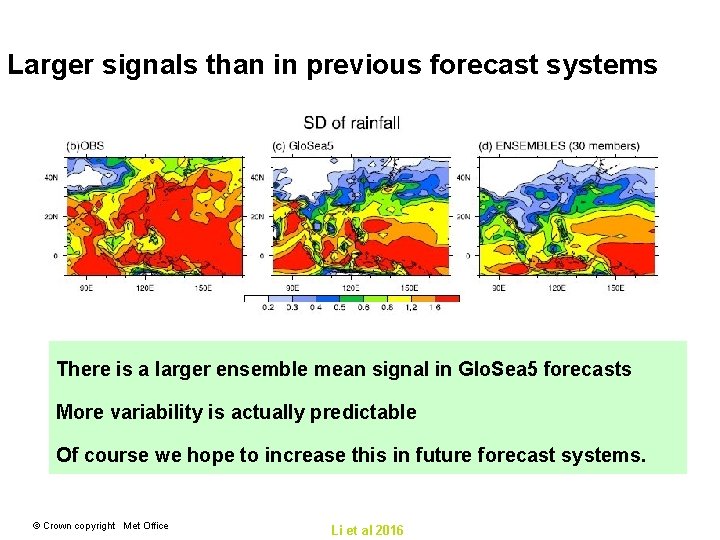
Larger signals than in previous forecast systems There is a larger ensemble mean signal in Glo. Sea 5 forecasts More variability is actually predictable Of course we hope to increase this in future forecast systems. © Crown copyright Met Office Li et al 2016
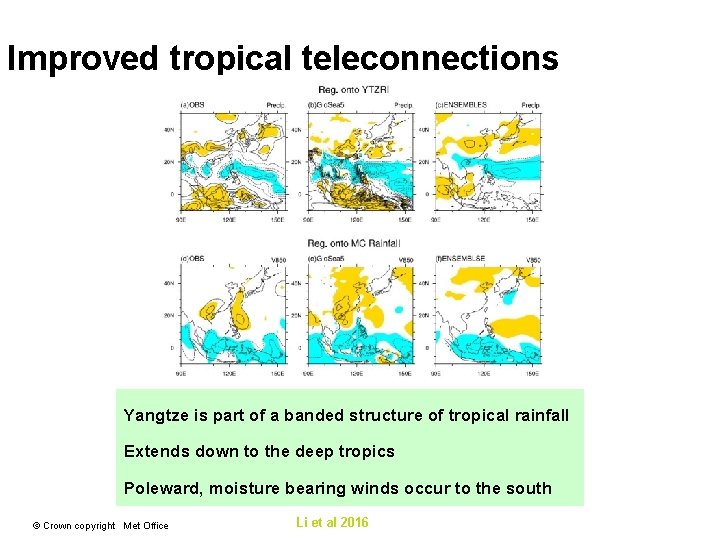
Improved tropical teleconnections Yangtze is part of a banded structure of tropical rainfall Extends down to the deep tropics Poleward, moisture bearing winds occur to the south © Crown copyright Met Office Li et al 2016
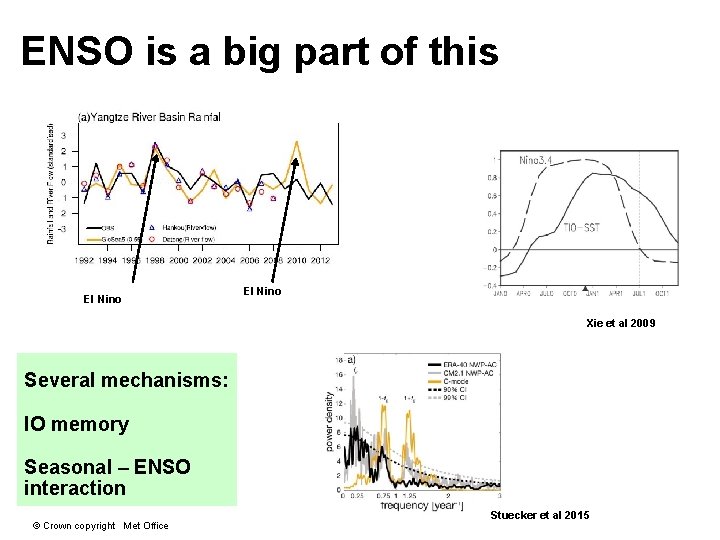
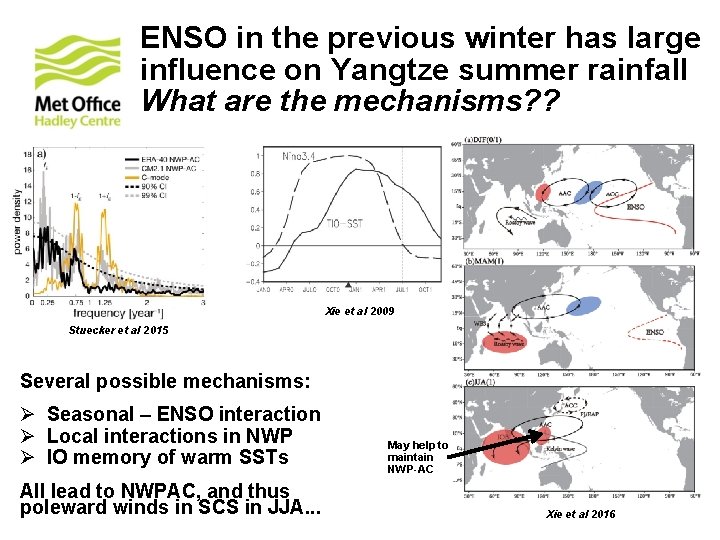
ENSO is a big part of this El Nino Xie et al 2009 Several mechanisms: IO memory Seasonal – ENSO interaction © Crown copyright Met Office Stuecker et al 2015
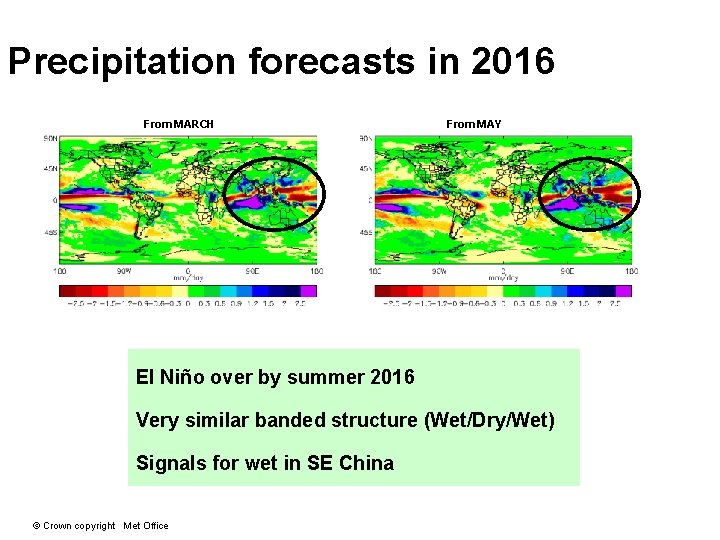
Precipitation forecasts in 2016 From MARCH From MAY El Niño over by summer 2016 Very similar banded structure (Wet/Dry/Wet) Signals for wet in SE China © Crown copyright Met Office
Real time forecast with China Met Administration (CMA) Philip Bett (Met Office) in collaboration with Chaofan Li (IAP) and Peiqun Zhang (CMA) Li et al, ERL, 2016 Useful regional average skill (r = 0. 55) Real time service tested © Crown copyright Met Office Wuhan flooding
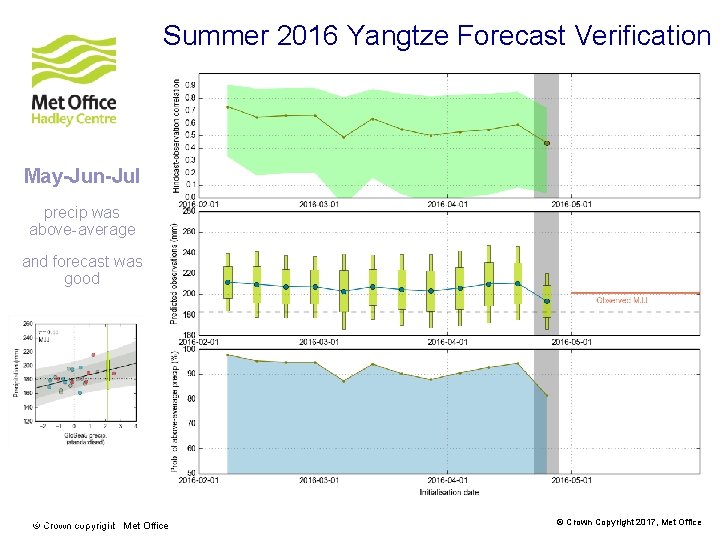
Summer 2016 Yangtze Forecast Verification May-Jun-Jul precip was above-average and forecast was good www. metoffice. gov. uk © Crown copyright Met Office © Crown Copyright 2017, Met Office
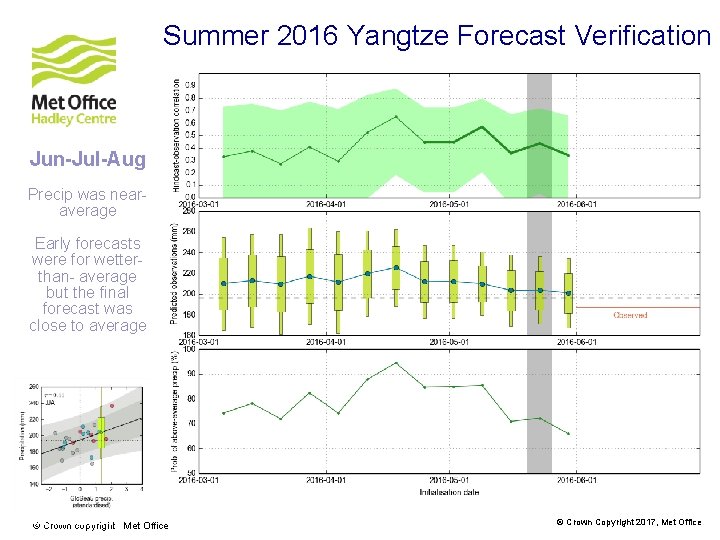
Summer 2016 Yangtze Forecast Verification Jun-Jul-Aug Precip was nearaverage Early forecasts were for wetterthan- average but the final forecast was close to average www. metoffice. gov. uk © Crown copyright Met Office © Crown Copyright 2017, Met Office
Teleconnections of La Niña www. metoffice. gov. uk © Crown Copyright 2016, Met Office
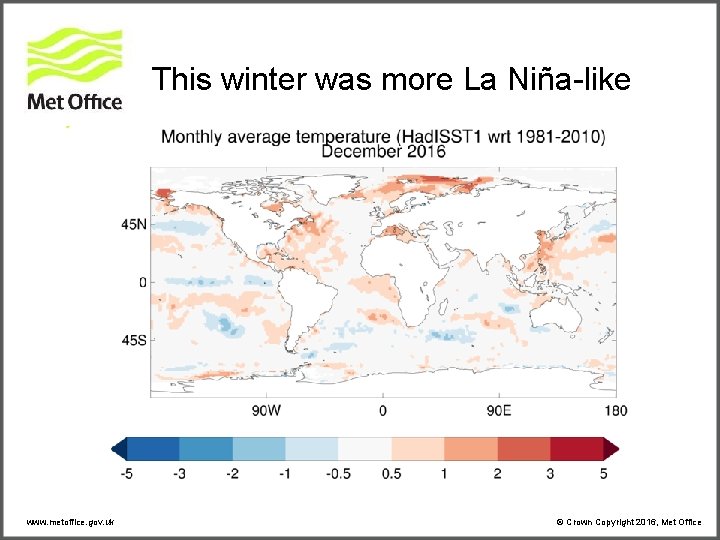
This winter was more La Niña-like www. metoffice. gov. uk © Crown Copyright 2016, Met Office
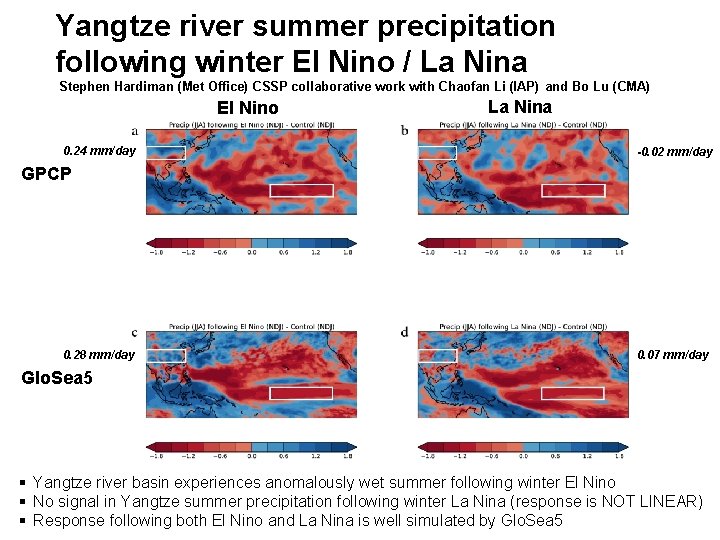
Yangtze river summer precipitation following winter El Nino / La Nina Stephen Hardiman (Met Office) CSSP collaborative work with Chaofan Li (IAP) and Bo Lu (CMA) El Nino 0. 24 mm/day La Nina -0. 02 mm/day GPCP 0. 28 mm/day 0. 07 mm/day Glo. Sea 5 § Yangtze river basin experiences anomalously wet summer following winter El Nino § No signal in Yangtze summer precipitation following winter La Nina (response is NOT LINEAR) § Response following both El Nino and La Nina is well simulated by Glo. Sea 5
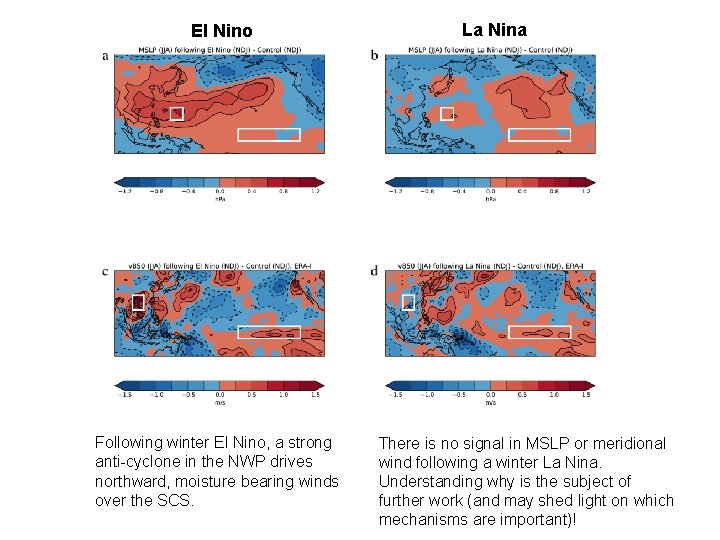
El Nino Following winter El Nino, a strong anti-cyclone in the NWP drives northward, moisture bearing winds over the SCS. La Nina There is no signal in MSLP or meridional wind following a winter La Nina. Understanding why is the subject of further work (and may shed light on which mechanisms are important)!
ENSO in the previous winter has large influence on Yangtze summer rainfall What are the mechanisms? ? Xie et al 2009 Stuecker et al 2015 Several possible mechanisms: Ø Seasonal – ENSO interaction Ø Local interactions in NWP Ø IO memory of warm SSTs All lead to NWPAC, and thus poleward winds in SCS in JJA. . . May help to maintain NWP-AC Xie et al 2016
Evaluating the Risk of Extremes www. metoffice. gov. uk © Crown Copyright 2016, Met Office
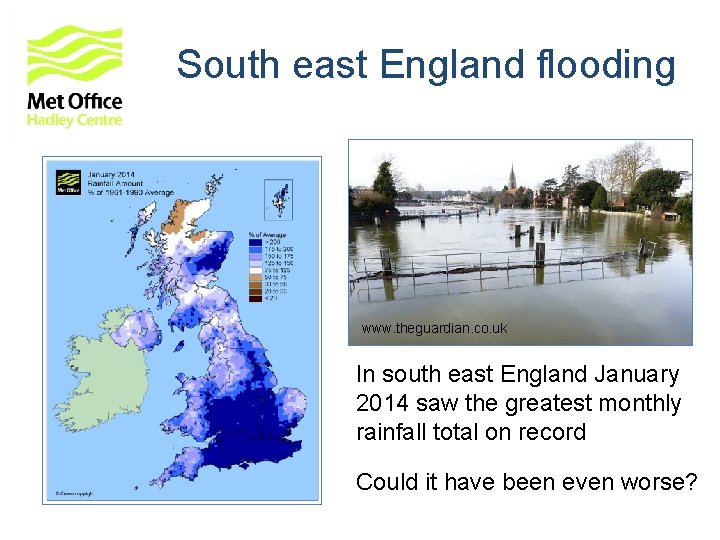
South east England flooding www. theguardian. co. uk In south east England January 2014 saw the greatest monthly rainfall total on record Could it have been even worse?
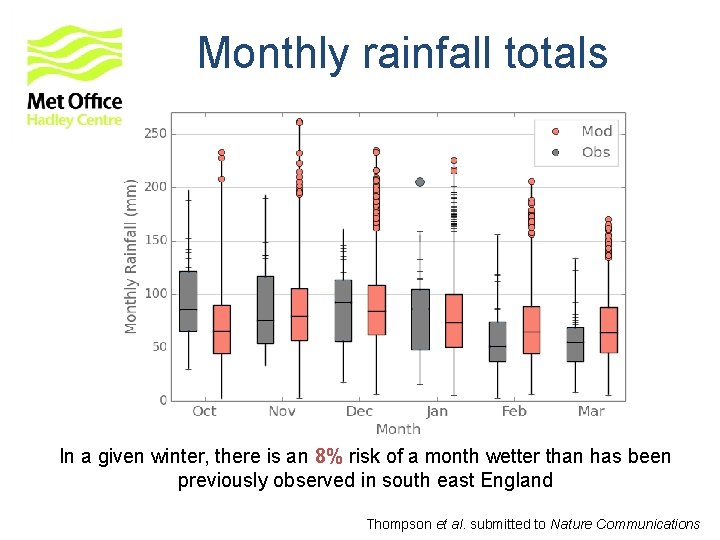
Monthly rainfall totals In a given winter, there is an 8% risk of a month wetter than has been previously observed in south east England Thompson et al. submitted to Nature Communications
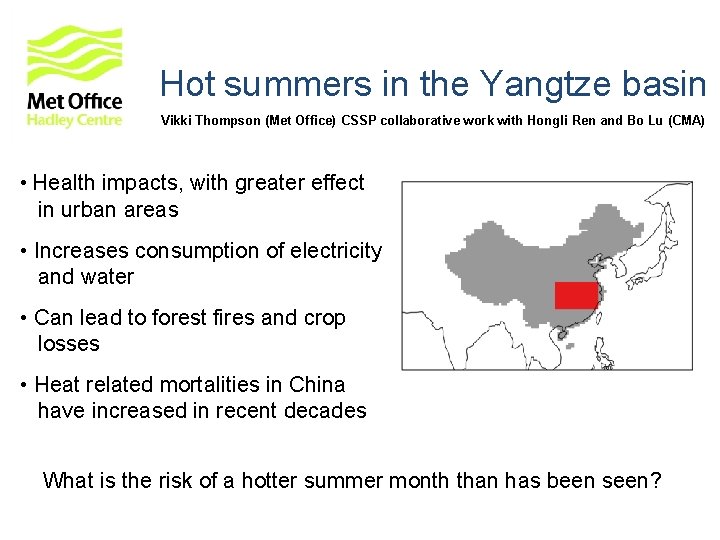
Hot summers in the Yangtze basin Vikki Thompson (Met Office) CSSP collaborative work with Hongli Ren and Bo Lu (CMA) • Health impacts, with greater effect in urban areas • Increases consumption of electricity and water • Can lead to forest fires and crop losses • Heat related mortalities in China have increased in recent decades What is the risk of a hotter summer month than has been seen?
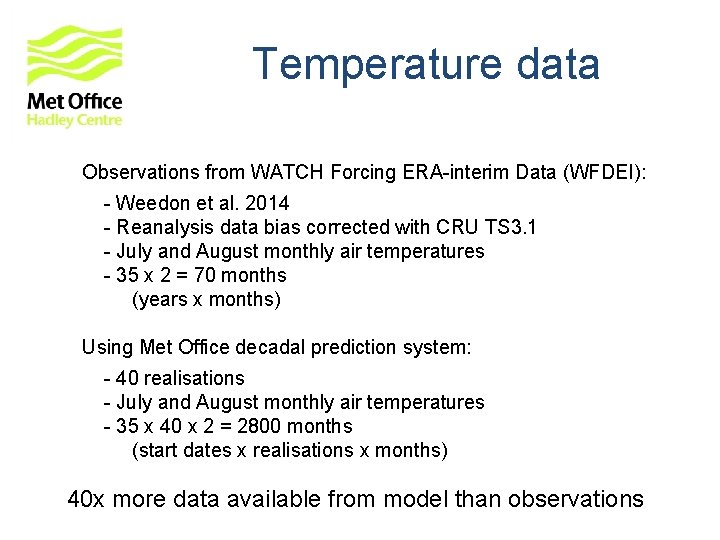
Temperature data Observations from WATCH Forcing ERA-interim Data (WFDEI): - Weedon et al. 2014 - Reanalysis data bias corrected with CRU TS 3. 1 - July and August monthly air temperatures - 35 x 2 = 70 months (years x months) Using Met Office decadal prediction system: - 40 realisations - July and August monthly air temperatures - 35 x 40 x 2 = 2800 months (start dates x realisations x months) 40 x more data available from model than observations
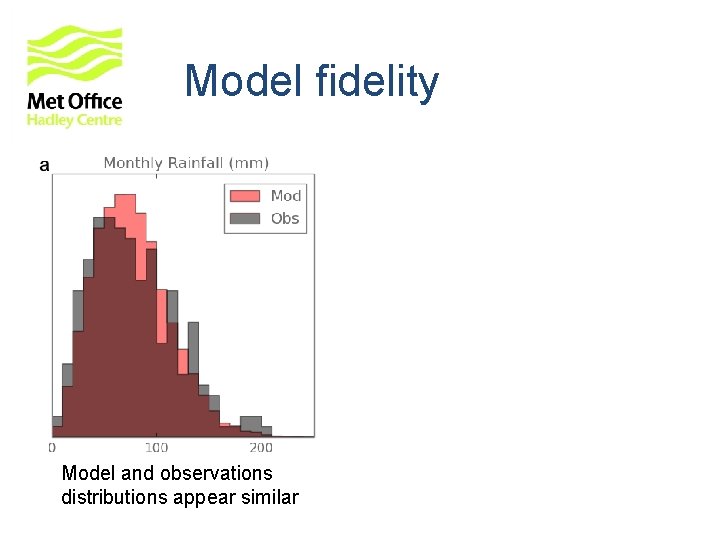
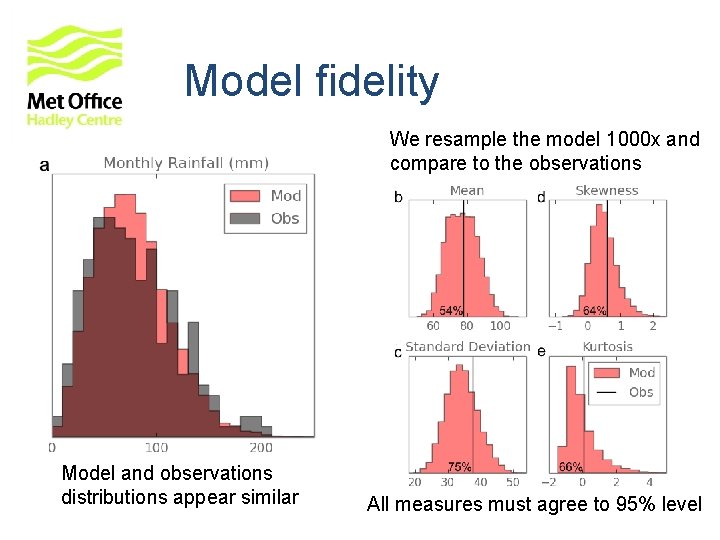
Model fidelity Model and observations distributions appear similar
Model fidelity We resample the model 1000 x and compare to the observations Model and observations distributions appear similar All measures must agree to 95% level
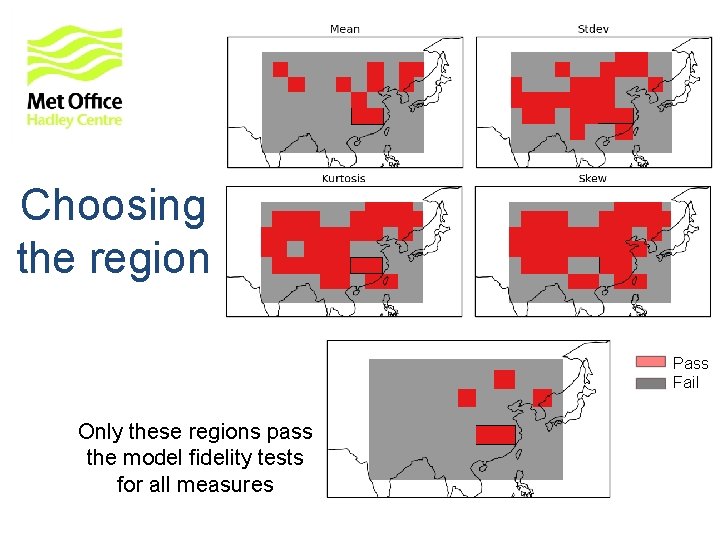
Choosing the region Pass Fail Only these regions pass the model fidelity tests for all measures
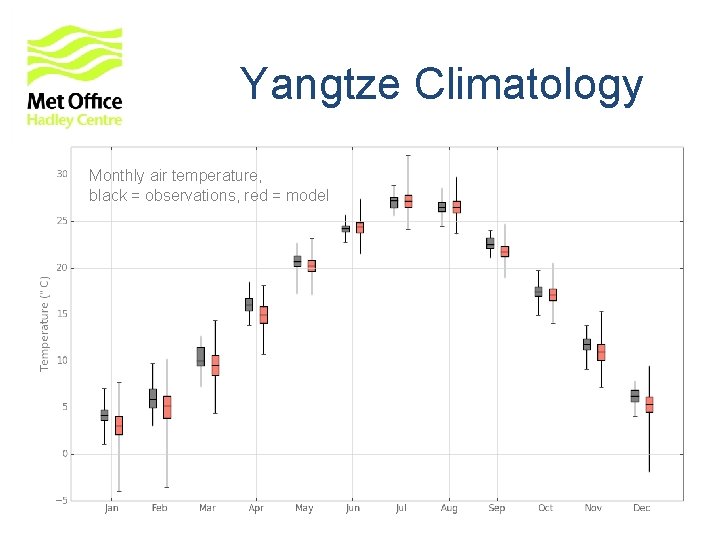
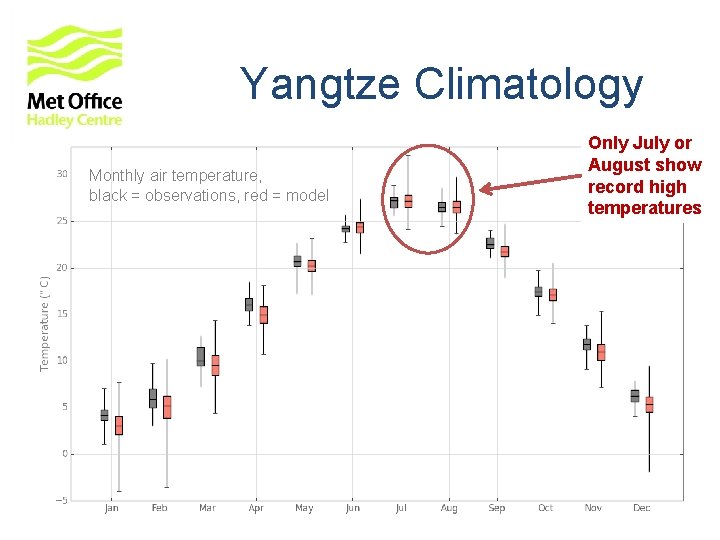
Yangtze Climatology Monthly air temperature, black = observations, red = model
Yangtze Climatology Monthly air temperature, black = observations, red = model Only July or August show record high temperatures
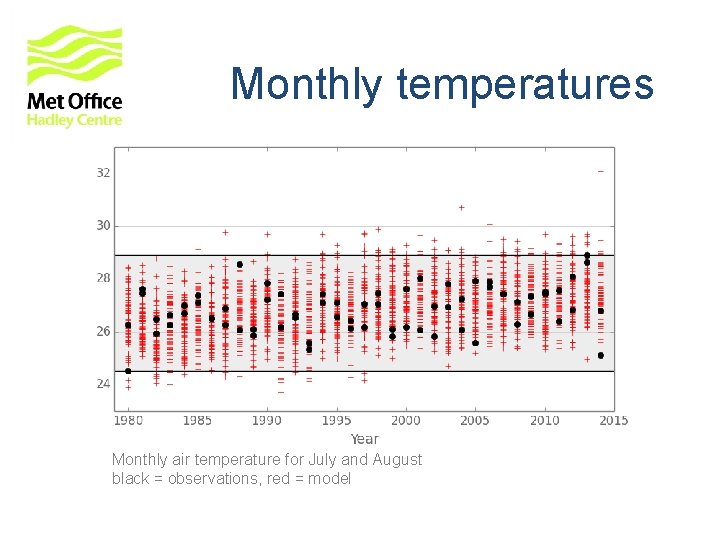
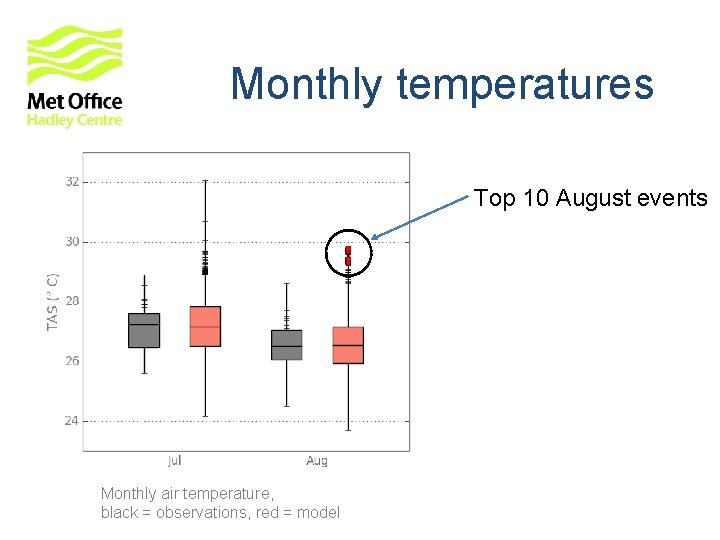
Monthly temperatures Monthly air temperature for July and August black = observations, red = model
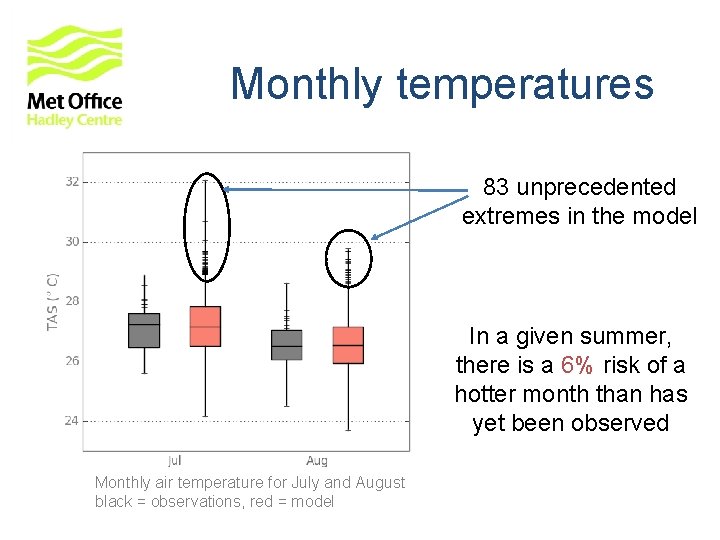
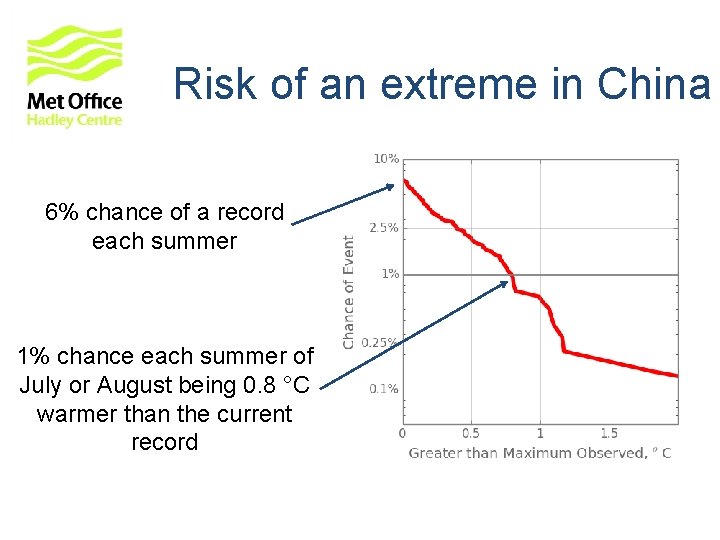
Monthly temperatures 83 unprecedented extremes in the model In a given summer, there is a 6% risk of a hotter month than has yet been observed Monthly air temperature for July and August black = observations, red = model
Risk of an extreme in China 6% chance of a record each summer 1% chance each summer of July or August being 0. 8 °C warmer than the current record
Monthly temperatures Top 10 August events Monthly air temperature, black = observations, red = model
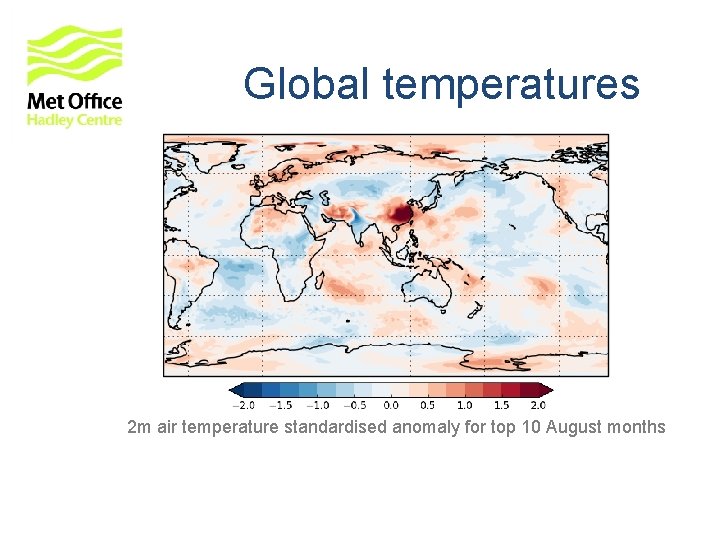
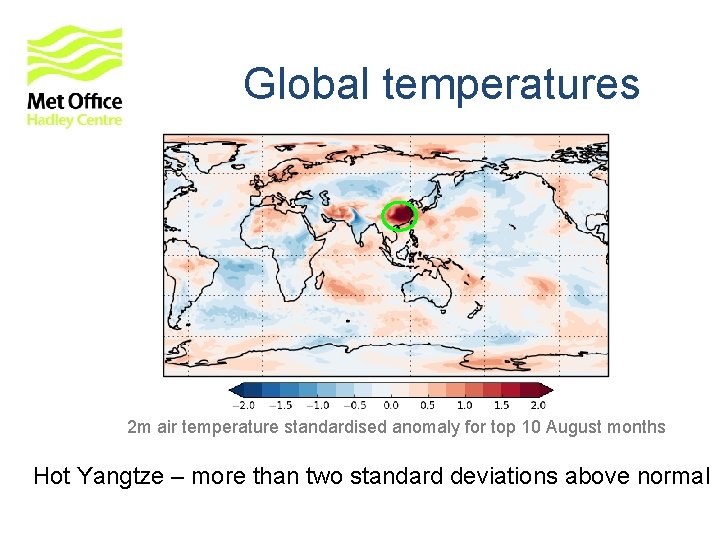
Global temperatures 2 m air temperature standardised anomaly for top 10 August months
Global temperatures 2 m air temperature standardised anomaly for top 10 August months Hot Yangtze – more than two standard deviations above normal
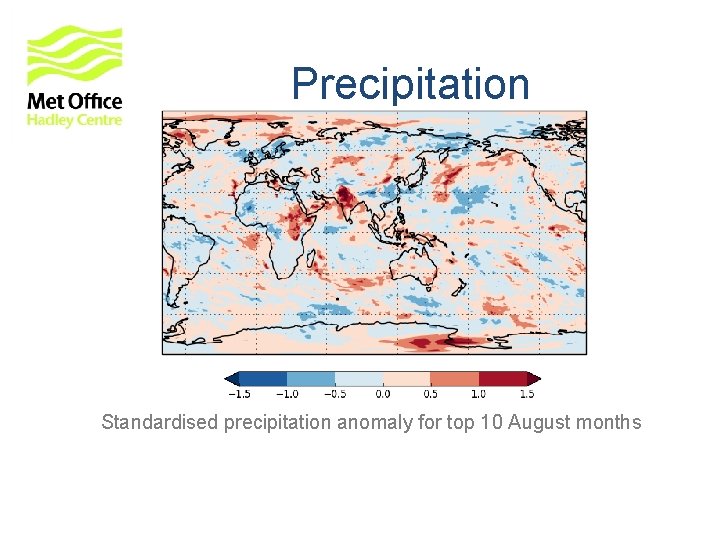
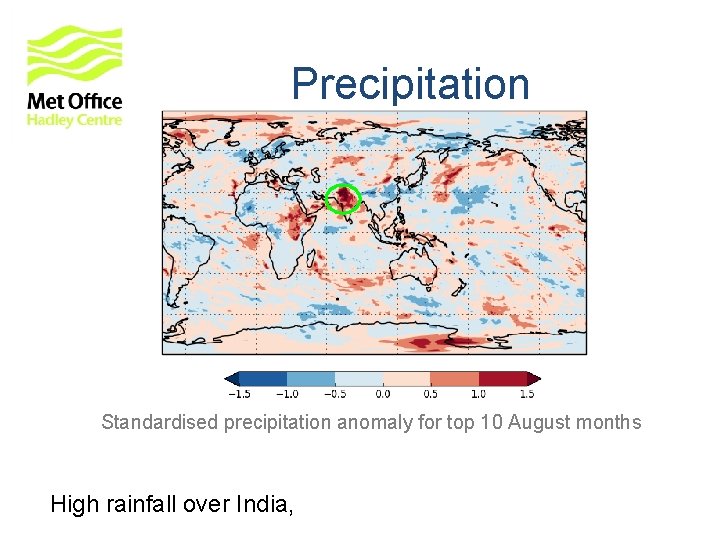
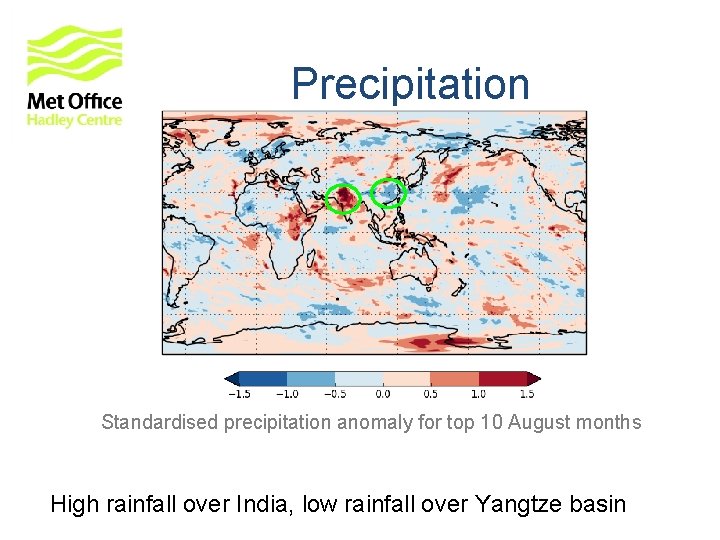
Precipitation Standardised precipitation anomaly for top 10 August months
Precipitation Standardised precipitation anomaly for top 10 August months High rainfall over India,
Precipitation Standardised precipitation anomaly for top 10 August months High rainfall over India, low rainfall over Yangtze basin
Conclusions • The Met Office produces routine long-range forecasts using Glo. Sea 5 prediction system • Outputs are available from the Met Office website and the Lead Centre for Long-Range Forecast Multi-Model Ensemble • New developments are improving skill estimation and bias correction • Research on various topics for European and global predictability is bearing fruit • A number of topics on East Asian climate are being jointly tackled with collaborators at CMA and IAP under the UK-China Climate Science for Services Partnership (CSSP) www. metoffice. gov. uk © Crown Copyright 2016, Met Office
Thank You! Any Questions? www. metoffice. gov. uk © Crown Copyright 2016, Met Office
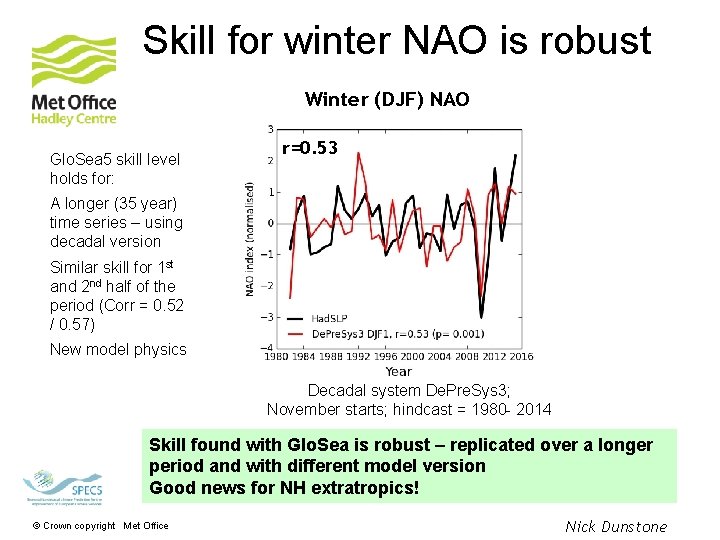
Skill for winter NAO is robust Winter (DJF) NAO Glo. Sea 5 skill level holds for: r=0. 53 A longer (35 year) time series – using decadal version Similar skill for 1 st and 2 nd half of the period (Corr = 0. 52 / 0. 57) New model physics Decadal system De. Pre. Sys 3; November starts; hindcast = 1980 - 2014 Skill found with Glo. Sea is robust – replicated over a longer period and with different model version Good news for NH extratropics! © Crown copyright Met Office Nick Dunstone
Skill depends on ensemble size Forecast skill increases with ensemble size Occurs in other regional predictions Rate of growth depends on signal to noise ratio © Crown copyright Met Office Li et al 2016, Scaife et al 2014