
Zebrafish in the Classroom Presented by Cory Doroff

Zebrafish in the Classroom Presented by: Cory Doroff and Amy Van Hecke

Introduction Students may find it more useful to have examples in the lab handout so. . . Objective To introduce a dihybrid cross into the lab handout and work through the whole process of testing heritability -Punnett Square analysis -Chi-Square analysis
Improvements to Lab Handout • Explain how to calculate expected values • Step by step explanation of a dihybrid cross • Explain how notation is verbally communicated, along with the written annotation Based on Laboratory 1 Worksheet. Biol 2202. 2013.
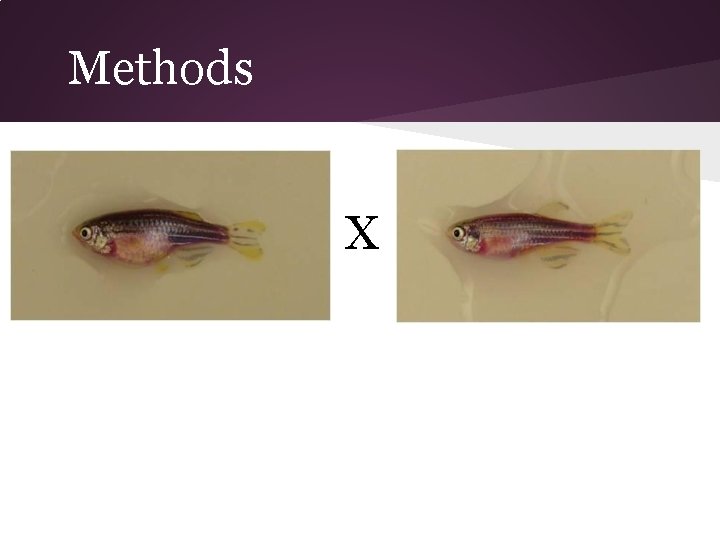
Methods X
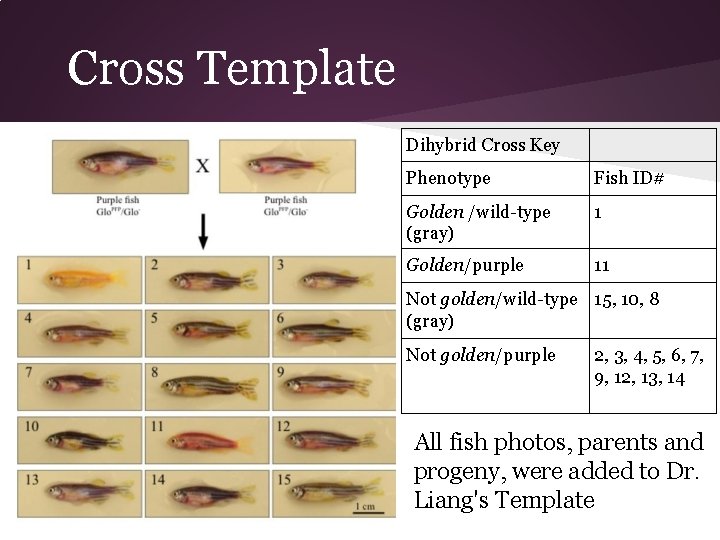
Cross Template Dihybrid Cross Key Phenotype Fish ID# Golden /wild-type (gray) 1 Golden/purple 11 Not golden/wild-type 15, 10, 8 (gray) Not golden/purple 2, 3, 4, 5, 6, 7, 9, 12, 13, 14 All fish photos, parents and progeny, were added to Dr. Liang's Template
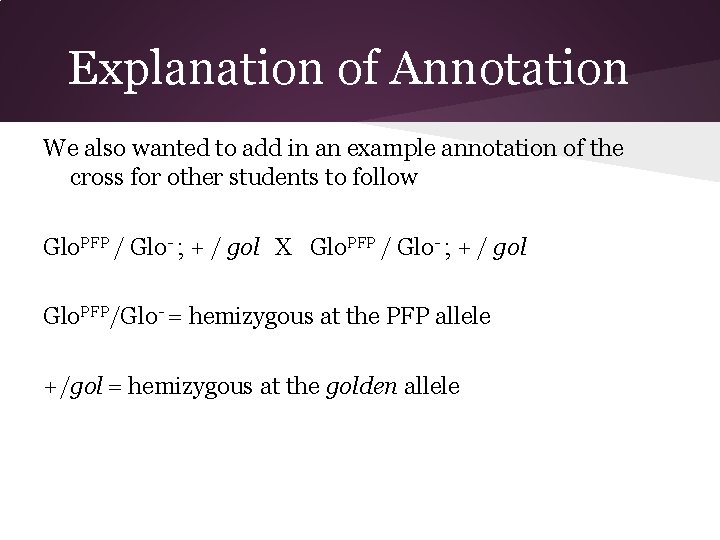
Explanation of Annotation We also wanted to add in an example annotation of the cross for other students to follow Glo. PFP / Glo- ; + / gol X Glo. PFP / Glo- ; + / gol Glo. PFP/Glo- = hemizygous at the PFP allele +/gol = hemizygous at the golden allele
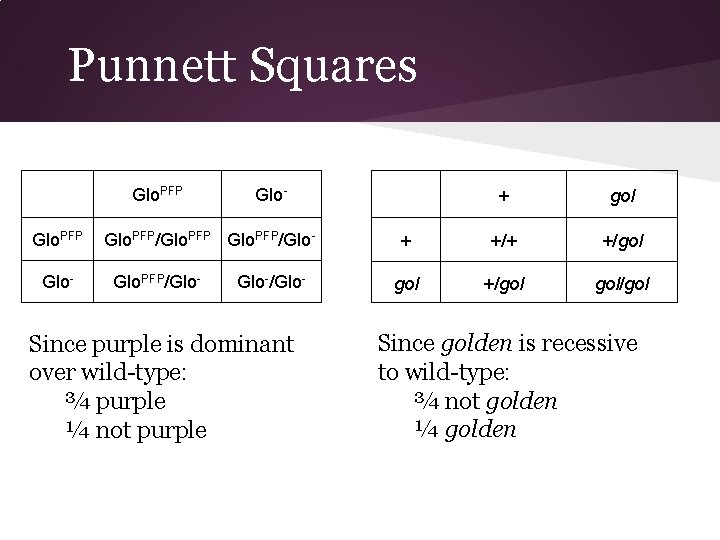
Punnett Squares Glo. PFP Glo- Glo. PFP/Glo-/Glo- Since purple is dominant over wild-type: ¾ purple ¼ not purple + gol + +/gol gol/gol Since golden is recessive to wild-type: ¾ not golden ¼ golden
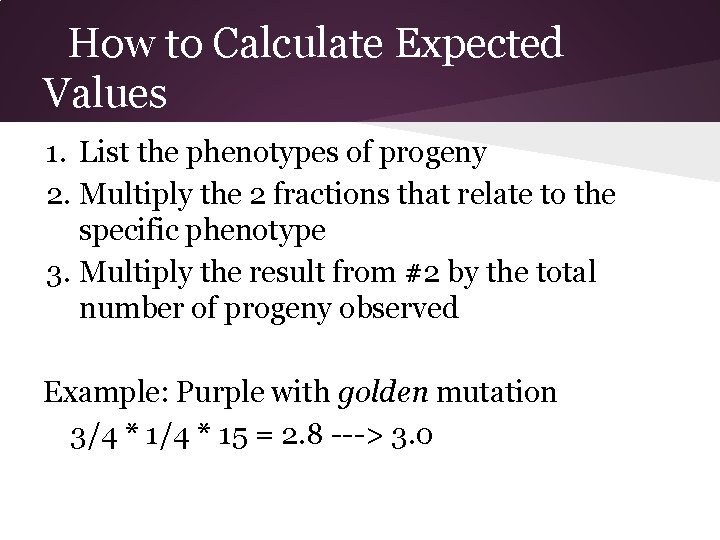
How to Calculate Expected Values 1. List the phenotypes of progeny 2. Multiply the 2 fractions that relate to the specific phenotype 3. Multiply the result from #2 by the total number of progeny observed Example: Purple with golden mutation 3/4 * 15 = 2. 8 ---> 3. 0
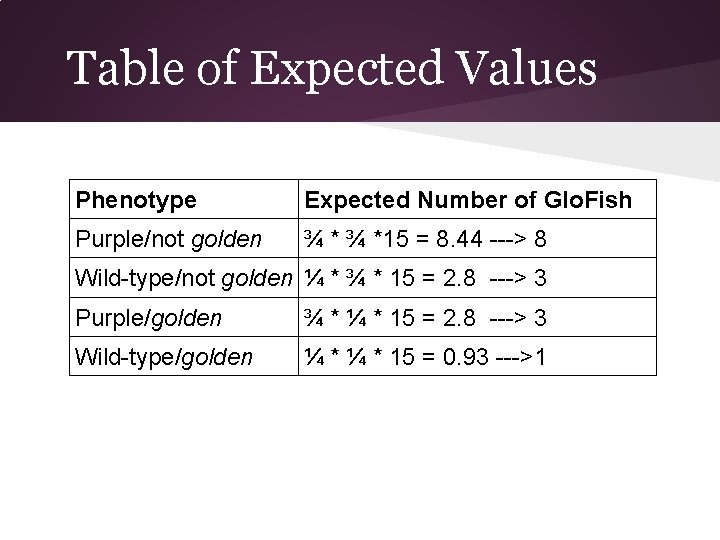
Table of Expected Values Phenotype Expected Number of Glo. Fish Purple/not golden ¾ *15 = 8. 44 ---> 8 Wild-type/not golden ¼ * ¾ * 15 = 2. 8 ---> 3 Purple/golden ¾ * ¼ * 15 = 2. 8 ---> 3 Wild-type/golden ¼ * 15 = 0. 93 --->1
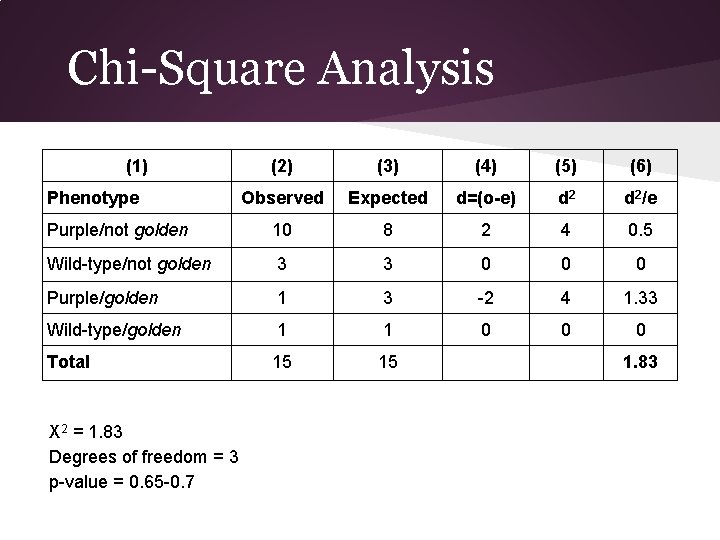
Chi-Square Analysis (1) (2) (3) (4) (5) (6) Observed Expected d=(o-e) d 2/e Purple/not golden 10 8 2 4 0. 5 Wild-type/not golden 3 3 0 0 0 Purple/golden 1 3 -2 4 1. 33 Wild-type/golden 1 1 0 0 0 Total 15 15 Phenotype X 2 = 1. 83 Degrees of freedom = 3 p-value = 0. 65 -0. 7 1. 83
Summary/Conclusion Since the p-value was between 0. 65 and 0. 7, the hypothesis is supported and significant. We think that these additions will be very useful to future students by -helping the teacher with a fun and unusual example -helping the students understand the concepts and notations of dihybrid crosses

Questions?
- Slides: 12