
TEXAS GENERAL LAND OFFICE Texas Coastal Resiliency Master
- Slides: 34
TEXAS GENERAL LAND OFFICE Texas Coastal Resiliency Master Plan 1 st Annual Sustainable Civil Infrastructure Management & Planning Conference
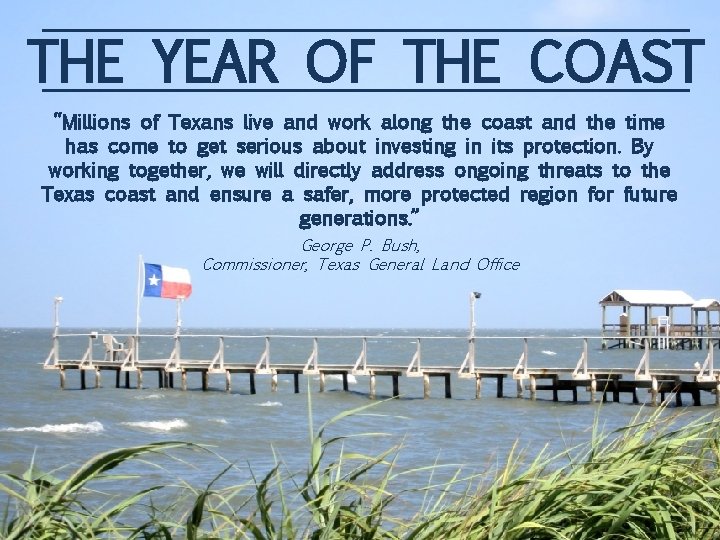
THE YEAR OF THE COAST “Millions of Texans live and work along the coast and the time has come to get serious about investing in its protection. By working together, we will directly address ongoing threats to the Texas coast and ensure a safer, more protected region for future generations. ” George P. Bush, Commissioner, Texas General Land Office
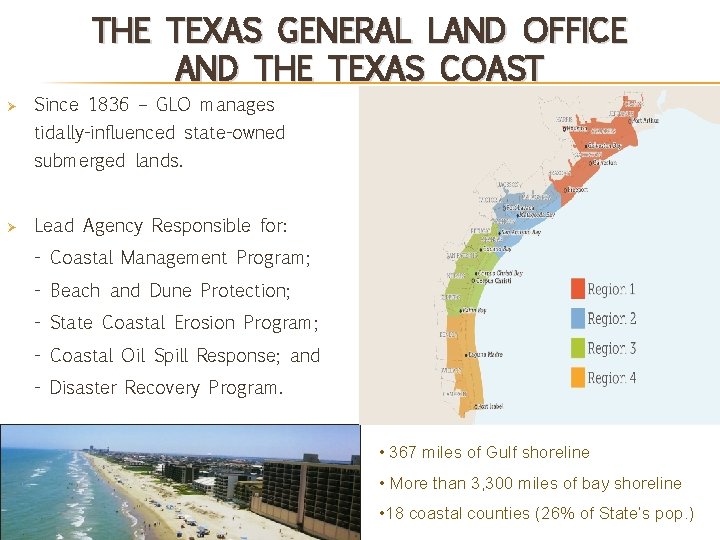
THE TEXAS GENERAL LAND OFFICE AND THE TEXAS COAST Ø Since 1836 – GLO manages tidally-influenced state-owned submerged lands. Ø Lead Agency Responsible for: - Coastal Management Program; - Beach and Dune Protection; - State Coastal Erosion Program; - Coastal Oil Spill Response; and - Disaster Recovery Program. Source: hoteltravel. com • 367 miles of Gulf shoreline • More than 3, 300 miles of bay shoreline • 18 coastal counties (26% of State’s pop. )
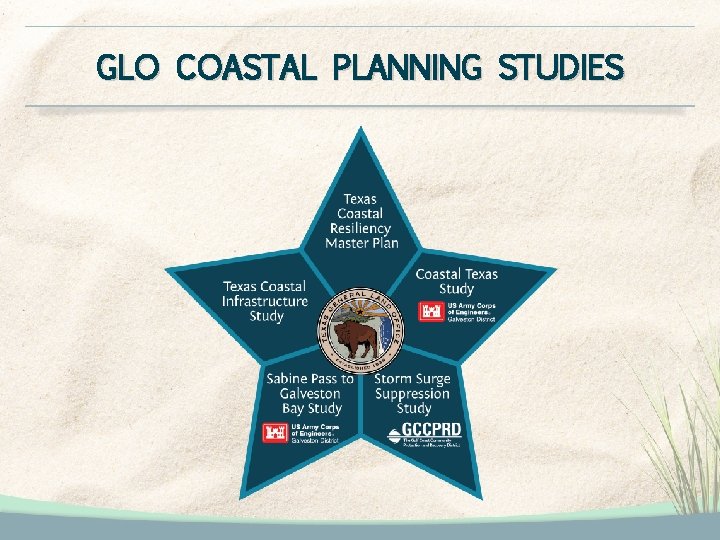
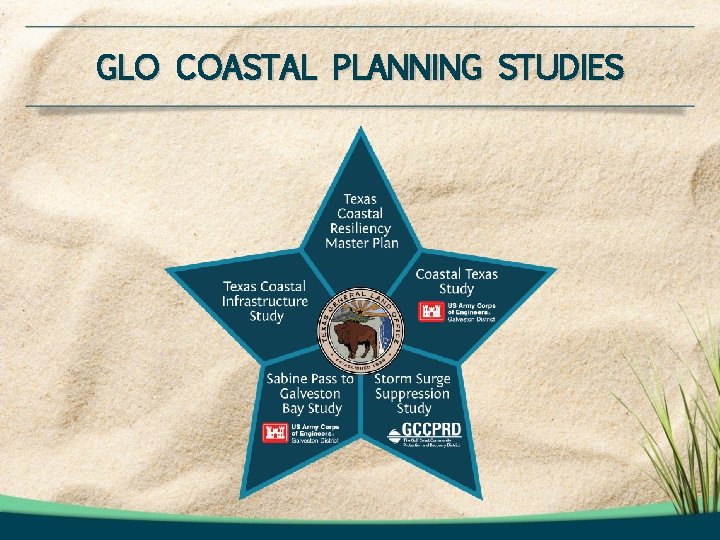
GLO COASTAL PLANNING STUDIES
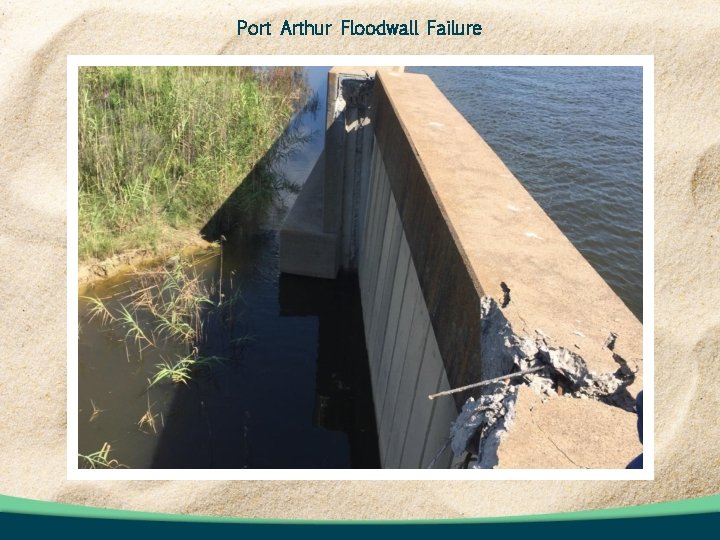
Port Arthur Floodwall Failure
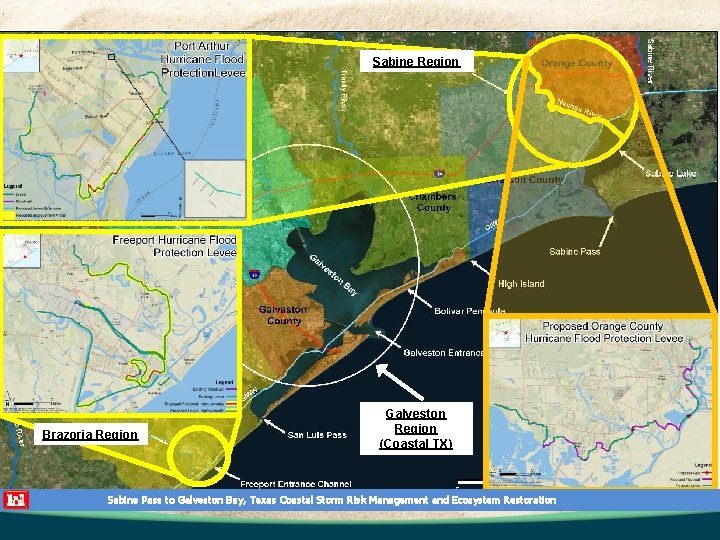
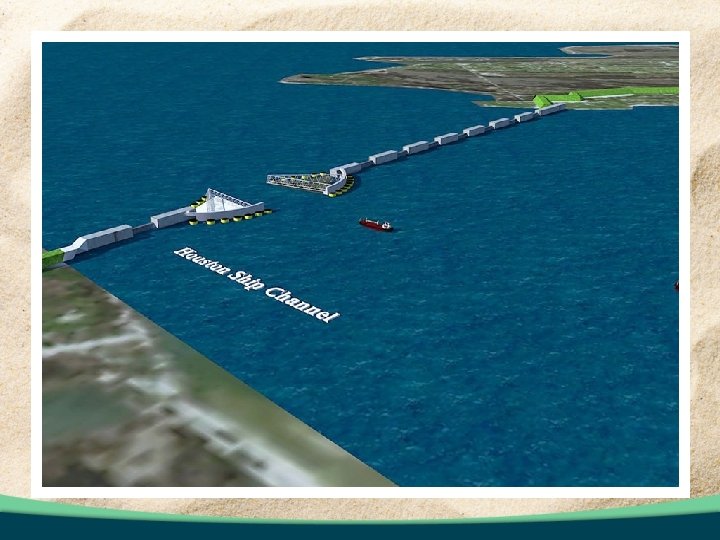
Sabine Region Brazoria Region Galveston Region (Coastal TX) Sabine Pass to Galveston Bay, Texas Coastal Storm Risk Management and Ecosystem Restoration
GLO COASTAL PLANNING STUDIES
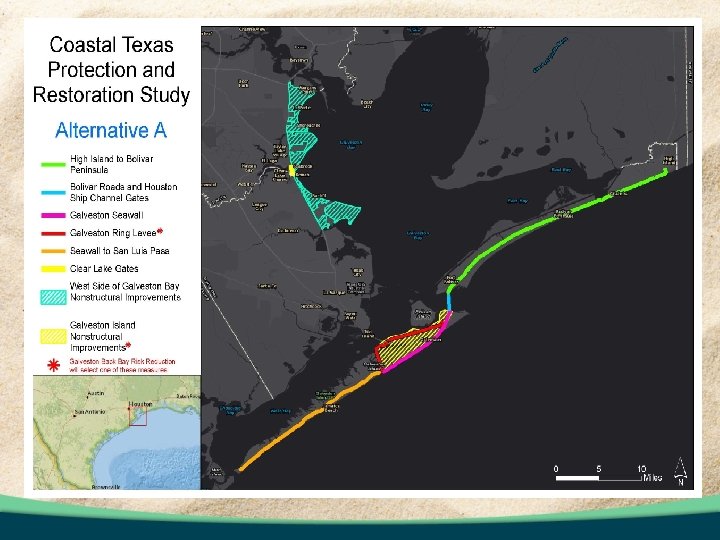
GLO COASTAL PLANNING STUDIES
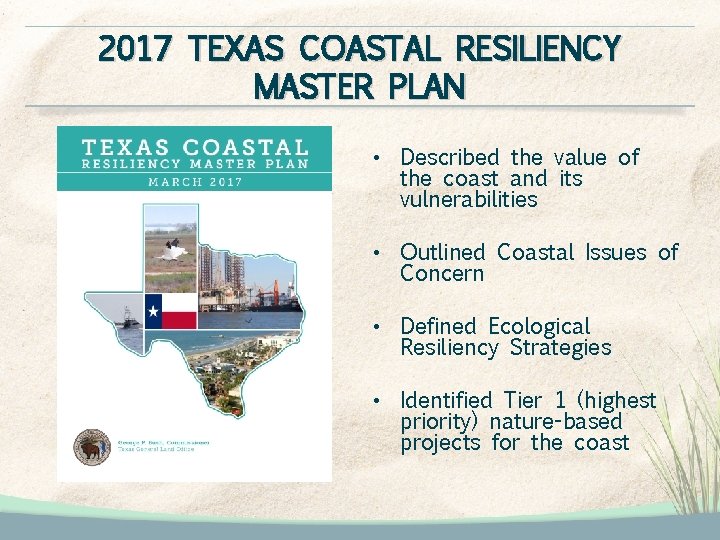
2017 TEXAS COASTAL RESILIENCY MASTER PLAN • Described the value of the coast and its vulnerabilities • Outlined Coastal Issues of Concern • Defined Ecological Resiliency Strategies • Identified Tier 1 (highest priority) nature-based projects for the coast
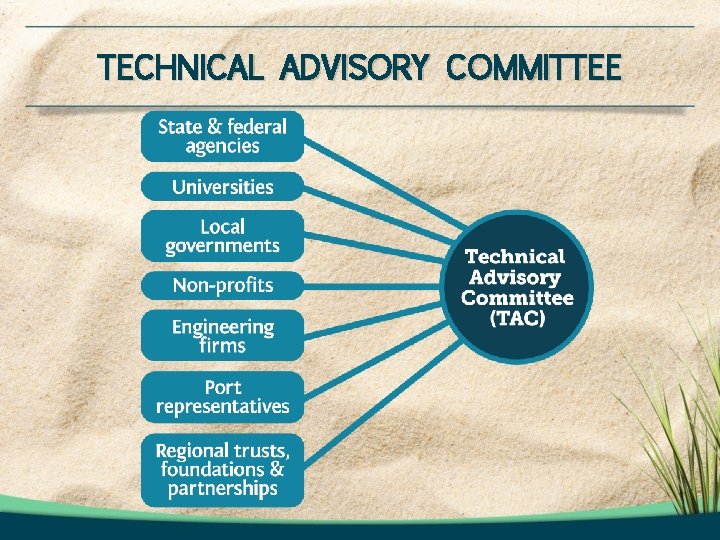
TECHNICAL ADVISORY COMMITTEE
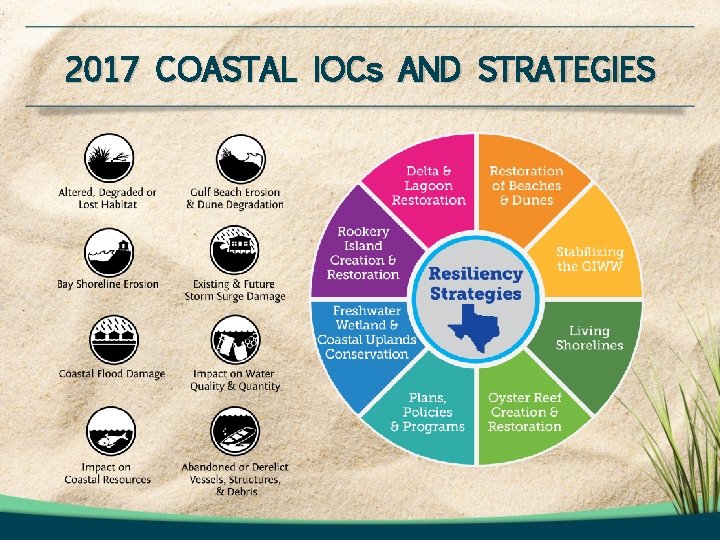
2017 COASTAL IOCs AND STRATEGIES
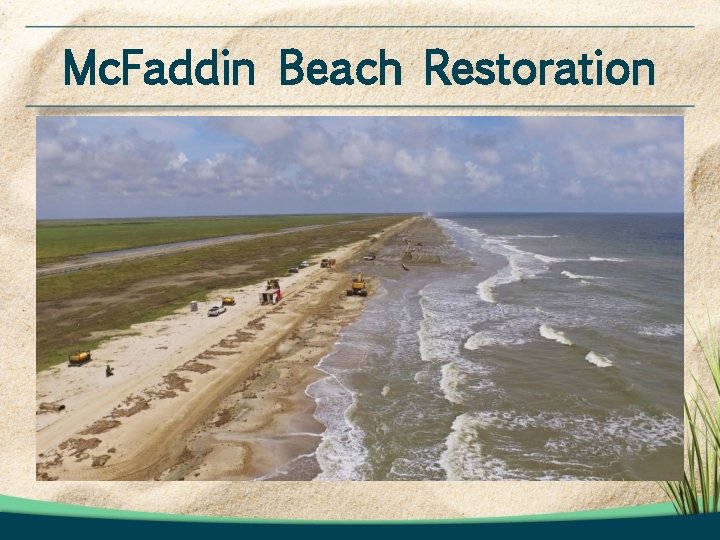
Mc. Faddin Beach Restoration
THE NEED FOR A 2019 TEXAS COASTAL RESILIENCY MASTER PLAN In support of the General Land Office’s legislative authority to restore, enhance and protect the state’s coastal natural resources, the Texas Coastal Resiliency Master Plan provides a framework for community, socio-economic, ecological and infrastructure protection from coastal hazards.
2019 TEXAS COASTAL RESILIENCY MASTER PLAN ENHANCEMENTS Identify opportunities for multi-faceted actions that utilize both nature-based and traditional infrastructure approaches. Enhance 2017 Plan Resiliency Strategies and Framework to incorporate storm surge suppression and infrastructure projects. Conduct gap analysis to identify actions that are needed where projects are not specifically proposed. Introduce physical modeling results to ensure most resilient suite of projects are identified. Define adaptive management processes for the 2019 Plan, proposed actions and projects.
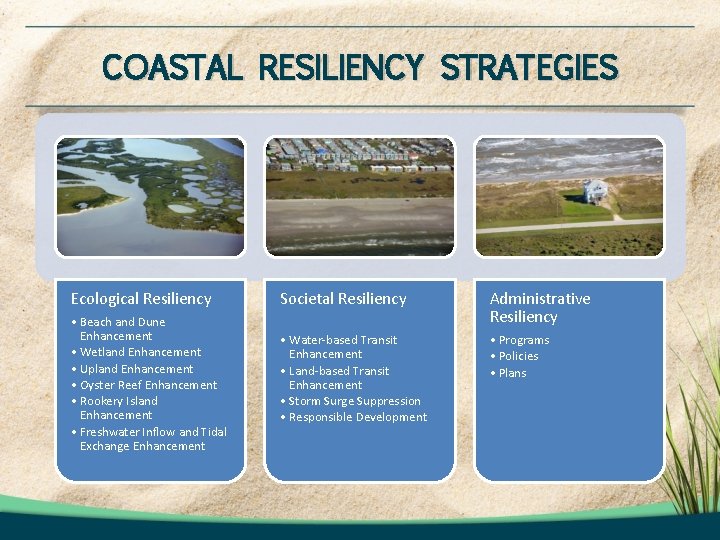
COASTAL RESILIENCY STRATEGIES Ecological Resiliency Societal Resiliency • Beach and Dune Enhancement • Wetland Enhancement • Upland Enhancement • Oyster Reef Enhancement • Rookery Island Enhancement • Freshwater Inflow and Tidal Exchange Enhancement Administrative Resiliency • Water-based Transit Enhancement • Land-based Transit Enhancement • Storm Surge Suppression • Responsible Development • Programs • Policies • Plans
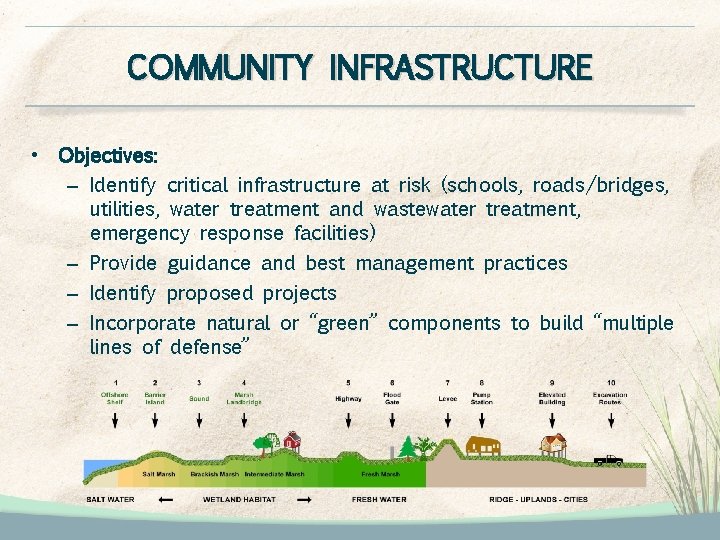
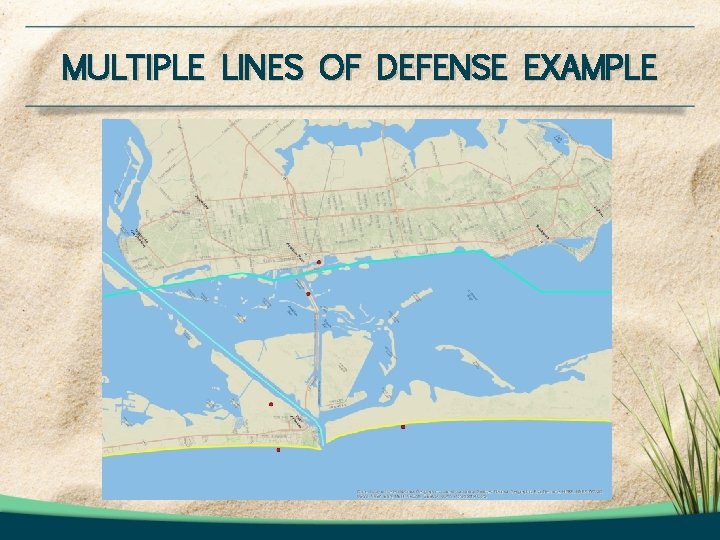
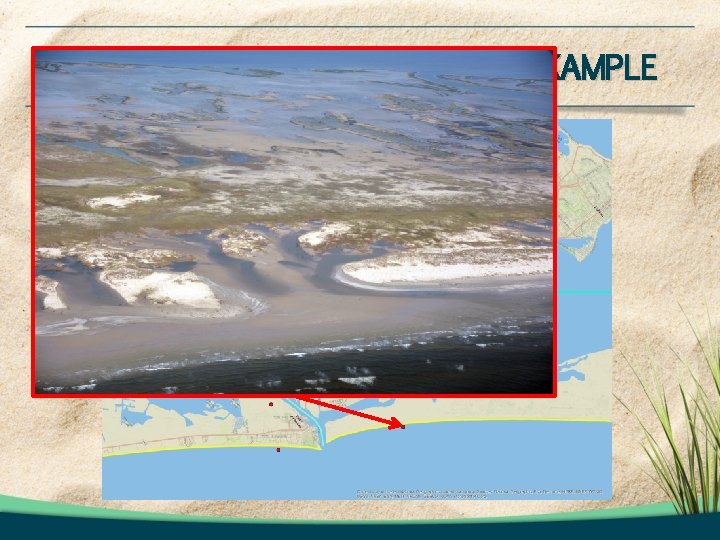
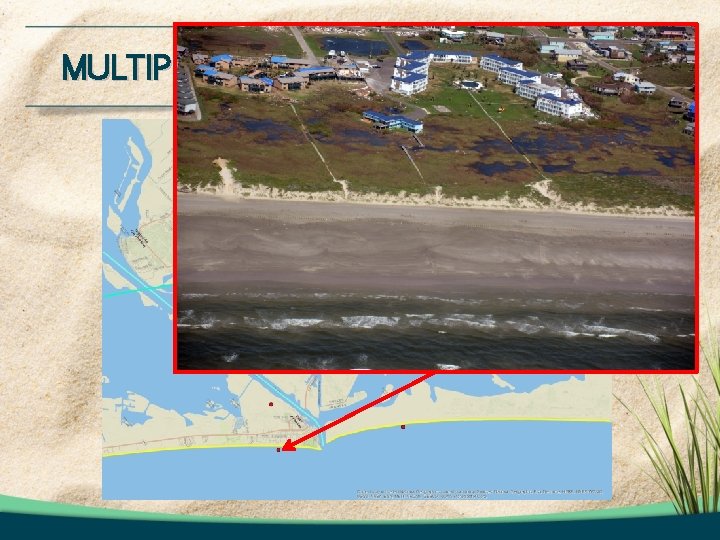
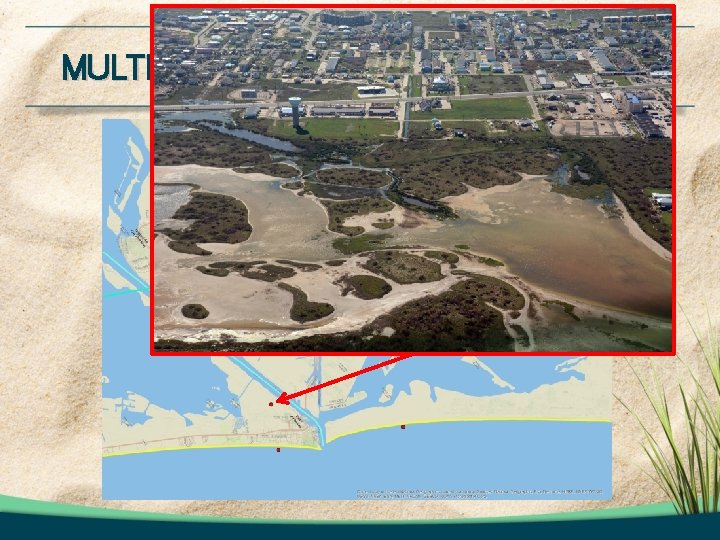
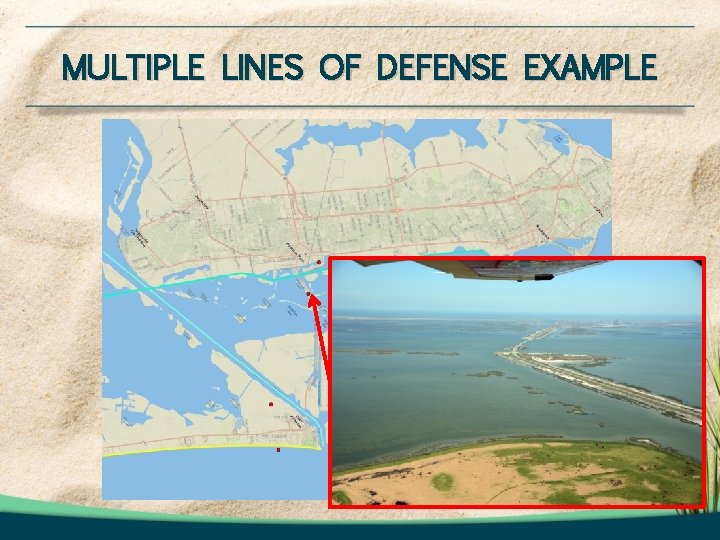
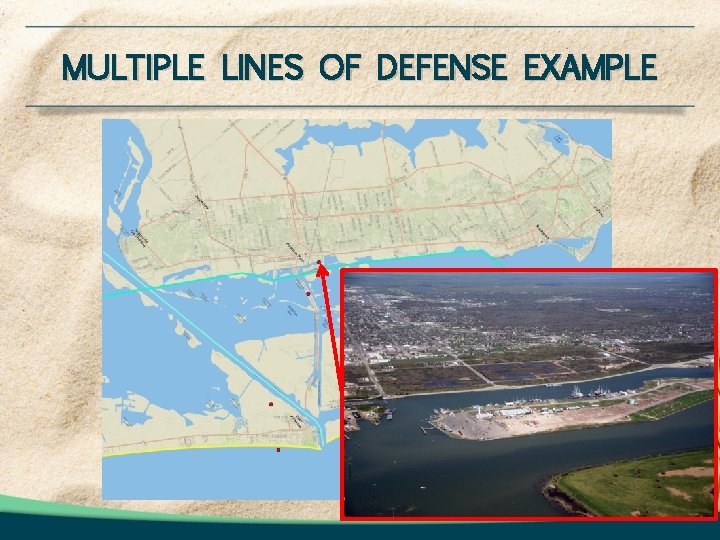
COMMUNITY INFRASTRUCTURE • Objectives: – Identify critical infrastructure at risk (schools, roads/bridges, utilities, water treatment and wastewater treatment, emergency response facilities) – Provide guidance and best management practices – Identify proposed projects – Incorporate natural or “green” components to build “multiple lines of defense”
MULTIPLE LINES OF DEFENSE EXAMPLE
MULTIPLE LINES OF DEFENSE EXAMPLE
MULTIPLE LINES OF DEFENSE EXAMPLE
MULTIPLE LINES OF DEFENSE EXAMPLE
MULTIPLE LINES OF DEFENSE EXAMPLE
MULTIPLE LINES OF DEFENSE EXAMPLE
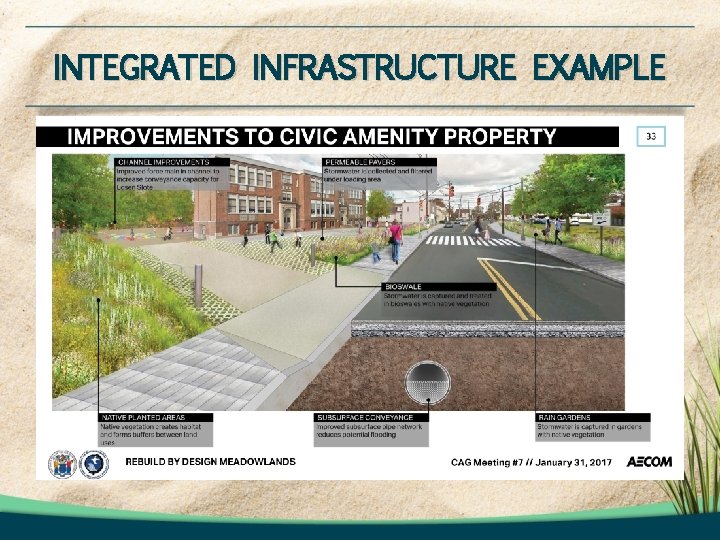
INTEGRATED INFRASTRUCTURE EXAMPLE
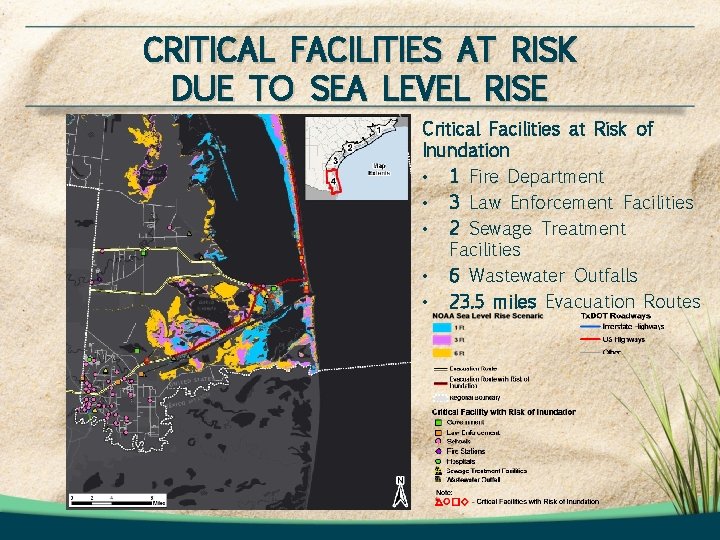
CRITICAL FACILITIES AT RISK DUE TO SEA LEVEL RISE Critical Facilities at Risk of Inundation • 1 Fire Department • 3 Law Enforcement Facilities • 2 Sewage Treatment Facilities • 6 Wastewater Outfalls • 23. 5 miles Evacuation Routes
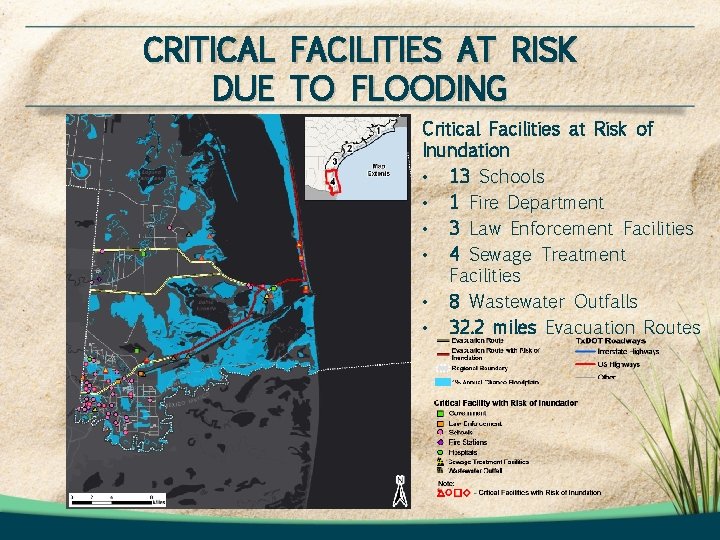
CRITICAL FACILITIES AT RISK DUE TO FLOODING Critical Facilities at Risk of Inundation • 13 Schools • 1 Fire Department • 3 Law Enforcement Facilities • 4 Sewage Treatment Facilities • 8 Wastewater Outfalls • 32. 2 miles Evacuation Routes
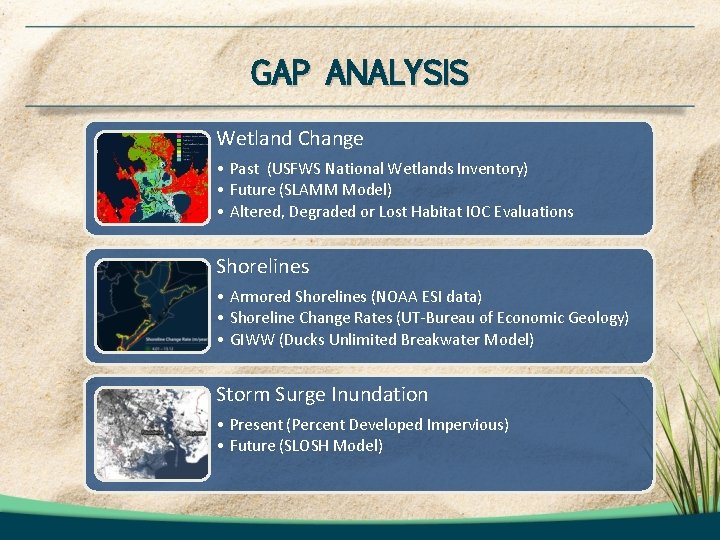
GAP ANALYSIS Wetland Change • Past (USFWS National Wetlands Inventory) • Future (SLAMM Model) • Altered, Degraded or Lost Habitat IOC Evaluations Shorelines • Armored Shorelines (NOAA ESI data) • Shoreline Change Rates (UT-Bureau of Economic Geology) • GIWW (Ducks Unlimited Breakwater Model) Storm Surge Inundation • Present (Percent Developed Impervious) • Future (SLOSH Model)
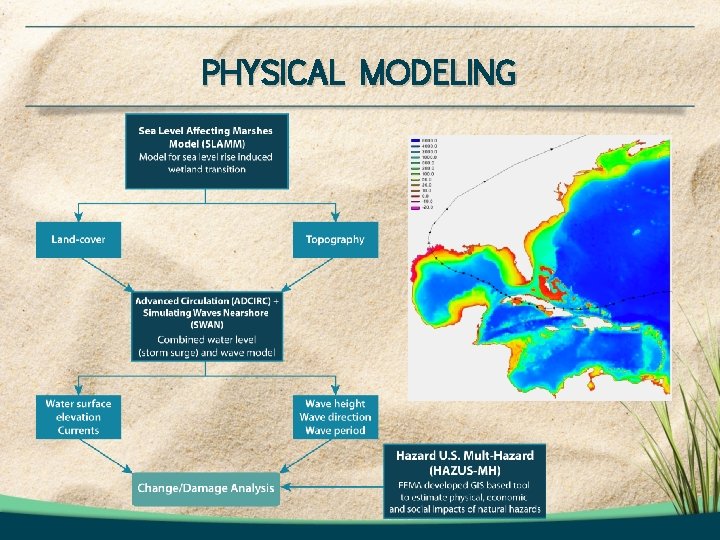
PHYSICAL MODELING
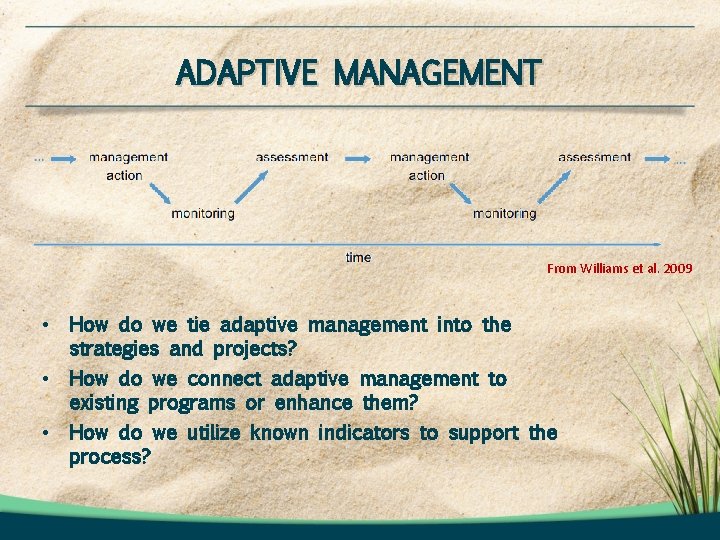
ADAPTIVE MANAGEMENT From Williams et al. 2009 • How do we tie adaptive management into the strategies and projects? • How do we connect adaptive management to existing programs or enhance them? • How do we utilize known indicators to support the process?
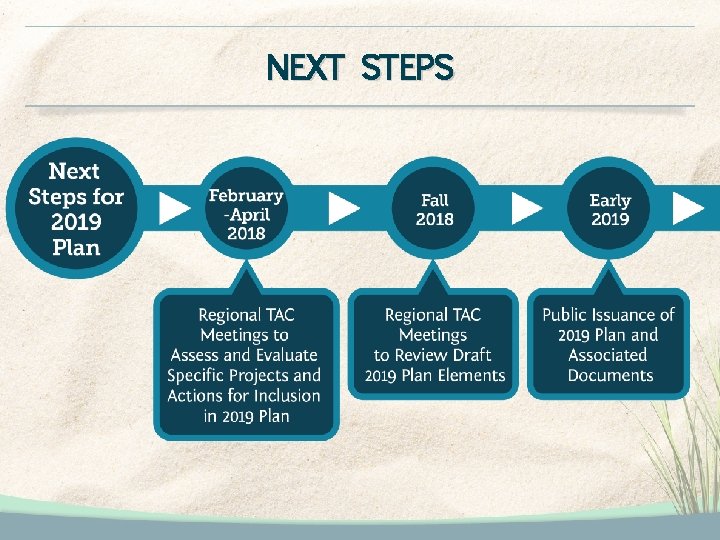
NEXT STEPS
THANK YOU! For questions please contact: Tony Williams Texas General Land Office Tony. Williams@glo. texas. gov (512) 463 -5055