New Strengths in the Curriculums Statistics Mike Camden
- Slides: 67
New Strengths in the Curriculum’s Statistics Mike Camden: Statistics New Zealand NZ Statistical Association: Education Committee mike. camden@stats. govt. nz Auckland Maths Assoc: PD Day: 25 Nov 2008 The views in here are Mike’s. 1
Aims: 1. To get us feeling even better about the Stats in The NZ Curriculum’s Maths and Stats: it is: commonsense, do-able, visual, fun, novel, useful, vital 2. To help ensure that our students will contribute to: health, sustainability, climate, justice … (from West Aust Mathematics Curriculum Framework) 3. To give bright ideas for next week, next year! 2
Contents: 1. The handout: a range of activities 2. New Strengths in Curriculum’s Statistics: Two big ideas: one woolly, one sharp Structures in the Statistics strand Structures in Cheese 3. An investigation with Paua (Item 1) the story activity 1 4. More investigations: multivariate situations: stories about Items 2 to 7 activities 2 to 12 (some of) 5. Conclusion: analysis => graphs 3
But first: two historical items: 1: from 1908: William Gosset discovers the Student t distribution in the Guinness Brewery, Dublin 2: from 1863: … 4
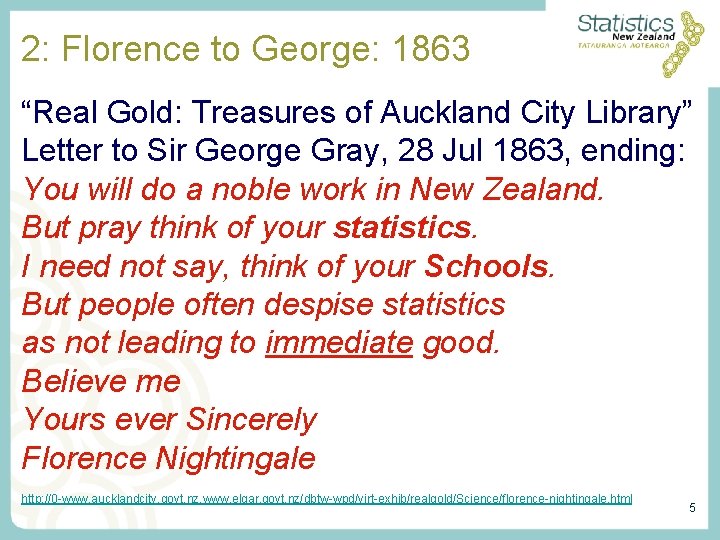
2: Florence to George: 1863 “Real Gold: Treasures of Auckland City Library” Letter to Sir George Gray, 28 Jul 1863, ending: You will do a noble work in New Zealand. But pray think of your statistics. I need not say, think of your Schools. But people often despise statistics as not leading to immediate good. Believe me Yours ever Sincerely Florence Nightingale http: //0 -www. aucklandcity. govt. nz. www. elgar. govt. nz/dbtw-wpd/virt-exhib/realgold/Science/florence-nightingale. html 5
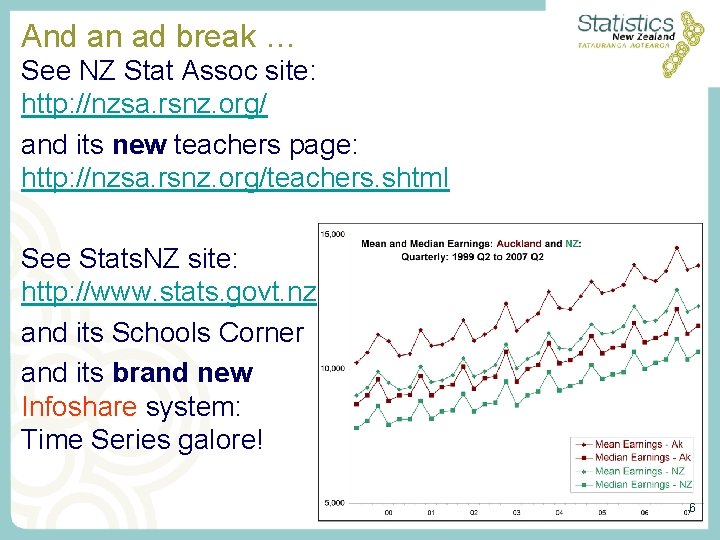
And an ad break … See NZ Stat Assoc site: http: //nzsa. rsnz. org/ and its new teachers page: http: //nzsa. rsnz. org/teachers. shtml See Stats. NZ site: http: //www. stats. govt. nz and its Schools Corner and its brand new Infoshare system: Time Series galore! 6
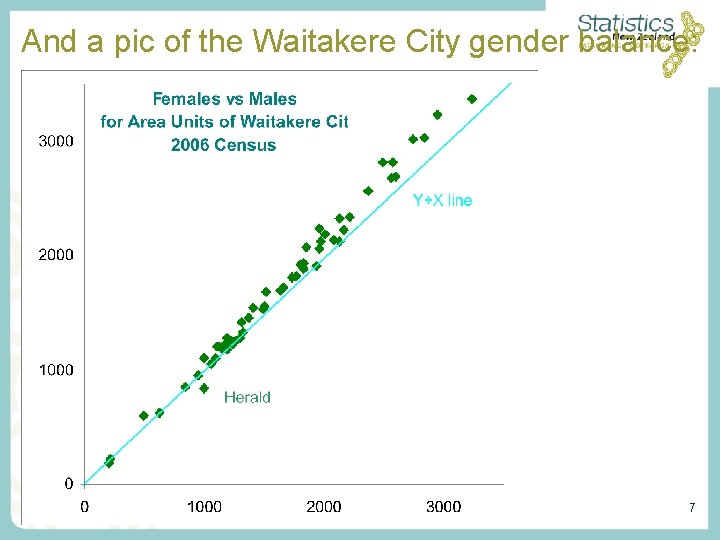
And a pic of the Waitakere City gender balance: 7
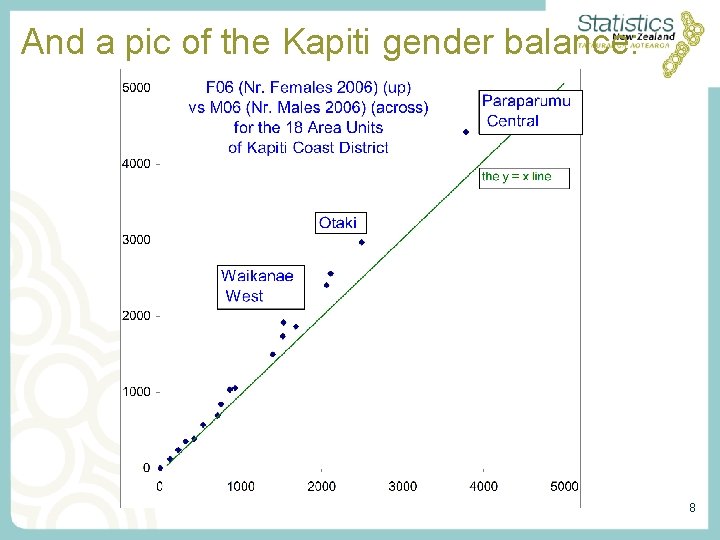
And a pic of the Kapiti gender balance: 8
Two big ideas: one woolly, one sharp The woolly big idea: two sides of maths The sharp big idea: the highly technical bit 9
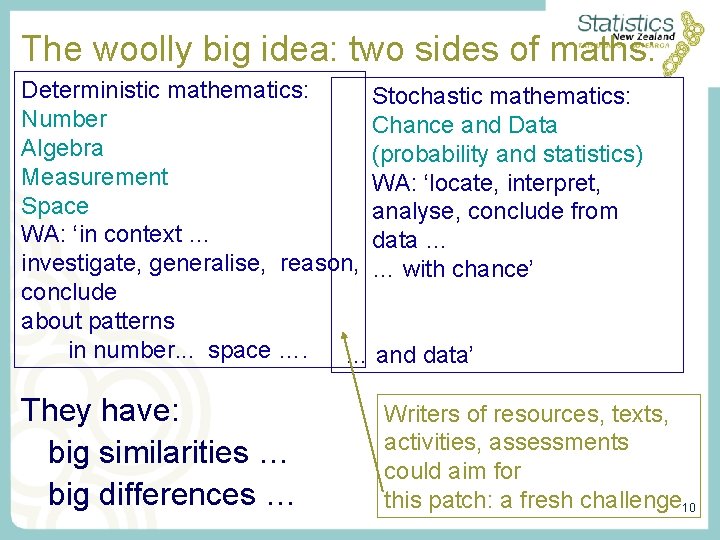
The woolly big idea: two sides of maths: Deterministic mathematics: Stochastic mathematics: Number Chance and Data Algebra (probability and statistics) Measurement WA: ‘locate, interpret, Space analyse, conclude from WA: ‘in context … data … investigate, generalise, reason, … with chance’ conclude about patterns in number. . . space …. … and data’ They have: big similarities … big differences … Writers of resources, texts, activities, assessments could aim for this patch: a fresh challenge 10
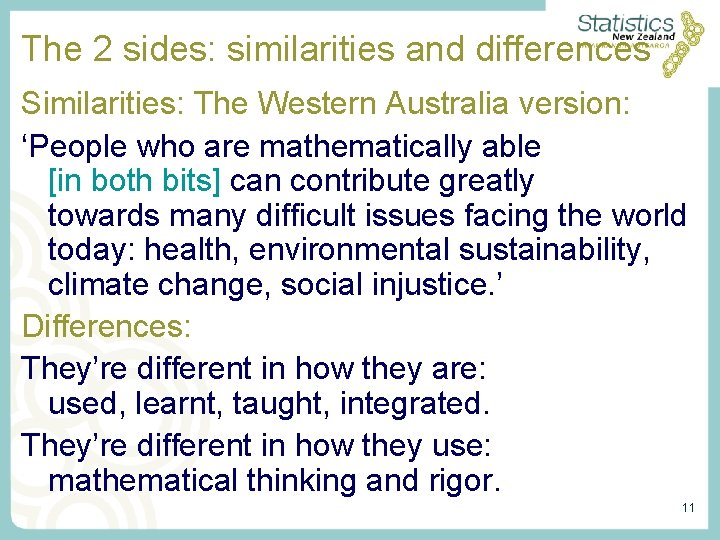
The 2 sides: similarities and differences Similarities: The Western Australia version: ‘People who are mathematically able [in both bits] can contribute greatly towards many difficult issues facing the world today: health, environmental sustainability, climate change, social injustice. ’ Differences: They’re different in how they are: used, learnt, taught, integrated. They’re different in how they use: mathematical thinking and rigor. 11
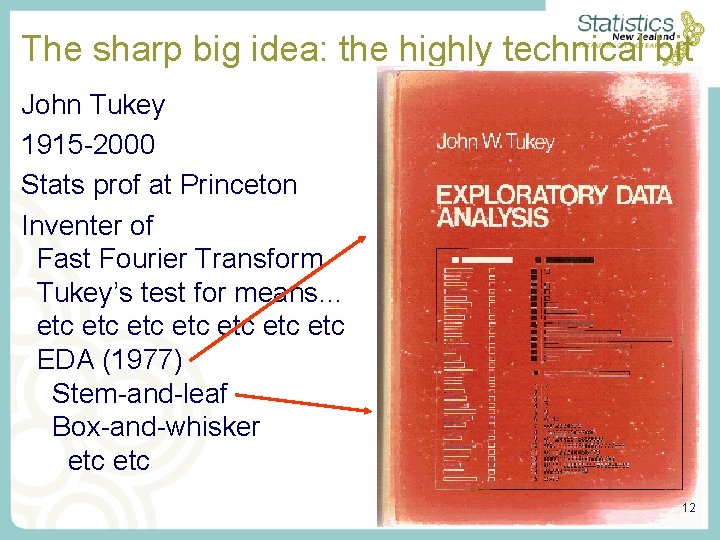
The sharp big idea: the highly technical bit John Tukey 1915 -2000 Stats prof at Princeton Inventer of Fast Fourier Transform Tukey’s test for means… etc etc EDA (1977) Stem-and-leaf Box-and-whisker etc 12
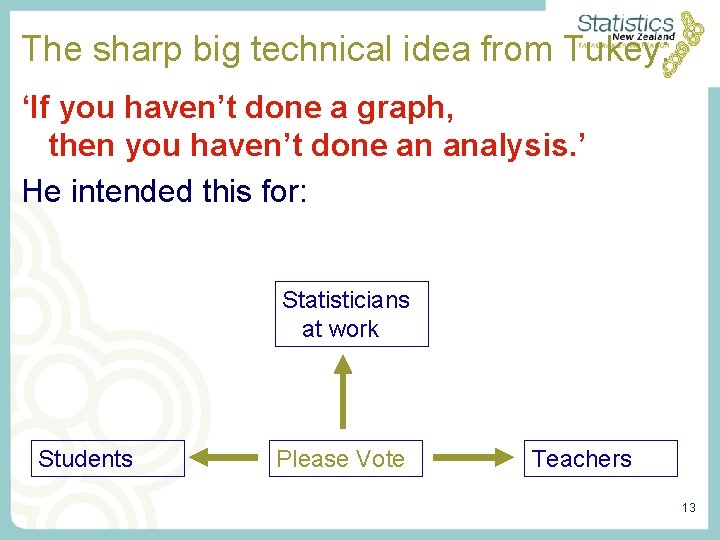
The sharp big technical idea from Tukey: ‘If you haven’t done a graph, then you haven’t done an analysis. ’ He intended this for: Statisticians at work Students Please Vote Teachers 13
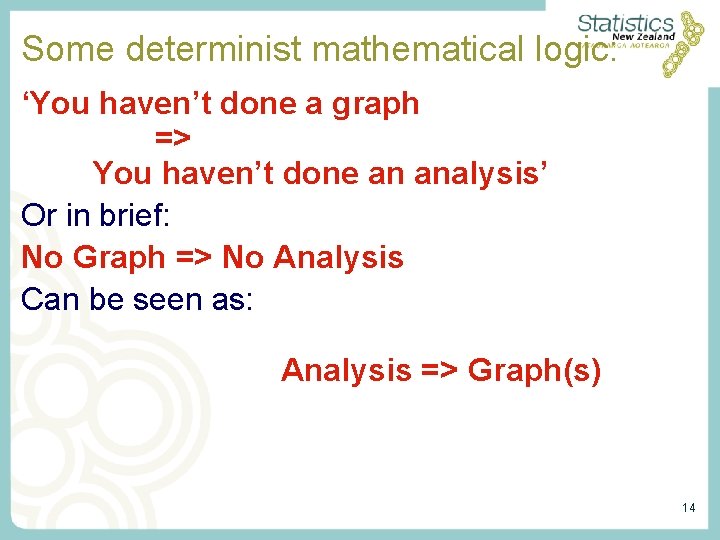
Some determinist mathematical logic: ‘You haven’t done a graph => You haven’t done an analysis’ Or in brief: No Graph => No Analysis Can be seen as: Analysis => Graph(s) 14
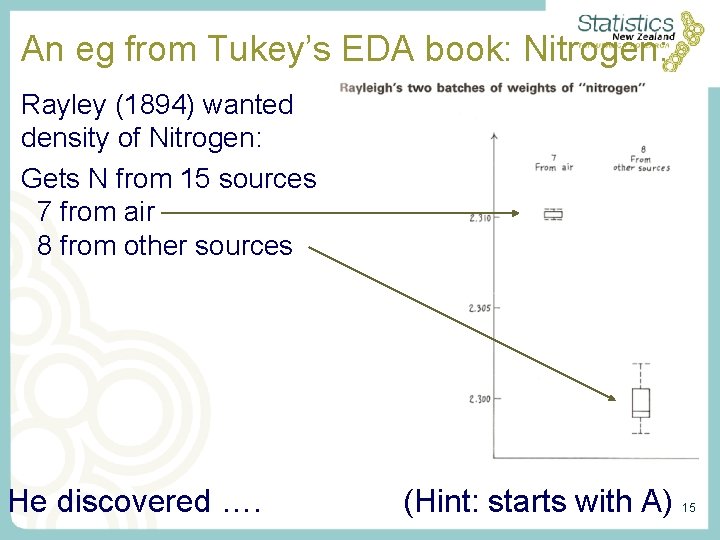
An eg from Tukey’s EDA book: Nitrogen: Rayley (1894) wanted density of Nitrogen: Gets N from 15 sources: 7 from air 8 from other sources He discovered …. (Hint: starts with A) 15
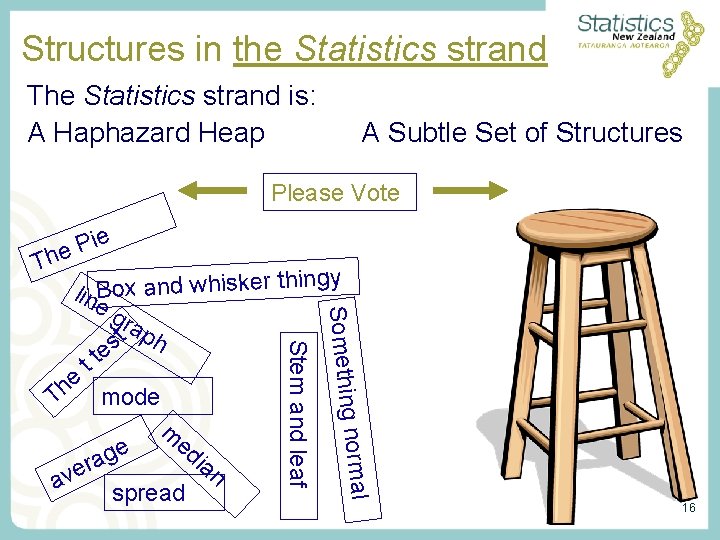
Structures in the Statistics strand The Statistics strand is: A Haphazard Heap A Subtle Set of Structures Please Vote T ie P he normal ed e g ia a r e av spread n g Somethin m Stem and leaf gy lin Box and whisker thin eg rap t h s e t t e Th mode 16
Most of MAWA votes for Structure … 17
The Waikato teachers vote: Photo: Harold Henderson 18
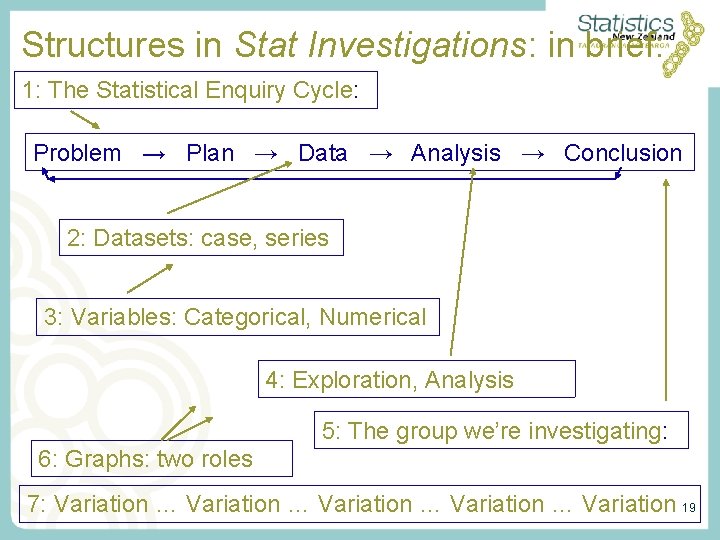
Structures in Stat Investigations: in brief: 1: The Statistical Enquiry Cycle: Problem → Plan → Data → Analysis → Conclusion 2: Datasets: case, series 3: Variables: Categorical, Numerical 4: Exploration, Analysis 5: The group we’re investigating: 6: Graphs: two roles 7: Variation … Variation 19
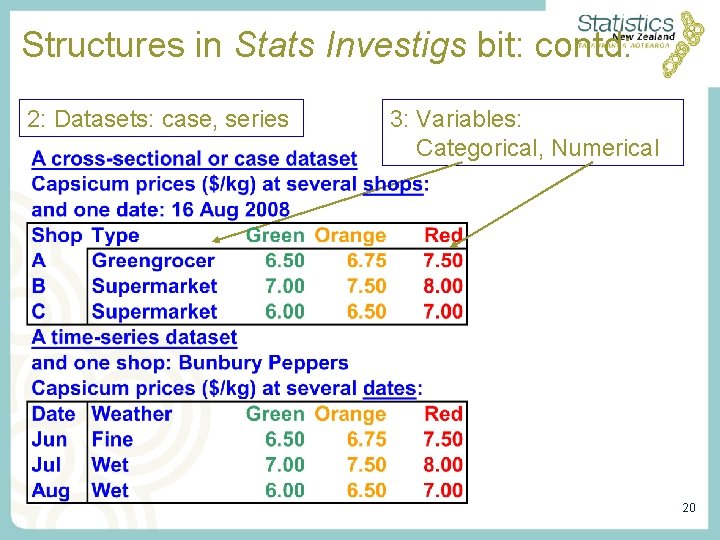
Structures in Stats Investigs bit: contd: 2: Datasets: case, series 3: Variables: Categorical, Numerical 20
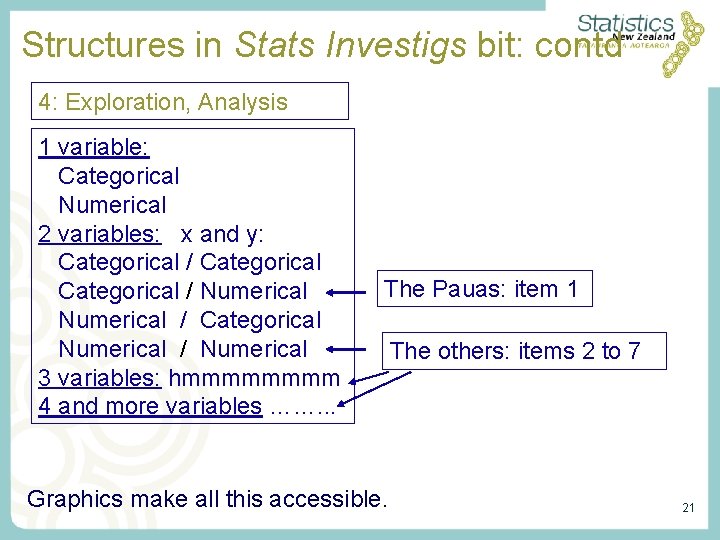
Structures in Stats Investigs bit: contd 4: Exploration, Analysis 1 variable: Categorical Numerical 2 variables: x and y: Categorical / Numerical / Categorical Numerical / Numerical 3 variables: hmmmm 4 and more variables ……. . . The Pauas: item 1 Graphics make all this accessible. The others: items 2 to 7 21
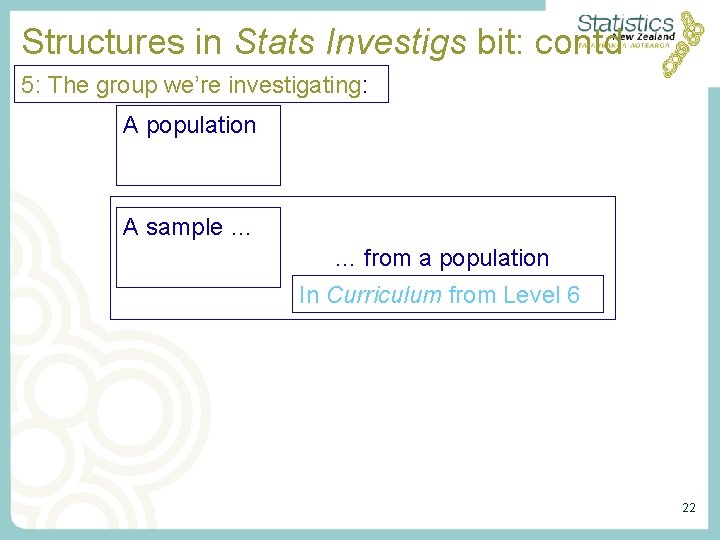
Structures in Stats Investigs bit: contd 5: The group we’re investigating: A population A sample … … from a population In Curriculum from Level 6 22
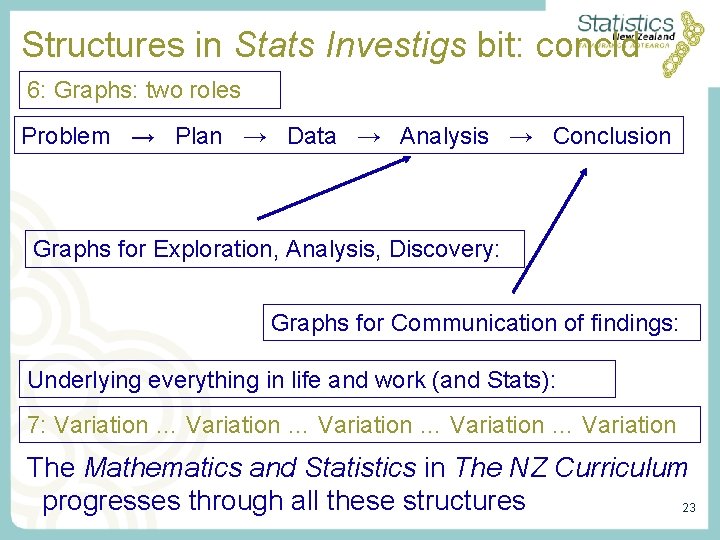
Structures in Stats Investigs bit: concld 6: Graphs: two roles Problem → Plan → Data → Analysis → Conclusion Graphs for Exploration, Analysis, Discovery: Graphs for Communication of findings: Underlying everything in life and work (and Stats): 7: Variation … Variation The Mathematics and Statistics in The NZ Curriculum progresses through all these structures 23
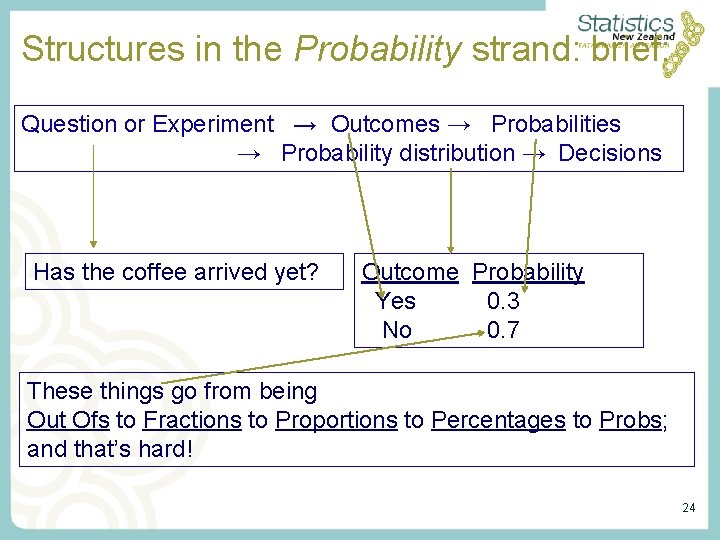
Structures in the Probability strand: brief: Question or Experiment → Outcomes → Probabilities → Probability distribution → Decisions Has the coffee arrived yet? Outcome Probability Yes 0. 3 No 0. 7 These things go from being Out Ofs to Fractions to Proportions to Percentages to Probs; and that’s hard! 24
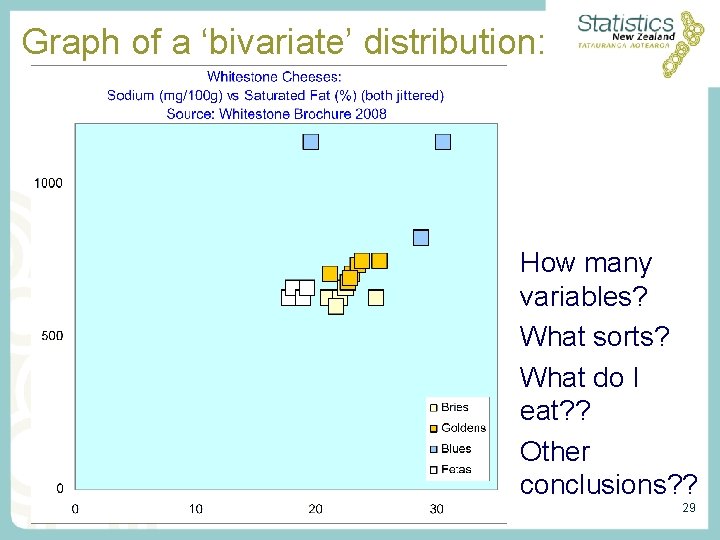
Structures in Cheese My problem: I like eating cheese I avoid saturated fat and salt What do I do? 25
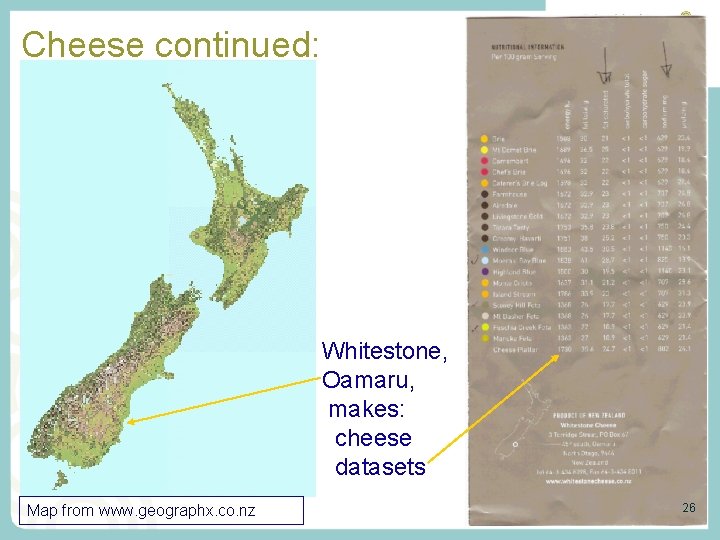
Cheese continued: Whitestone, Oamaru, makes: cheese datasets Map from www. geographx. co. nz 26
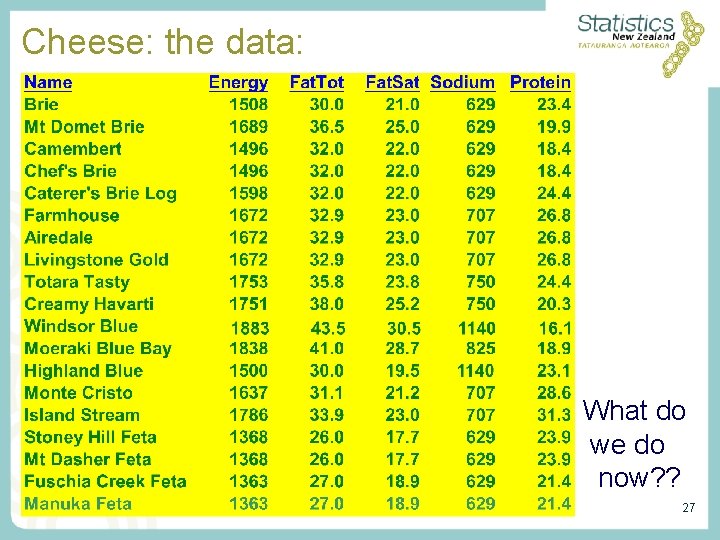
Cheese: the data: What do we do now? ? 27
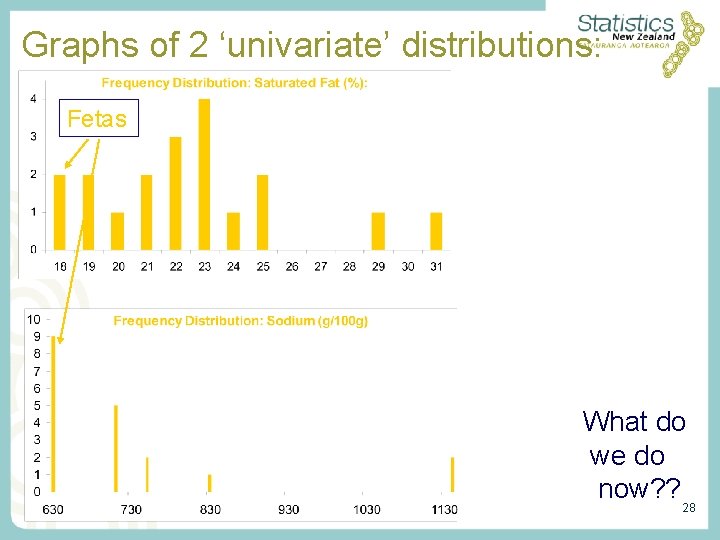
Graphs of 2 ‘univariate’ distributions: Fetas What do we do now? ? 28
Graph of a ‘bivariate’ distribution: How many variables? What sorts? What do I eat? ? Other conclusions? ? 29
An investigation with Paua (Item 1) The story The activity And a mini-version: … 30
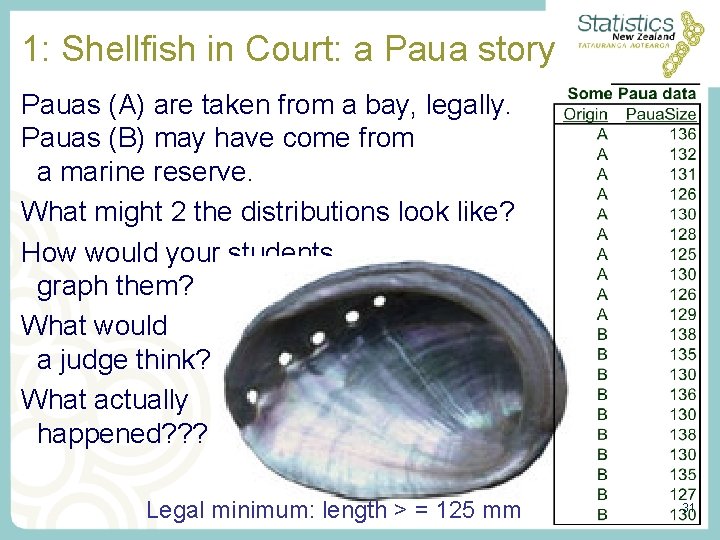
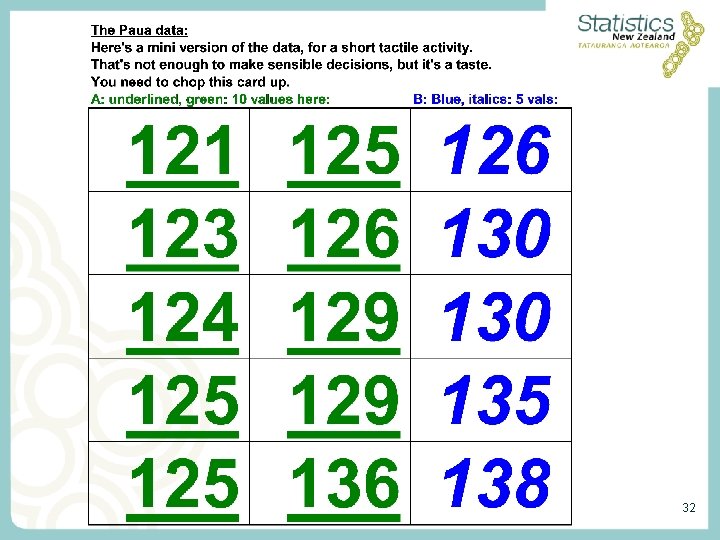
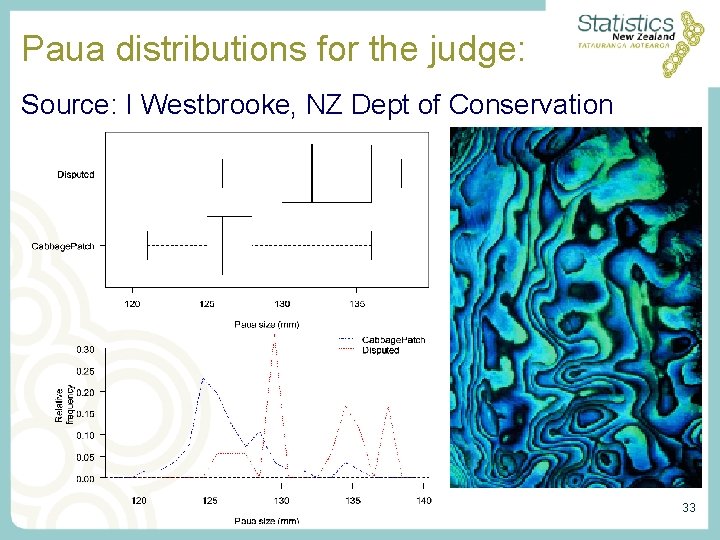
1: Shellfish in Court: a Paua story Pauas (A) are taken from a bay, legally. Pauas (B) may have come from a marine reserve. What might 2 the distributions look like? How would your students graph them? What would a judge think? What actually happened? ? ? Legal minimum: length > = 125 mm 31
32
Paua distributions for the judge: Source: I Westbrooke, NZ Dept of Conservation 33
More investigations: multivariate situations: Stories about Items 2, 3, 5, 6, 7 Activities on these 34
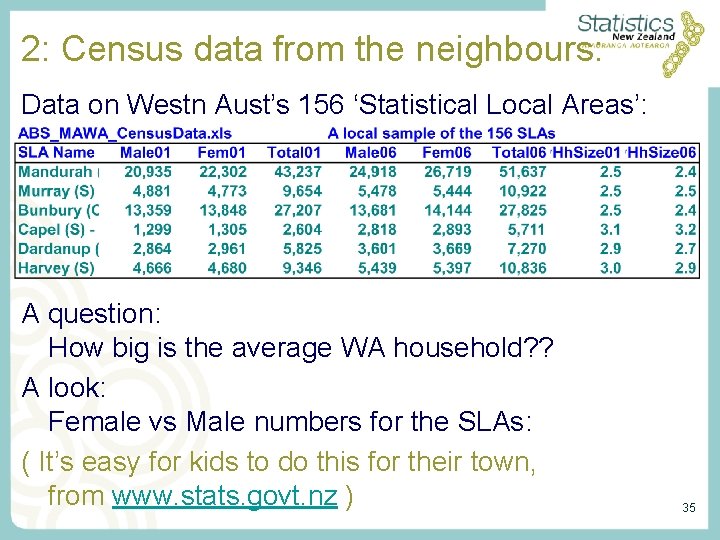
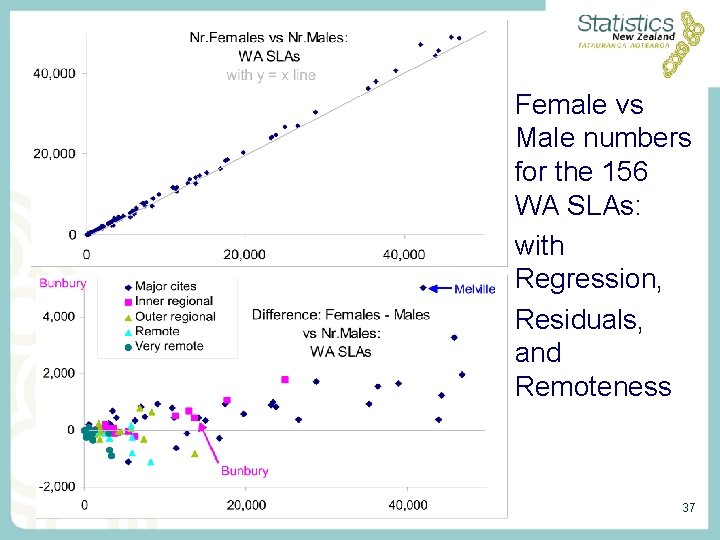
2: Census data from the neighbours: Data on Westn Aust’s 156 ‘Statistical Local Areas’: A question: How big is the average WA household? ? A look: Female vs Male numbers for the SLAs: ( It’s easy for kids to do this for their town, from www. stats. govt. nz ) 35
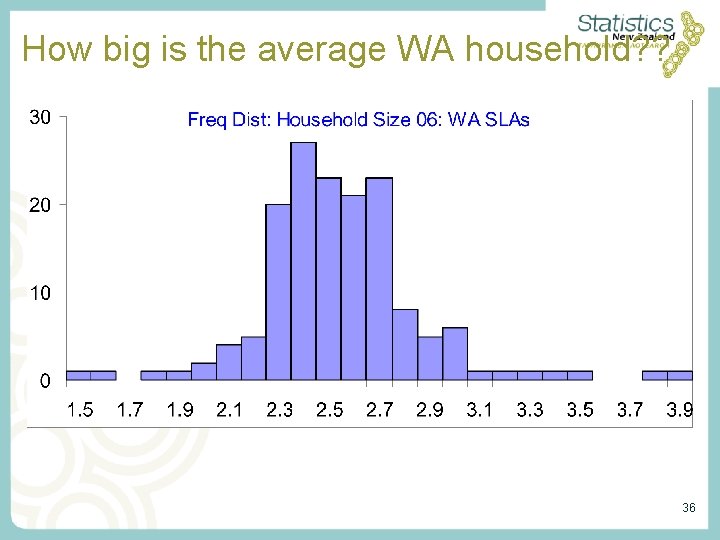
How big is the average WA household? ? 36
Female vs Male numbers for the 156 WA SLAs: with Regression, Residuals, and Remoteness 37
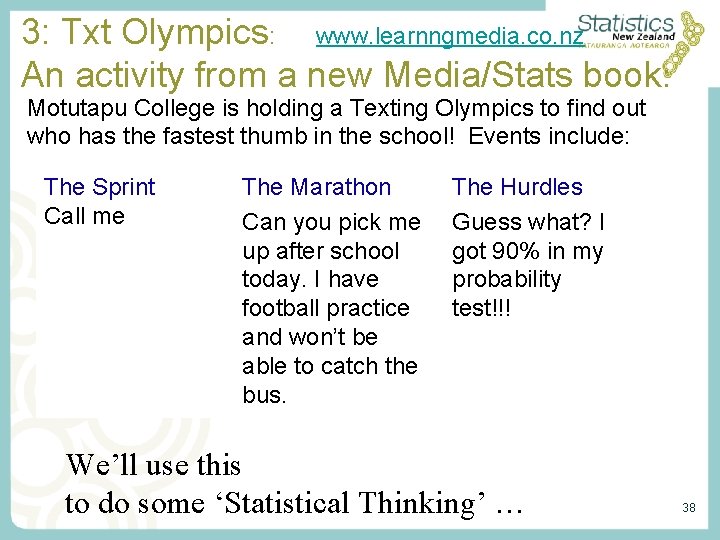
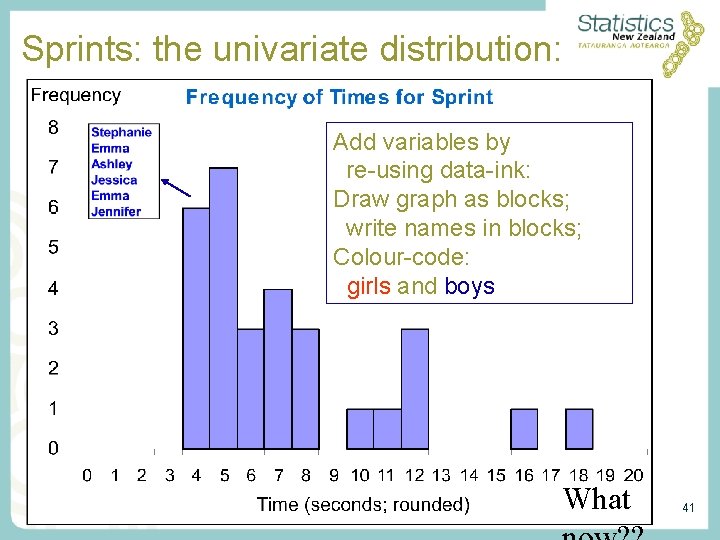
3: Txt Olympics: www. learnngmedia. co. nz An activity from a new Media/Stats book: Motutapu College is holding a Texting Olympics to find out who has the fastest thumb in the school! Events include: The Sprint Call me The Marathon Can you pick me up after school today. I have football practice and won’t be able to catch the bus. The Hurdles Guess what? I got 90% in my probability test!!! • We’ll use this to do some ‘Statistical Thinking’ … 38
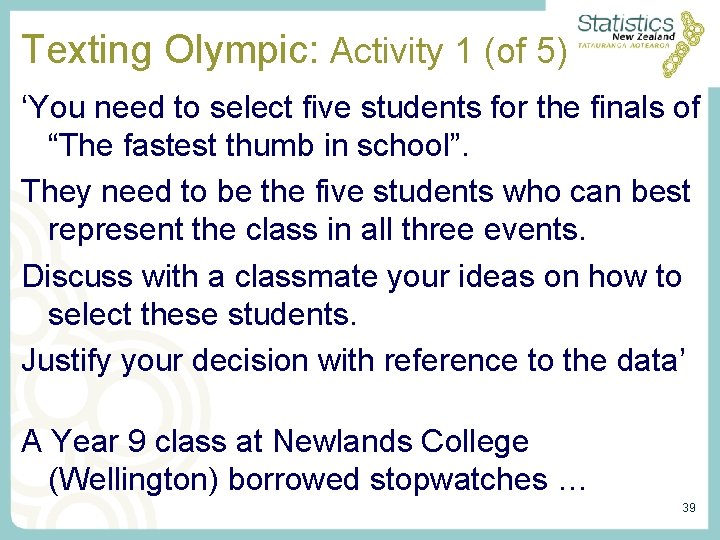
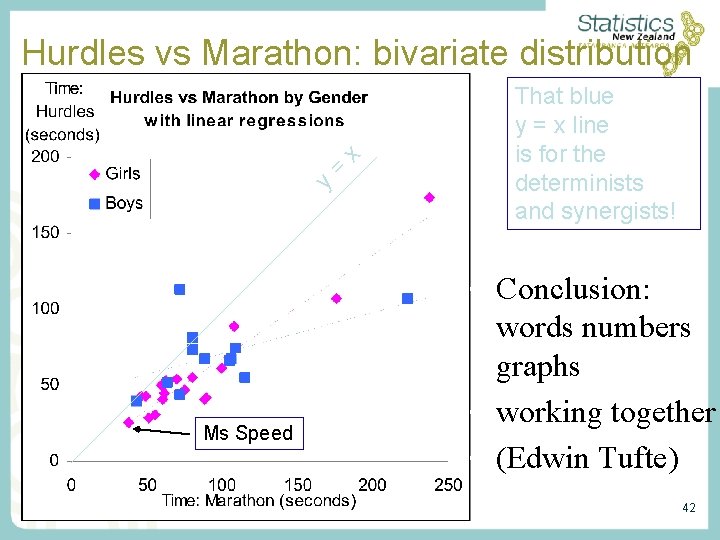
Texting Olympic: Activity 1 (of 5) ‘You need to select five students for the finals of “The fastest thumb in school”. They need to be the five students who can best represent the class in all three events. Discuss with a classmate your ideas on how to select these students. Justify your decision with reference to the data’ A Year 9 class at Newlands College (Wellington) borrowed stopwatches … 39
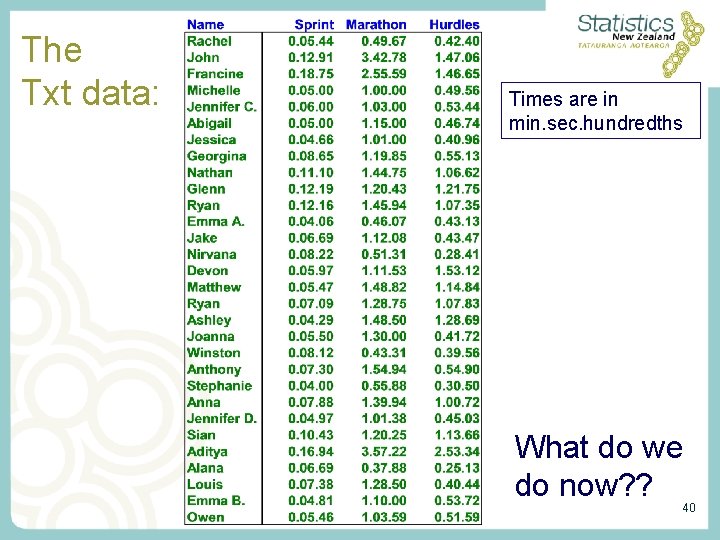
The Txt data: Times are in min. sec. hundredths What do we do now? ? 40
Sprints: the univariate distribution: Add variables by re-using data-ink: Draw graph as blocks; write names in blocks; Colour-code: girls and boys • What 41
y = x Hurdles vs Marathon: bivariate distribution Ms Speed That blue y = x line is for the determinists and synergists! • Conclusion: words numbers graphs • working together • (Edwin Tufte) 42
4: Cheese: Done! Data Graphics for Exploration, Communication: 43
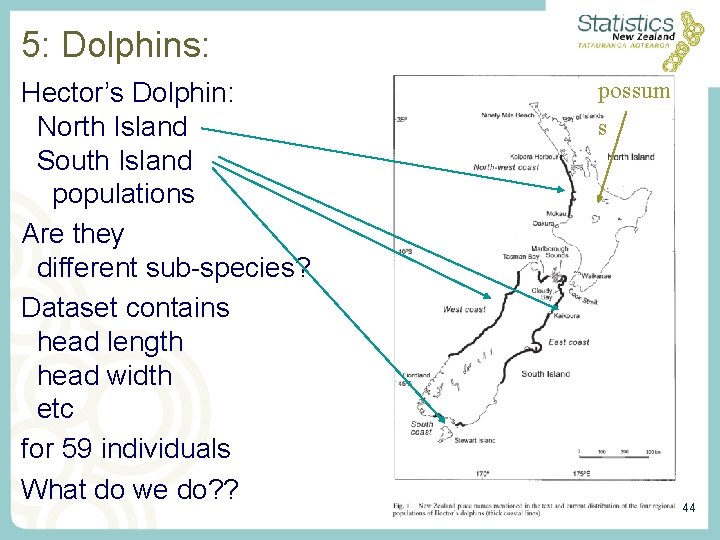
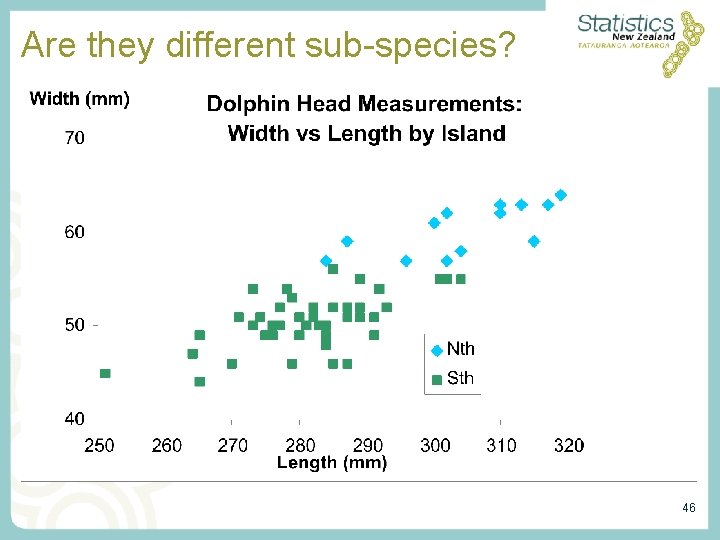
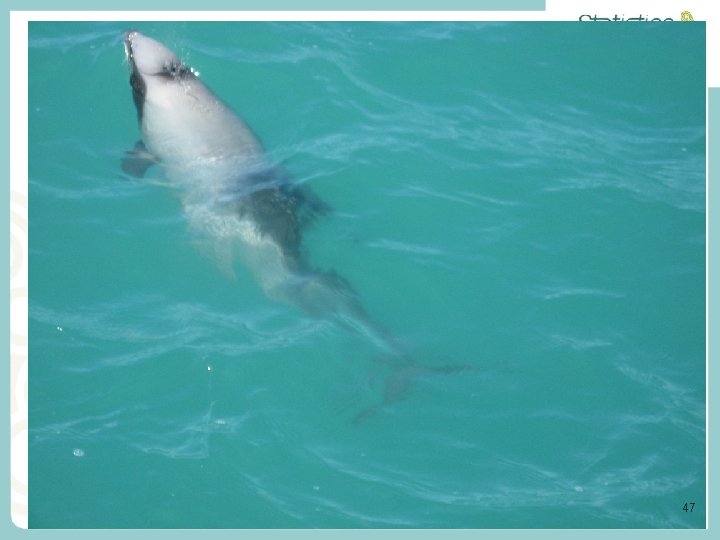
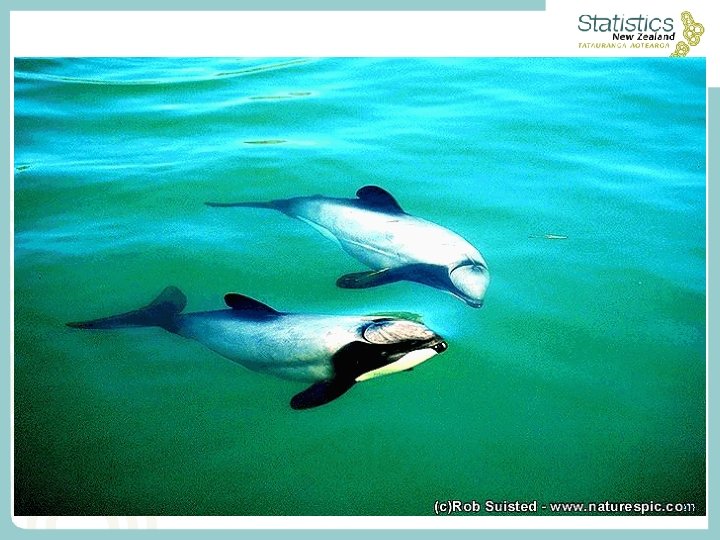
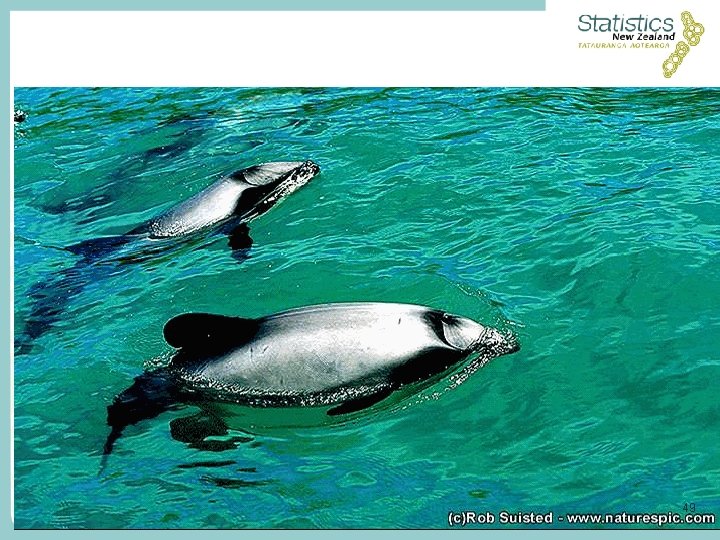
5: Dolphins: Hector’s Dolphin: North Island South Island populations Are they different sub-species? Dataset contains head length head width etc for 59 individuals What do we do? ? • possum s 44
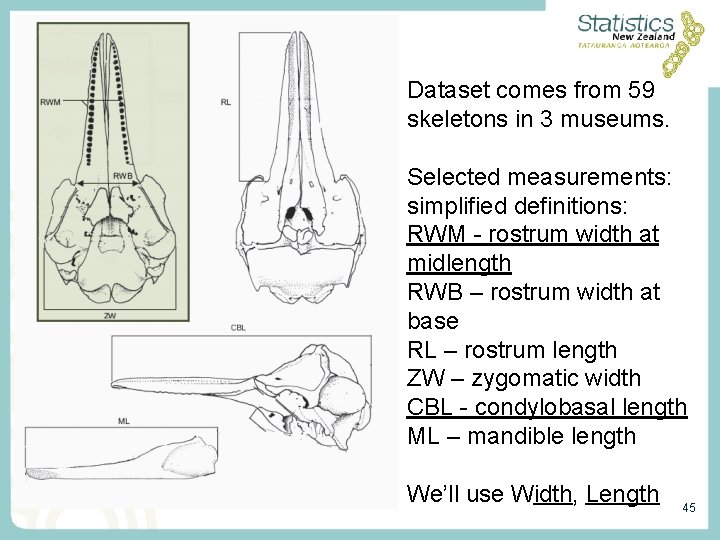
Dataset comes from 59 skeletons in 3 museums. Selected measurements: simplified definitions: RWM - rostrum width at midlength RWB – rostrum width at base RL – rostrum length ZW – zygomatic width CBL - condylobasal length ML – mandible length We’ll use Width, Length 45
Are they different sub-species? 46
47
48
49
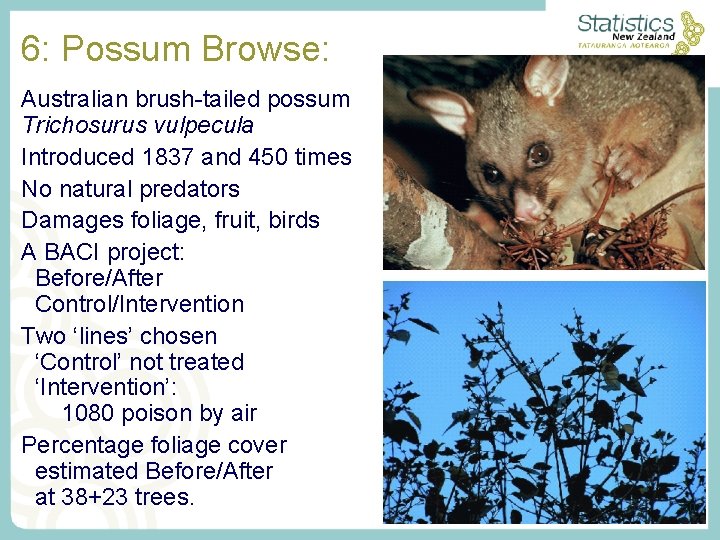
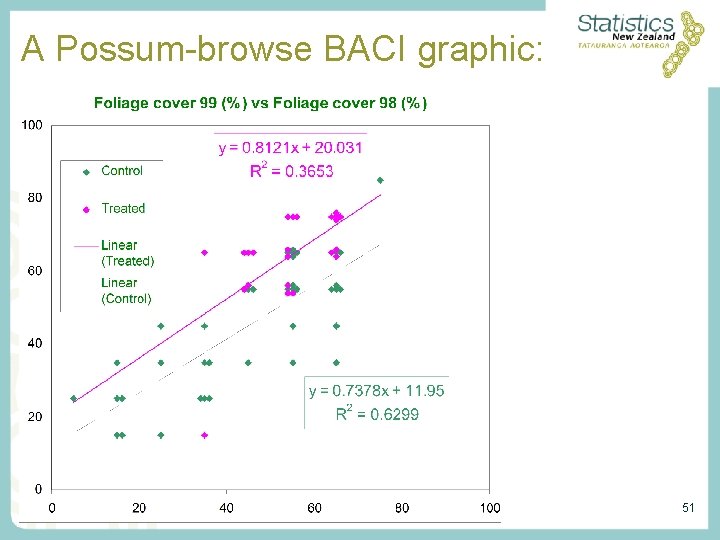
6: Possum Browse: Australian brush-tailed possum Trichosurus vulpecula Introduced 1837 and 450 times No natural predators Damages foliage, fruit, birds A BACI project: Before/After Control/Intervention Two ‘lines’ chosen ‘Control’ not treated ‘Intervention’: 1080 poison by air Percentage foliage cover estimated Before/After at 38+23 trees. 50
A Possum-browse BACI graphic: 51
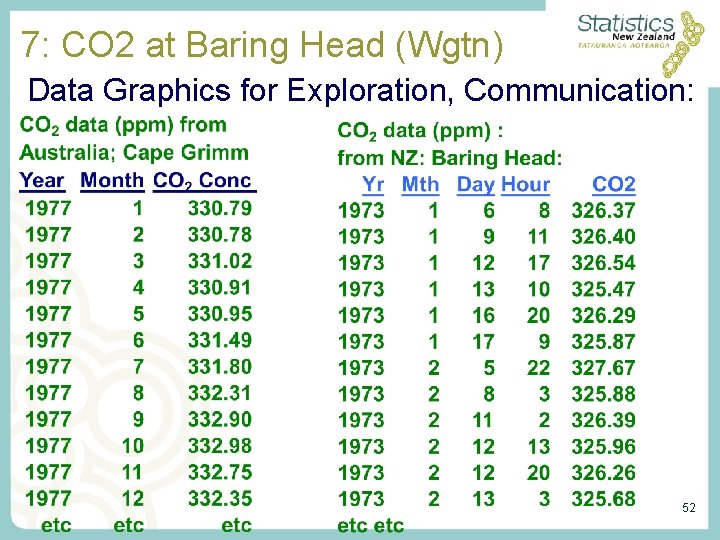
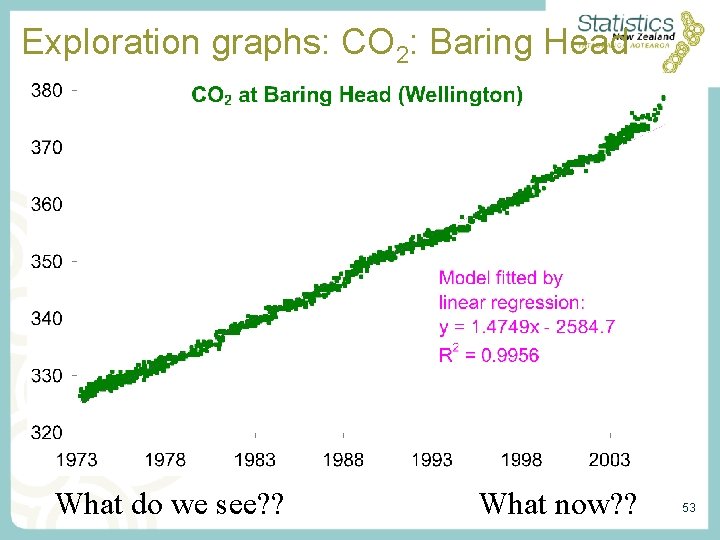
7: CO 2 at Baring Head (Wgtn) Data Graphics for Exploration, Communication: 52
Exploration graphs: CO 2: Baring Head • What do we see? ? What now? ? 53
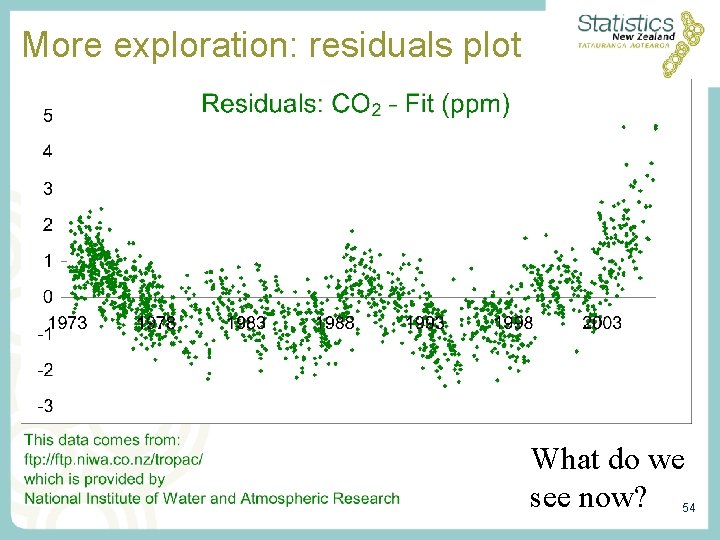
More exploration: residuals plot • What do we see now? 54
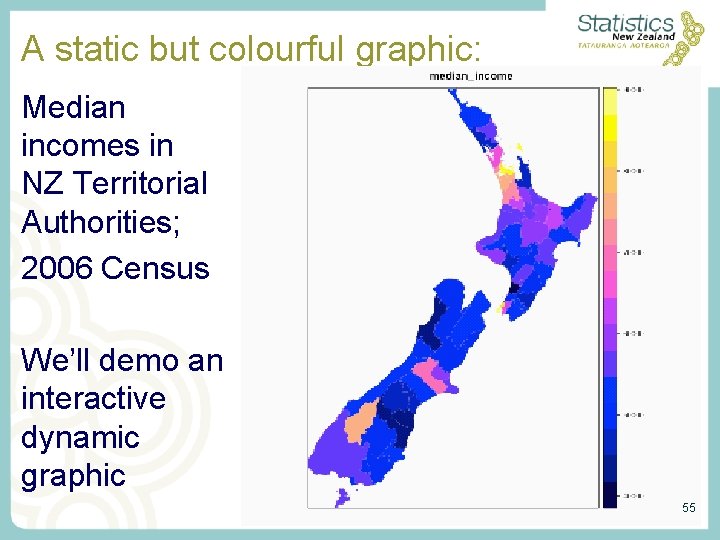
A static but colourful graphic: Median incomes in NZ Territorial Authorities; 2006 Census We’ll demo an interactive dynamic graphic 55
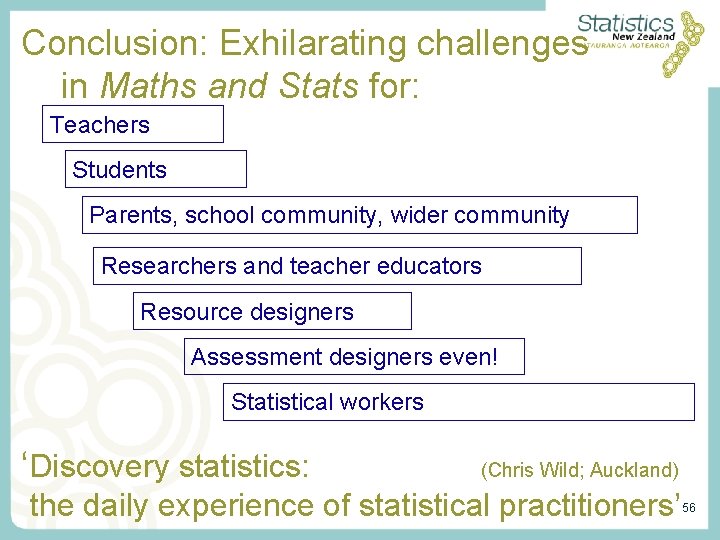
Conclusion: Exhilarating challenges in Maths and Stats for: Teachers Students Parents, school community, wider community Researchers and teacher educators Resource designers Assessment designers even! Statistical workers ‘Discovery statistics: (Chris Wild; Auckland) the daily experience of statistical practitioners’ 56
Links 1: Australia ABS site: for teachers www. abs. gov. au/teachers and for students www. abs. gov. au/students Census at School: www. abs. gov. au/websitedbs/cashome. NSF Fuel use: http: //www. greenhouse. gov. au/cgi-bin/transport/fuelg Fishing in the bay: http: //blogs. mbs. edu/fishing-in-the-bay/ CO 2 data and more, from Aust: http: //www. environment. gov. au/soe/2006/publications OZCOTS 2008: http: //silmaril. math. sci. qut. edu. au/ozcots 2008/ 57
Links 2: NZ Curriculum and some resources: http: //nzcurriculum. tki. org. nz/ http: //www. nzmaths. co. nz/ http: //www. nzamt. org. nz/ http: //www. censusatschool. org. nz/ www. stats. govt. nz http: //www. learningmedia. co. nz/ Computer assisted statistics teaching: http: //cast. massey. ac. nz/ CO 2 data, and more, from NIWA: ftp: //ftp. niwa. co. nz/tropac/ 58
Links 3: NZ contd: Hector’s and Maui’s Dolphins http: //www. rsnz. org/publish/jrsnz/2002/036. php Netball: http: //www. netballnz. co. nz/ Cheese: https: //www. whitestonecheese. co. nz DVD/CD sets with video and data on about 8 topics; 2 sets, small fee; from jharraway@maths. otago. ac. nz Florence Nightingale: http: //0 -www. aucklandcity. govt. nz. www. elgar. govt. nz/dbtwwpd/virt-exhib/realgold/Science/florence-nightingale. html See NZSA site: http: //nzsa. rsnz. org/ And its new teachers page http: //nzsa. rsnz. org/teachers. shtml 59
Links 4: Internat Assoc for Stat Education http: //www. stat. auckland. ac. nz/~iase/ ICME 11, Monterrey, Mexico. July 2008 ICOTS 8, Ljubljana, Slovenia July 2010 Statistics Education Research Journal (SERJ) International Statistical Literacy Project (ISLP) ICMI/IASE Study: Statistics Education in School 60
Links 5: Elsewhere: David Mumford: The Age of Stochasticity: www. dam. brown. edu/people/mumford Data and Story Library: http: //lib. stat. cmu. edu/DASL/ EDA: with several free software links: en. wikipedia. org/wiki/Exploratory_data_analysis E Tufte: http: //www. edwardtufte. com/tufte/ The GAISE project, USA: http: //www. amstat. org/education/gaise/ 61
Links 6: Elsewhere contd: Gallery of Data Visualization The Best and Worst of Statistical Graphics http: //www. math. yorku. ca/SCS/Gallery/ R: a language and environment for statistical computing and graphics. http: //www. r-project. org/ R Commander: a basic-stats GUI for R: http: //cran. rproject. org/web/packages/Rcmdr/index. html Statistica, with a free e text: http: //www. statsoft. com/ 62
Links 7: Data Visualisation etc: Recommended for visualisations: http: //services. alphaworks. ibm. com/manyeyes/ home http: //www. gapminder. org/downloads/applicati ons/ http: //www. dur. ac. uk/smart. centre/ https: //www. geoda. uiuc. edu/ http: //www. worldmapper. org/ 63
Links 8: UK’s Office of National Stats: Some of the interactive objects on ONS site: www. statistics. gov. uk/economicactivity/index 2. h tml http: //www. statistics. gov. uk/PIC/index. html http: //www. statistics. gov. uk/populationestimates /svg_pyramid/default. htm You need to install the SVG software, which is available in the last link. 64
Links 9: Links of Links from Pip: For links from conferences http: //aucksecmaths. wikispaces. com/Mexico For a few others http: //nzstatsedn. wikispaces. com/Useful+websites /Information for Auckland Secondary Maths Teachers http: //aucksecmaths. wikispaces. com/ http: //www. nzqa. govt. nz/ncea/resources/maths/index. html 65
Links 10: OECD e. Xplorer : New platform: visualising & analysing stats OECD has launched a powerful, interactive tool for visualising and analysing regional statistics. OECD e. Xplorer combines maps and other graphics via the Internet, to increase the user’s understanding of regional differences and structures across and within OECD countries. To try out the regional maps and statistics using OECD e. Xplorer, go to: http: //www. oecd. org/document/50/0, 3343, en_2649_33735_41564530_1_1, 00. h tml. This development is part of the overall strategy to improve the accessibility and usability of OECD statistics (see also the visualisation of data contained in the OECD Factbook using dynamic graphics http: //www. oecd. org/document/1/0, 3343, en_2825_293564_40680833_1_1, 00. h tml). The development of OECD e. Xplorer is the result of a fruitful cooperation between OECD and the National Centre for Visual Analytics (NCVA, http: //ncva. itn. liu. se/) at Linköping University, Sweden. In the seminar on generating knowledge from statistics, organised by Statistics Sweden and OECD in Stockholm in May, Professor Mikael Jern from NCVA presented a first version with some OECD statistics. Since then, the development team at NCVA has worked intensively on improving the tool and adapting it to all the needs expressed by OECD. 66
Links 11: Hans Rosling www. ted. com search Rosling 2006 and 2007 talks: http: //www. ted. com/index. php/talks/view/id/92 http: //www. ted. com/index. php/talks/view/id/140 Software and data http: //tools. google. com/gapminder/ 67