Introduction to Statistics What is Statistics Statistics is


 that are being")


, exhausting")


- Slides: 10
Introduction to Statistics What is Statistics? : Statistics is the sciences of conducting studies to collect, organize, summarize, analyze, and draw conclusions from data.
Several Reasons to Study Statistics • Students, like professional people, must be able to read and understand the various statistical studies performed in their fields. To have this understanding, they must be knowledgeable about the vocabulary, symbols, concepts, and statistical procedures used in these studies. • Students and professional people may be called on to conduct research in their fields, since statistical procedures are basic to research. To accomplish this they must be able to design experiments; collect, organize, analyze, and summarize data; and possibly maked reliable predictions or forecasts for future use. • Students and professional people can also use the knowledge gained from studying statistics to become better consumers and citizens. For example, they can make intelligent decisions about what products to purchase based on consumer studies about government speding based on utilization studies, and so on.
• A variable is a characteristic or attribute that can assume different values. • Data are the values (measurements or observations) that the variables can assume. • Random variables Variables whose values are determined by chance. • A collection of data values forms a data set. Each value in the data set is called a data values or a datum.
• A population consists of all subjects (human or otherwise) that are being studied. • A sample is a group of subject selected from a population. • Descriptive statistics consists of the collection, organization, summarization and presentation of data. • Inferential Statistics consists of generalizing from samples to populations, performing estimations and hypothesis tests, determining relationships among variables, and making predictions.
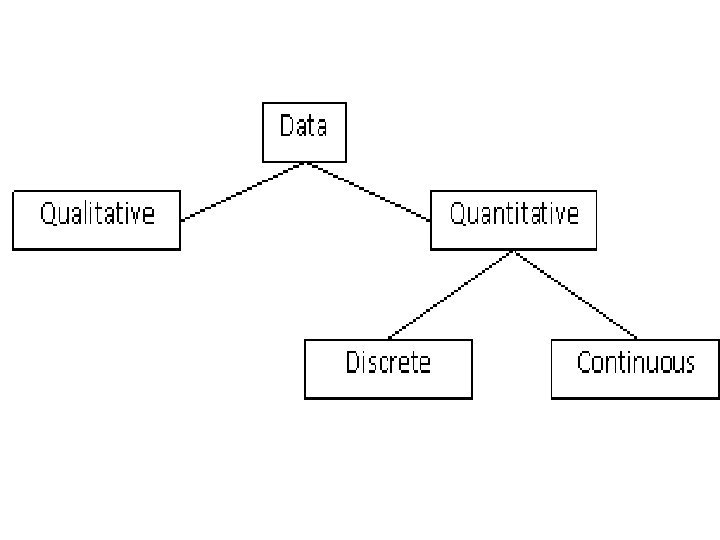
• Qualitative variables are variables that can be placed into distinct categories, according to some characteristic or attribute. For example, if subject are classified according to gender (male or female), the variable gender is qualitative.
• Quantitative variables are numerical and can be ordered or ranked. For example, the variable age, heights, weights, body temperature are numerical. • Discrete variables assume values that can be counted. • Continuous variables can assume all values between any two specific values. They are obtained by measuring.
• The nominal level of measurement classifies data into mutually exclusive (non-overlapping), exhausting categories in which no order or ranking can be imposed on the data. • Example: College instructors are classified according to subject they taught (e. g. , English, Math, history, or psychology). Gender, eye color, political or religious affiliation, nationality and so on are nominal-level data.
• The ordinal level of measurement classifies data into categories that can be ranked; however, precise differences between the ranks do not exist. • Example: Letter grades (A, B, C, D, F), rating scale (poor, good, excellent) • The interval level of measurement ranks data, and precise differences between units of measure do exist; however, there is no meaningful zero (no true zero). • Example: Body temperature (in degrees Celsius), IQ.
• The ratio level of measurement possesses all the characteristics of interval measurement, and there exists a true zero. In addition, true ratios exist when the same variable is measured on two different members of the population. • Example: height, weight, time, salary and age etc. .