Electronic Structure of Strongly Correlated Materials Insights from


 q.")


 T/W Phase diagram of")


 (and of")

 LDA underestimates the volume of")
")
 vs (a. u.")


 vs q in delta Pu X. Dai et. al. Science vol")

 C 44 (GPa) C 12 (GPa)")


. For a review Damascelli et. al. RMP (2003)")


 vs q in delta Pu X. Dai et. al. Science vol")

 quantitative results , connection between")


")
 vs (a. u.")
 C 44 (GPa) C 12 (GPa)")


. Momentum dependence of the low-energy Photoemission")


 of the")
![Anomalous transfer of optical spectral weight, Ni. Se. S. [Miyasaka and Takagi 2000]](https://slidetodoc.com/presentation_image_h2/9cb4d0a7498dcdf43002e7108c4b4cab/image-70.jpg "Anomalous transfer of optical spectral weight, Ni. Se. S. [Miyasaka and Takagi 2000]")


2 X are across Mott transition X Ground U/t t’/t - Insulating")


 of the")


. Evidence for QP peak in V")


2 X Increasing pressure")


. Evidence for QP peak in V")


. First happy")


. G.")
- Slides: 129
Electronic Structure of Strongly Correlated Materials: Insights from Dynamical Mean Field Theory Gabriel Kotliar Physics Department and Center for Materials Theory Rutgers University • UCSD May 2005
Outline • Introduction to strongly correlated electrons. • Introduction to Dynamical Mean Field Theory (DMFT) • The Mott transition problem. Theory and experiments. • More realistic calculations. Pu the Mott transition across the actinide series. • Current developments and future directions.
Electrons in a Solid: the Standard Model Band Theory: electrons as waves. Landau Fermi Liquid Theory. Rigid bands , optical transitions , thermodynamics, transport……… • Quantitative Tools. Density Functional Theory+Perturbation Theory.
Success story : Density Functional Linear Response Tremendous progress in ab initio modelling of lattice dynamics & electron-phonon interactions has been achieved (Review: Baroni et. al, Rev. Mod. Phys, 73, 515, 2001)
Correlated Materials do big things • Huge resistivity changes V 2 O 3. • Copper Oxides. . (La 2 -x Bax) Cu. O 4 High Temperature Superconductivity. 150 K in the Ca 2 Ba 2 Cu 3 Hg. O 8. • Uranium and Cerium Based Compounds. Heavy Fermion Systems, Ce. Cu 6, m*/m=1000 • (La 1 -x. Srx)Mn. O 3 Colossal Magnetoresistance.
Strongly Correlated Materials. • Large thermoelectric response in Na. Co 2 -x. Cux. O 4 • Huge volume collapses, Ce, Pu…… • Large and ultrafast optical nonlinearities Sr 2 Cu. O 3 • Large Coexistence of Ferroelectricity and Ferromagnetism (multiferroics) YMn. O 3.
Breakdown of standard model • Large metallic resistivities exceeding the Mott limit. • Maximum metallic resistivity 200 mohm cm • Breakdown of the rigid band picture. • Anomalous transfer of spectral weight in photoemission and optics. • The quantitative tools of the standard model fail.
Strong Correlation Anomalies cannot be understood within the standard model of solids, based on a RIGID BAND PICTURE, e. g. “Metallic “resistivities that rise without sign of saturation beyond the Mott limit, temperature dependence of the integrated optical weight up to high frequency C. Urano et. al. PRL 85, 1052 (2000)
Breakdown of standard model • Large metallic resistivities exceeding the Mott limit. • Breakdown of the rigid band picture. • Anomalous transfer of spectral weight in photoemission and optics. • LDA+GW loses its predictive power. • Need new reference frame, to think about and compute the properties of correlated materials. • Need new starting point to do perturbation theory.
Localization vs Delocalization Strong Correlation Problem • Many interesting compounds do not fit within the “Sandard Model”. • Tend to have elements with partially filled d and f shells. Competition between kinetic and Coulomb interactions. • Breakdown of the wave picture. Need to incorporate a real space perspective (Mott). • Interesting compounds are not close to either the localized or itinerant limit. Excitations are different in both limits. Non perturbative problem. • DMFT, Simplest approach to electronic structure, which interpolates correctly between atoms and bands.
Hubbard model q. U/t q. Doping d or chemical potential q. Frustration (t’/t) q. T temperature Mott transition as a function of doping, pressure temperature etc.
One Particle Local Spectral Function and Angle Integrated Photoemission e • Probability of removing an electron and transfering energy w=Ei-Ef, f(w) A(w) M 2 • Probability of absorbing an electron and transfering energy w=Ei-Ef, (1 -f(w)) A(w) M 2 • Theory. Compute one particle greens function and use spectral function. n n e A(w) is different in the localized and itinerant limit.
Pressure Driven Mott transition How does the electron go from the localized to the itinerant limit ?
M. Rozenberg et. al. Phys. Rev. Lett. 75, 105 (1995) T/W Phase diagram of a Hubbard model with partial frustration at integer filling. Thinking about the Mott transition in single site DMFT.
Evolution of the Spectral Function with Temperature Anomalous transfer of spectral weight connected to the proximity to the Ising Mott endpoint (Kotliar Lange nd Rozenberg Phys. Rev. Lett. 84, 5180 (2000)
V 2 O 3: Anomalous transfer of spectral weight Th. Pruschke and D. L. Cox and M. Jarrell, Europhysics Lett. , 21 (1993), 593 , .
Anomalous Resistivity and Mott transition Ni Se 2 -x Sx Crossover from Fermi liquid to bad metal to semiconductor to paramagnetic insulator.
Single site DMFT and kappa organics
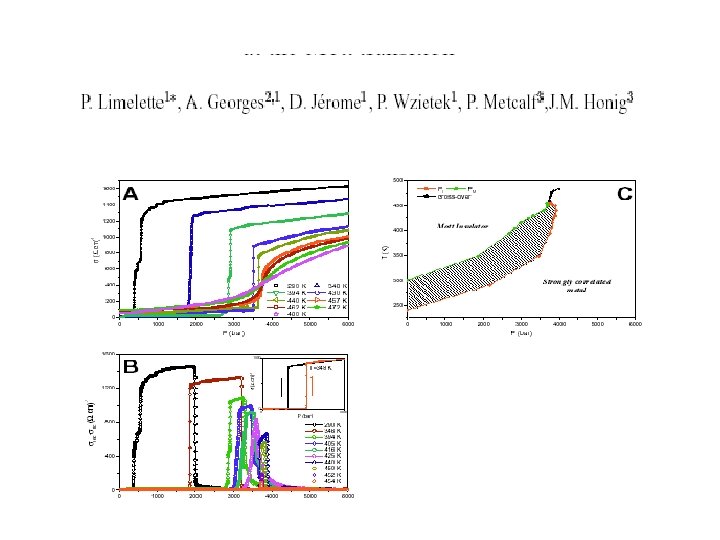
Ising critical endpoint! In V 2 O 3 P. Limelette et. al. Science 302, 89 (2003)
. ARPES measurements on Ni. S 2 -x. Sex Matsuura et. Al Phys. Rev B 58 (1998) 3690. Doniaach and Watanabe Phys. Rev. B 57, 3829 (1998) Mo al. , Phys. Rev. Lett. 90, 186403 (2003). et
Conclusions. • Three peak structure, quasiparticles and Hubbard bands. • Non local transfer of spectral weight. • Large metallic resistivities. • The Mott transition is driven by transfer of spectral weight from low to high energy as we approach the localized phase. • Coherent and incoherence crossover. Real and momentum space. • Theory and experiments begin to agree.
Two paths for calculation of electronic structure of strongly correlated materials Crystal structure +Atomic positions Model Hamiltonian Correlation Functions Total Energies etc. DMFT ideas can be used in both cases.
Insert more realistic applications of LDA+DMFT
DMFT: Realistic Implementations • Focus on the “local “ spectral function A(w) (and of the local screened Coulomb interaction W(w) ) of the solid. • Write a functional of the local spectral function such that its stationary point, give the energy of the solid. • No explicit expression for the exact functional exists, but good approximations are available. LDA+DMFT. • The spectral function is computed by solving a local impurity model in a medium. Which is a new reference system to think about correlated electrons.
Pu in the periodic table actinides
Pu phases: A. Lawson Los Alamos Science 26, (2000) LDA underestimates the volume of fcc Pu by 30% Predicts magnetism in d Pu and gives negative shear Core-like f electrons overestimates the volume by 30 %
Small amounts of Ga stabilize the d phase (A. Lawson LANL)
Total Energy as a function of volume for Pu W (ev) vs (a. u. 27. 2 ev) (Savrasov, Kotliar, Abrahams, Nature ( 2001) Non magnetic correlated state of fcc Pu. Zein Savrasov and Kotliar (2004)
Alpha and delta Pu
Phonon Spectra • Electrons are the glue that hold the atoms together. Vibration spectra (phonons) probe the electronic structure. • Phonon spectra reveals instablities, via soft modes. • Phonon spectrum of Pu had not been measured.
Phonon freq (THz) vs q in delta Pu X. Dai et. al. Science vol 300, 953, 2003
Inelastic X Ray. Phonon energy 10 mev, photon energy 10 Kev. E = Ei - Ef Q =ki - kf
DMFT Phonons in fcc d-Pu C 11 (GPa) C 44 (GPa) C 12 (GPa) C'(GPa) Theory 34. 56 33. 03 26. 81 3. 88 Experiment 36. 28 33. 59 26. 73 4. 78 ( Dai, Savrasov, Kotliar, Ledbetter, Migliori, Abrahams, Science, 9 May 2003) (experiments from Wong et. al, Science, 22 August 2003)
J. Tobin et. al. PHYSICAL REVIEW B 68, 155109 , 2003
• Pu strongly correlated element, at the brink of a Mott instability. • Realistic implementations of DMFT : total energy, photoemission spectra and phonon dispersions of delta Pu. • Clues to understanding other Pu anomalies.
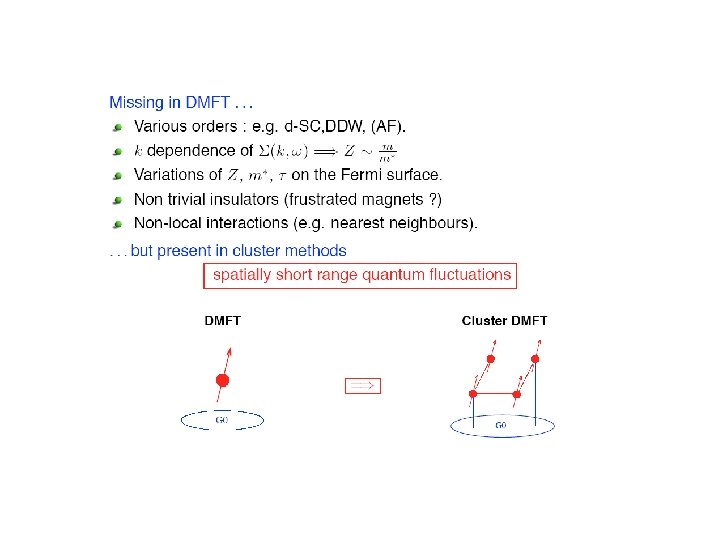
CDMFT vs single site DMFT
Superconductivity and Antiferromagnetism t’=0 M. Capone et. al. Explore connection with the Mott transition.
Follow the “normal state” with doping. Evolution of the spectral function at low frequency. If the k dependence of the self energy is weak, we expect to see contour lines corresponding to Ek = const and a height increasing as we approach the
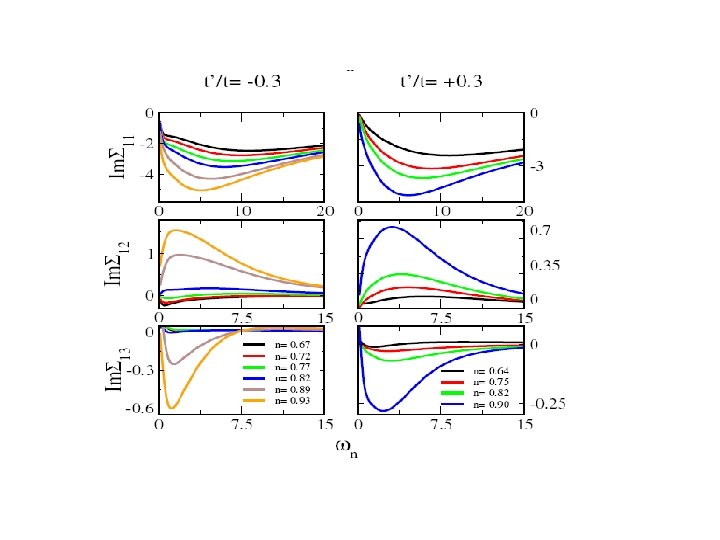
Hole doped case t’=-. 3 t, U=16 t n=. 71. 93. 97
K. M. Shen et. al (2004). For a review Damascelli et. al. RMP (2003)
Approaching the Mott transition: CDMFT Picture • Qualitative effect, momentum space differentiation. Formation of hot –cold regions is an unavoidable consequence of the approach to the Mott insulating state! • D wave gapping of the single particle spectra as the Mott transition is approached. • Similar scenario was encountered in previous study of the kappa organics. O Parcollet Biroli and Kotliar PRL, 92, 226402. (2004).
Break up of the Fermi surface as the Mott transition is approached • The quasiparticles in some regions of k space retain their coherence. • The quasiparticles in other regions of k space are strongly scattered and then they are gapped. • This is captured by the different behavior of the components of the cluster self energy.
To test if the formation of the hot and cold regions is the result of the proximity to Antiferromagnetism, we studied various values of t’/t, U=16.
Electron doped case t’=. 9 t U=16 t n=. 69. 92. 96 Breakup of the Fermi surface is a consequence of the approach to the Mott transition point, and not a result of a specifid form of long range order.
Goal of a good mean field theory • Provide a zeroth order picture of a physical phenomena. • Provide a link between a simple system (“mean field reference frame”) and the physical system of interest. • Formulate the problem in terms of local quantities (which we can compute better ). • Allows to perform quantitative studies, and predictions. Focus on the discrepancies between experiments and mean field predictions. • Generate useful language and concepts. Follow mean field states as a function of parameters. • Exact in some limit. • Can be made system specific, useful tool for material exploration.
Conclusion • DMFT: quantum impurity models in a self consistent medium, new reference system to understand the behavior of strongly correlated materials. • Realistic and cluster extensions of DMFT, increased of our understanding of correlated materials. Coupled to growing computer power will lead to greater predictive capabilities in the future. • Rational theoretically guided material design using the exotic properties of correlated materials ?
Collaborators References • Reviews: A. Georges G. Kotliar W. Krauth and M. Rozenberg RMP 68 , 13, (1996). • Reviews: G. Kotliar S. Savrasov K. Haule V. Oudovenko O. Parcollet and C. Marianetti. Submitted to RMP (2005). • Gabriel Kotliar and Dieter Vollhardt Physics Today 57, (2004)
Phonon freq (THz) vs q in delta Pu X. Dai et. al. Science vol 300, 953, 2003
Inelastic X Ray. Phonon energy 10 mev, photon energy 10 Kev. E = Ei - Ef Q =ki - kf
Conclusion • DMFT. Electronic Structure Method in Development. a) quantitative results , connection between electronic structure, scales and bonding. b) qualitative understanding by linking real materials to impurity models. Concepts to think about correlate materials. • System specific. Many materials to be studied, realistic matrix elements for each spectroscopy. Optics. IXS. • Interplay of theory and experiment. DMFT can enhance joint theoretical- experimental advances in the field of correlated electron materials.
Pu in the periodic table actinides
Small amounts of Ga stabilize the d phase (A. Lawson LANL)
Total Energy as a function of volume for Pu W (ev) vs (a. u. 27. 2 ev) (Savrasov, Kotliar, Abrahams, Nature ( 2001) Non magnetic correlated state of fcc Pu. Zein Savrasov and Kotliar (2004)
DMFT Phonons in fcc d-Pu C 11 (GPa) C 44 (GPa) C 12 (GPa) C'(GPa) Theory 34. 56 33. 03 26. 81 3. 88 Experiment 36. 28 33. 59 26. 73 4. 78 ( Dai, Savrasov, Kotliar, Ledbetter, Migliori, Abrahams, Science, 9 May 2003) (experiments from Wong et. al, Science, 22 August 2003)
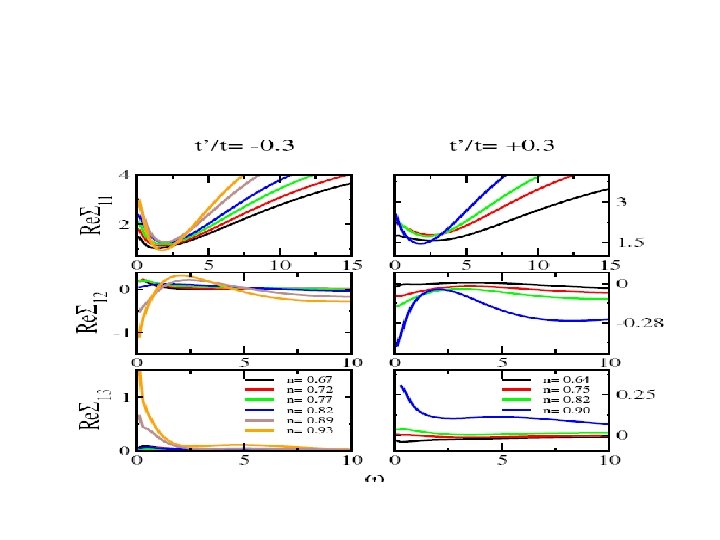
Fermi Surface Shape renormalization • Photoemission determines the renormalized hopping parameters. • The bare parameters, t and t’ should be independent of doping. • We find that the renormalized hopping parameters are strongly doping dependent! • t’eff=t’+S 13(w=0) • teff=t+S 12(w=0) Furthermore in the electron doped case t’/t renormalizes towards perfect nesting, while in the hole doped case it renormalizes away from perfect nesting.
Fermi Surface Shape Renormalization
Electron Doped Case t’=. 3 t, U=16 t n=. 7 , . 93, . 96
Approaching the Mott transition: CDMFT picture. • Qualitative effect, momentum space differentiation. Formation of hot –cold regions is an unavoidable consequence of the approach to the Mott insulating state! • General phenomena, BUT the location of the cold regions depends on parameters. • Quasiparticles are now generated from the Mott insulator at (p, 0). • Consistenty with many numerical studies of electron hole asymmetry in t-t’ Hubbard models Tohyama Maewawa Phys. Rev. B 67, 092509 (2003) Senechal and Tremblay. PRL 92 126401 (2004) Kusko et. al. Phys. Rev 66, 140513 (2002)
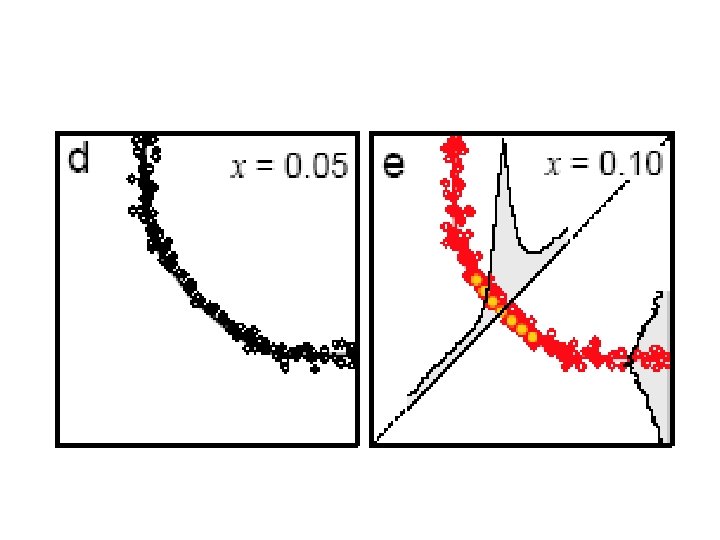
Consistent with experiments. Armitage et. al. PRL (2001). Momentum dependence of the low-energy Photoemission spectra of NCCO
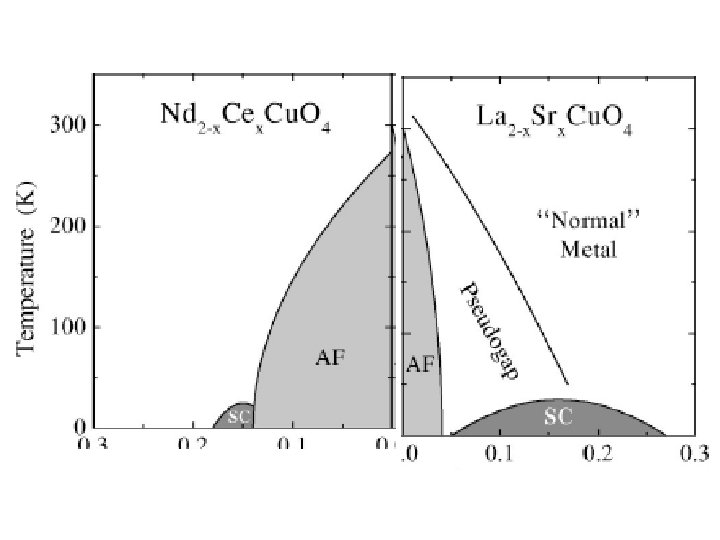
o Qualitative Difference between the hole doped and the electron doped phase diagram is due to the underlying normal state. ” In the hole doped, it has nodal quasiparticles near (p/2, p/2) which are ready “to become the superconducting quasiparticles”. Therefore the superconducing state can evolve continuously to the normal state. The superconductivity can appear at very small doping. o Electron doped case, has in the underlying normal state quasiparticles leave in the (p, 0) region, there is no direct road to the superconducting state (or at least the road is tortuous) since the latter has QP at (p/2, p/2).
Approaching the Mott transition: plaquette CDMFT. • Qualitative effect, momentum space differentiation. Formation of hot –cold regions is an unavoidable consequence of the approach to the Mott insulating state! • General phenomena, but the location of the cold regions depends on parameters. Study the “normal state” of the Hubbard model is useful. • Connection with the slave boson approaches. Superconductivity near the Mott insulting state.
Conclusion • Self consistent QIM models are good reference frames to describe how the electron evolves from localized to itinerant. • Recent crucial experiments in kappa organics and V 2 O 3. • Breakup of the Fermi surface is an unavoidable consequence of the approach to the Mott transition. • Non trivial doping dependence of the Fermi surface of the electron and hole doped cuprates.
Future work • Analytic understanding of the Fermi surface breakup. • Connections with competing order and two particle quantities, neutron scattering, Raman scattering, optics. • Approaching the Mott insulator from the superconducting side. • Realistic first principles calculations of the electronic structure of materials.
Dynamical Mean Field Theory • Focus on the local spectral function A(w) of the solid. • Write a functional of the local spectral function such that its stationary point, give the energy of the solid. • No explicit expression for the exact functional exists, but good approximations are available. • The spectral function is computed by solving a local impurity model. Which is a new reference system to think about correlated electrons. • Ref: A. Georges G. Kotliar W. Krauth M. Rozenberg.
Anomalous transfer of optical spectral weight, Ni. Se. S. [Miyasaka and Takagi 2000]
Optical transfer of spectral weight , kappa organics. Eldridge, J. , Kornelsen, K. , Wang, H. , Williams, J. , Crouch, A. , and Watkins, D. , Sol. State. Comm. , 79, 583 (1991).
Evolution of the Spectral Function with Temperature Anomalous transfer of spectral weight connected to the proximity to the Ising Mott endpoint (Kotliar Lange nd Rozenberg Phys. Rev. Lett. 84, 5180 (2000)
Epilogue, the search for a quasiparticle peak and its demise, photoemission, transport. Confirmation of the DMFT predictions q q q ARPES measurements on Ni. S 2 -x. Sex Matsuura et. Al Phys. Rev B 58 (1998) 3690. Doniaach and Watanabe Phys. Rev. B 57, 3829 (1998) S. -K. Mo et al. , Phys Rev. Lett. 90, 186403 (2003). Limelette et. al. [Science] G. Kotliar [Science].
ET = k-(ET)2 X are across Mott transition X Ground U/t t’/t - Insulating anion layer X-1 conducting ET layer [(ET)2]+1 modeled to triangular lattice t’ t State Cu 2(CN)3 Mott insulator 8. 2 1. 06 Cu[N(CN)2]Cl Mott insulator 7. 5 0. 75 Cu[N(CN)2]Br SC 7. 2 0. 68 Cu(NCS)2 SC 6. 8 0. 84 Cu(CN)[N(CN)2 SC ] Ag(CN)2 H 2 O SC 6. 8 0. 68 6. 6 0. 60 I 3 6. 5 0. 58 SC
CDMFT and Dynamical RVB. • Allows the investigation of the normal state underlying the superconducting state, by forcing a symmetric Weiss function, follow the normal state near the Mott transition. • Earlier studies (Katsnelson and Lichtenstein, M. Jarrell, M Hettler et. al. Phys. Rev. B 58, 7475 (1998). T. Maier et. al. Phys. Rev. Lett 85, ) used QMC as an impurity solver and DCA as cluster scheme. • We use exact diag ( Krauth Caffarel 1995 with effective temperature 32/t=124/D ) as a solver and Cellular DMFT as the mean field scheme. 1524 (2000)
ARPES measurements on Ni. S 2 -x. Sex . Matsuura et. Al Phys. Rev B 58 (1998) 3690. Doniaach and Watanabe Phys. Rev. B 57, 3829 (1998)
One Particle Local Spectral Function and Angle Integrated Photoemission e • Probability of removing an electron and transfering energy w=Ei-Ef, f(w) A(w) M 2 • Probability of absorbing an electron and transfering energy w=Ei-Ef, (1 -f(w)) A(w) M 2 • Theory. Compute one particle greens function and use spectral function. n n e
Dynamical Mean Field Theory • Focus on the local spectral function A(w) of the solid. • Write a functional of the local spectral function such that its stationary point, give the energy of the solid. • No explicit expression for the exact functional exists, but good approximations are available. • The spectral function is computed by solving a local impurity model. Which is a new reference system to think about correlated electrons. • Ref: A. Georges G. Kotliar W. Krauth M. Rozenberg.
Evolution of the spectral function at low frequency. If the k dependence of the self energy is weak, we expect to see contour lines corresponding to Ek = const and a height increasing as we approach the
Evolution of the k resolved Spectral Function at zero frequency. (Kappa organics Parcollet Biroli and GK PRL, 92, 226402. (2004)) ) U/D=2. 25 Uc=2. 35+-. 05, Tc/D=1/44
Mechanism for hot spot formation
Mott transition in cluster
Mott transition and d wave superconductivity
Evolution of the low energy tunneling density of state with doping
CDMFT angle resolved spectra n=. 96 t’/t=. -. 3 U=16 t • i
Conjecture, Mott transition with Zcold finite ? Continuity with the insulator at one point in the zone.
Momentum space differentiation and divergence of Im Sc at the Mott transition
Notice the similarity in the evolution of the real part of the self energies.
Fermi Surface Renormalization CDMFT and expt. Civelli et. al.
CDMFT and Dynamical RVB n=. 96 t’/t=. -. 3 U=16 t • i
Unfortunately the Hubbard model does not capture the trend of supra with t’. Need augmentation. V. Kancharla
CDMFT and Dynamical RVB n=. 96 t’/t=. -. 3 U=16 t • i
Methodology: 1 and 2 site CDMFT • Impurity solver. Multiband QMC. • Derivation of the effective Hamiltonian. Massive downfolding with O Andersen’s new Nth order LMTOS. Coulomb interactions estimated using dielectric constant W=. 5 ev. U on titanium 2 ev. J=. 2 ev.
Electron doped case t’=. 9 t U=16 t n=. 69. 92. 96 Color scale x=. 9, . 32, . 22
Hole doped case t’=-. 3 t, U=16 t n=. 71. 93. 97 Color scale x=. 37. 15. 13
Cluster DMFT 1 4 2 3
Electron Doped Case t’=. 3 t, U=16 t n=. 7 , . 93, . 96 Color scale x=. 74, . 55, . 22
Testing CDMFT (G. . Kotliar, S. Savrasov, G. Palsson and G. Biroli, Phys. Rev. Lett. 87, 186401 (2001) ) with two sites in the Hubbard model in one dimension. [V. Kancharla C. Bolech and GK PRB 67, 075110 (2003)][[M. Capone. M. Civelli Kancharla C. Castellani and GK P. R B 69, 195105 (2004) ] U/t=4. V
Site Cellular DMFT. C-DMFT. Kotliar, S. Savrasov, G. Palsson and G. Biroli, Phys. Rev. Lett. 87, 186401 (2001) G. . tˆ(K) hopping expressed in the superlattice notations. • Other cluster extensions (DCA Jarrell Krishnamurthy, M Hettler et. al. Phys. Rev. B 58, 7475 (1998)Katsnelson and Lichtenstein periodized scheme, Nested Cluster Schemes , causality issues, O. Parcollet, G. Biroli and GK cond-matt 0307587.
Searching for a quasiparticle peak
Schematic DMFT phase diagram Hubbard model (partial frustration). Evidence for QP peak in V 2 O 3 from optics. M. Rozenberg G. Kotliar H. Kajueter G Thomas D. Rapkine J Honig and P Metcalf Phys. Rev. Lett. 75, 105 (1995)
ARPES measurements on Ni. S 2 -x. Sex . Matsuura et. Al Phys. Rev B 58 (1998) 3690. Doniaach and Watanabe Phys. Rev. B 57, 3829 (1998)
QP in V 2 O 3 was recently found Mo et. al
k organics • ET = BEDT-TTF=Bisethylene dithio tetrathiafulvalene • K (ET)2 X Increasing pressure ----- increasing t’ -----X 0 X 1 X 2 X 3 • (Cu)2 CN)3 Cu(NCN)2 Cl Cu(NCN 2)2 Br Cu(NCS)2 • Spin liquid Mott transition
Large and ultrafast optical nonlinearities Sr 2 Cu. O 3 (T Ogasawara et. a Phys. Rev. Lett. 85, 2204 (2000) )
More examples • Li. Co. O 2 • Used in batteries, laptops, cell phones
Large thermoelectric power in a metal with a large number of carriers Na. Co 2 O 4
Vanadium Oxide Transport under pressure. Limelette etal
Mean-Field : Classical vs Quantum Classical case Phys. Rev. B 45, 6497 Quantum case A. Georges, G. Kotliar (1992)
Expt. Wong et. al.
Testing CDMFT (G. . Kotliar, S. Savrasov, G. Palsson and G. Biroli, Phys. Rev. Lett. 87, 186401 (2001) ) with two sites in the Hubbard model in one dimension. [V. Kancharla C. Bolech and GK PRB 67, 075110 (2003)][[M. Capone. M. Civelli Kancharla C. Castellani and GK P. R B 69, 195105 (2004) ] U/t=4. V
Two paths for ab-initio calculation of electronic structure of strongly correlated materials Crystal structure +Atomic positions Model Hamiltonian Correlation Functions Total Energies etc. DMFT ideas can be used in both cases.
LDA+DMFT V. Anisimov, A. Poteryaev, M. Korotin, A. Anokhin and G. Kotliar, J. Phys. Cond. Mat. 35, 7359 (1997). A Lichtenstein and M. Katsnelson PRB 57, 6884 (1988). • The light, SP (or SPD) electrons are extended, well described by LDA. The heavy, D (or F) electrons are localized treat by DMFT. • LDA Kohn Sham Hamiltonian already contains an average interaction of the heavy electrons, subtract this out by shifting the heavy level (double counting term) q Kinetic energy is provided by the Kohn Sham Hamiltonian (sometimes after downfolding ). The U matrix can be estimated from first principles of viewed as parameters. Solve resulting model using DMFT.
Schematic DMFT phase diagram Hubbard model (partial frustration). Evidence for QP peak in V 2 O 3 from optics. M. Rozenberg G. Kotliar H. Kajueter G Thomas D. Rapkine J Honig and P Metcalf Phys. Rev. Lett. 75, 105 (1995)
QP in V 2 O 3 was recently found Mo et. al
Site Cellular DMFT. C-DMFT. Kotliar, S. . Savrasov, G. Palsson and G. Biroli, Phys. Rev. Lett. 87, 186401 (2001) G. tˆ(K) hopping expressed in the superlattice notations. • Other cluster extensions (DCA Jarrell Krishnamurthy, Katsnelson and Lichtenstein periodized scheme, Nested Cluster Schemes Schiller Ingersent ), causality issues, O. Parcollet, G. Biroli and GK cond-matt 0307587 (2003)
DMFT and correlated electron materials. Energy T Configurational Coordinate in the space of Hamiltonians
DMFT Cavity Construction. A. Georges and G. Kotliar PRB 45, 6479 (1992). First happy marriage of atomic and band physics. Reviews: A. Georges G. Kotliar W. Krauth and M. Rozenberg RMP 68 , 13, 1996 Gabriel Kotliar and Dieter Vollhardt Physics Today 57, (2004)
Failure of the standard model : Anomalous Resistivity: Li. V 2 O 4 Takagi et. al. PRL 2000
Failure of the Standard Model: Anomalous Spectral Weight Transfer Optical Conductivity o of Fe. Si for T=20, 40, 200 and 250 K from Schlesinger et. al (1993) Neff depends on T
1 2 4 3 A. Georges and G. Kotliar PRB 45, 6479 (1992). G. Kotliar, S. Savrasov, G. Palsson and G. Biroli, PRL 87, 186401 (2001).