AFRICAN AND SOUTH AFRICAN ECONOMIC HISTORY Johan Fourie


")


 � Tropical versus")


 � Wine")


 NH NWH")


 (2) (3) (4) (5) 0. 191 1. 721***")

 NWH WH Slaves*NWH Slaves*WH Knechts*NWH Knechts*WH Wheat sown*NWH Wheat sown*WH Cattle")


 Stronger coastal tribes (including")
 his reign united the tribes of")
 Batavian rule (1803 -1806) British rule")


 were motivated by the fact that")


 � Kimberley founded Gold (1886) � Johannesburg Massive shift")


 Bantu Education (1954) Homelands (1956) 1958 – Hendrik")

 1976 – Soweto")
 1990 – FW de")


- Slides: 109
AFRICAN AND SOUTH AFRICAN ECONOMIC HISTORY Johan Fourie IPSU • 2011
GEOGRAPHY AND LUCK Johan Fourie IPSU • 2011
Die origin of man Anatomically modern humans migrated out of Africa between 100 000 and 50 000 years ago – the so-called “Out of Africa” hypothesis � There were already groups of proto-humans (that moved out of Africa about 2. 5 million years ago, Homo Erectus) in the rest of the wolrd (like the Neanderthals in Europe), but they were probably completely replaced by Homo Sapiens � All people are thus biologically almost identical – biology is thus not the reason why some are rich and others poor
Out of Africa Source: Wikipedia 2011
Hunters For 99% of our history, we were huntergatherers Nomadic lifestyle Exploit natural resources with limited impact on the environment; simple technology; low population density Until about 10000 BCE…
Guns, germs and steel History followed different routes because of geographical differences, not biological Ultimate causes: animal and plant domestication and the geography of continents
The origin of agriculture Source: Wikipedia 2011
Die first settlers The agricultural revolution occurred because of dramatic changes in the environment (climate) Some plants and animals were domesticated (as apposed to ‘tame’) People were thus not forced to search for food, but could settle close to a permanent supply of energy They were thus the first settlers
Domestication
Plants and animals
The Neolithic Revolution Agriculture » settled homes » higher population density » surplus production » specialisation Specialisation » soldiers, artists, magicians… and kings Surplus » something to steal NR results in economic development (in the long-run) but also inequality
The consequences of the NR The equality of the hunter-gatherer disappeared Aside from the new threat to security, the new towns required a new way of social organising – a gap between those that work and those that manage In short: hierarchies of wealth, status and power are characteristic of the new societies
The consequences of the NR In the early agricultural villages of 10, 000 years ago, the seeds of our own way of life were sown: economic specialization, the possibility of private as opposed to or complementary to communal life; the opportunity to accumulate wealth in material objects; the opportunity to accumulate new techniques and tools and knowledge
Development in the long-run Societies adapt to changing environments � Some adapt better than others (Jared Diamond) After the fall of the Roman empire in 476 CE, Europe in turmoil � Progress in the East Especially 1400 CE in China, 700 CE –
Questions from the session? Answer a 12 year-old African kid in Zambia, who asks you why white people are rich and black people poor. Some societies adapt better to changing environments. What lessons can we learn from these trends for the future?
AFRICA Johan Fourie IPSU • 2011
Africa How well do you know your continent? � How many countries � How many people Jared Diamond: � How Africa Became Black
Africa: Where did it all begin? Cradle of mankind – South Africa, Kenya? First wave moving out of Africa Second wave replacing first wave Within Africa, the diversity was/is immense
What we do know Five major human groups � Blacks, whites, African Pygmies, Khoisan and Asians Of course, unlike European history, Africa has little written history Use of language can tell us much about Africa’s past
The migration of the Banto The Niger-Congo language family is distributed all over West Africa and most of subequatorial Africa How do we know where it started? English example Same line of reasoning suggests a significant migration of the Banto from Cameroon to the south
The Bantu migration Since 1500 BCE Bantu settlers migrated east and south from modern day Cameroon and Nigeria Better technology compared to existing inhabitants (Khoi and San) Conflict or amalgamation?
Why? What was the Banto’s advantage? All of the domesticated plants in Africa stem from north of the equator – coffee, yams, sorghum, oil palm and kola nut Sole animal that was domesticated is the guinea fowl – all others came from Middle East/Asia through trade Khoisan and Pygmies was thus at disadvantage
The Bantu migration By 300 CE they reach South Africa, spread over the entire country (except the Westernand Northern Cape) � Why not there? Farmers but also cattle herders, especially in the dryer parts Metal working possible – bronze tools – better technology than the Khoisan (who used stone tools)
Great Zimbabwe and Monomotapa Great Zimbabwe 1100 -1450 CE Monomotapa (1430 -1760)
Pre-European civilizations
Mfecane Mass migration of tribes in the North, East and Central South Africa As a consequence of Shaka’s wars, who build the Zulu’s into a powerful tribe through military, social, cultural and political reforms � Reduce the power of witchdoctors � The iklwa – a spear, ‘bullhorn’-technique
Europeans in Africa Shaka’s success – and the change that it brought – meant that large parts of the country were left vacant Into this ‘emptiness’ after the Mfecane, a group of settlers arrived in the 1830 s, claiming the land for themselves � The Great Trek But first, where did these settlers come from?
SLAVERY IN AFRICA Johan Fourie IPSU • 2011
Ethnic diversity
Hard facts Four trade routes � Trans-Atlantic � Indian Ocean � Trans-Saharan � Red Sea
Correlation
Instrument
Regression Two regressions First explains the instrument Second uses instrument to test hypothesis The stars indicate significance Thus: causality proved!
Conclusions?
INSTITUTIONS Johan Fourie IPSU • 2011
AJR African underdevelopment is due to historical institutions But how to measure historical institutions? � Instrumental variable – settler mortality!
Mortality Settler mortality determined the type of institutions that were imposed by the European settlers These institutions would later result in lower growth
COLONISATION Johan Fourie IPSU • 2011
Diverse experiences Case study: Congo � � � 10 million murdered or more from 1885 to 1908 when Belgium took it over as a colony. has been virtually ignored in books on genocide. Yet, this genocide far surpassed in human corpses most every gemocide in the 20 th Century except that by Stalin, Mao, and Hitler. But…
Jomo Kenyatta We do not forget the assistance and guidance we have received through the years from people of British stock: administrators, businessmen, farmers, missionaries and many others. Our law, our system of government and many other aspects of our daily lives are founded on British principles and justice
Discussion questions Its clear that atrocities have been committed in Africa in the name of development If any, what were the benefits from colonisation? If you could retell history, how would you change the European “invasion” of Africa?
SETTLERS IN SOUTH AFRICA Johan Fourie IPSU • 2011
Die VOC 1602 -1800 Goal: to undertake trade voyages to the East � Spices 4785 ships, nearly one million employees
An extremely brief overview of my Ph. D The nature of wealth � Size, growth and structure of wealth in the CC Material culture and standards of living Specialisation and diversification of production �A measure of income (GDP) The causes of wealth � Supply: French Huguenots � Demand: Ships The distribution of wealth � Wealth inequality � Income inequality 45
The Cape Colony Brief history of settlement � European settlement in 1652 by VOC � First 9 Company officials released to become independent farmers in 1657 � In 1688, roughly 150 French settlers (Huguenots) arrive � After 1700, immigration discouraged � Slow expansion until 795 British rule 46
The Cape Colony Characteristics of Cape economy � Three views Earlier historians (De Kiewiet, De Kock, Theal): “Cape was an economic and social backwater” Recent historians (Guelke, Giliomee, Shell, Feinstein): Cape was poor, but with pockets of wealth Economists (Van Duin and Ross, Brunt): Cape was growing faster than previously thought based on quantitative evidence – though their evidence doesn’t support their case Cape was based on slave labour (1658) � Three groups: Officials and wealthy elite farmers, middle-income farmers and traders in Cape Town, poor, mostly frontier farmers � VOC institutions/policies: monopsonist buying, 47 prohibition on trade and manufacture �
Institutions and colonial societies ‘Institutions’ matter � Capital accumulation, quantity and quality of labour and innovation and technology are merely the embodiments, or proximate causes, of growth and are themselves influenced by institutions Colonial societies are the setting for three important contributions: � Acemoglu, Johnson and Robinson (2001, 2002) � Engerman and Sokoloff (2000, 2002, 2005) � La Porta, Lopez de Silanes and Shleifer (2008) 48
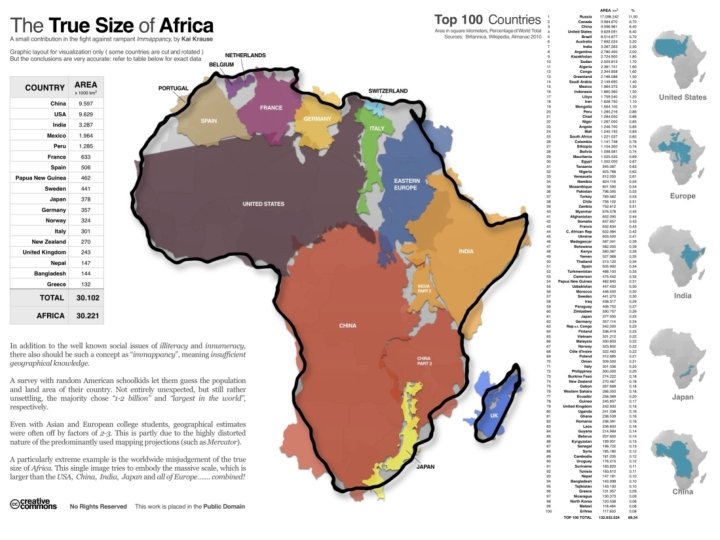
Institutions and colonial societies What institutions? � Extractive versus settler (AJR) � Tropical versus temperate (ES) � Legal origin (LLS) First two theories assume settlers are homogenous � LLS – only difference is legal origin Surely settlers are not all similar? � Modern trade theory and literature on migration Can we show this using evidence from the Dutch Cape Colony? 49
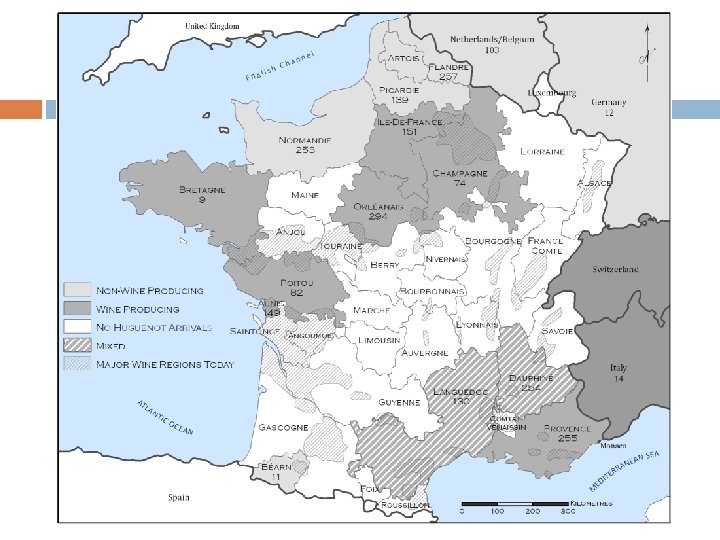
Research question We compare wine and wheat production of the Huguenots and the other settlers � If different, skills acquired in their country of origin may explain these differences But maybe it’s not skills. Maybe it’s because they received more land? Or capital or labour? Or technology? Maybe it’s language, or legal origin, or simply, French institutions Or maybe it’s other forms of human capital (literacy) We then split the sample into French from wineproducing regions and French from non-wine producing regions � I. e. thus removing all claims of institutional, religious and cultural differences 50
Data and Methodology Opgaafrolle and dummies 51
Data Opgaafrolle of the VOC � spanning 1663 to 1773 � Roughly first century of Dutch settlement Tax records � Information on assets rather than consumption and income Wealth and income inequality (Fourie and Von Fintel 2010 a, 2010 b) 52
Data Agricultural indicators � Tithe Rather: “inventory” captured grain sown (ST assets) � Wine on grains which was often evaded production taxed upon entry into Cape Town Vines represent a more long-term asset � Sheep and cattle ownership � Horses Transport Carriages a display of wealth by gentry � Pigs Unevenly distributed and low prevalence 53
Data Non-agricultural indicators � Large sample of individuals with zeroes on all agricultural indicators � Few variables that capture other commercial interests � So non-farmers appear to flesh out a large bottom tail of the wealth distribution Land – no information Slaves � Vital input into the production process � Status symbol Weapons � Sporadic products measurement and evidence of inferior 54
55
RESULTS and robustness checks Descriptives and regression analysis 57
Descriptive results 1700 1709 1719 1731 1741 1752 1757 1773 Wine (leaguers) NH NWH WH 1. 16 1. 18 1. 40 0. 98 0. 55 0. 83 0. 80 0. 44 0. 98 0. 75 0. 55 1. 13 0. 33 0. 25 0. 67 0. 49 0. 54 1. 18 0. 61 0. 82 1. 23 0. 63 0. 93 1. 89 Wheat Reaped (muids) NH NWH WH 4. 32 2. 65 3. 69 17. 45 7. 30 8. 14 9. 45 5. 93 3. 76 8. 68 6. 65 5. 46 10. 55 11. 76 8. 33 4. 72 3. 54 4. 20 3. 36 1. 64 1. 53 3. 73 5. 51 2. 82 Notes: N = observations, HH = household size, M = mean, SD = standard deviation. Only farming households are included in the sample. TABLE 1: Average household ownership per type of asset, farmer sample Group NH N 6848 NWH 1038 WH 1192 Total 9078 58 M SD HH 3. 57 2. 86 3. 62 2. 82 4. 05 3. 16 3. 64 2. 90 Slaves 5. 04 8. 46 3. 73 6. 28 4. 03 6. 70 4. 76 8. 04 Knecht s 0. 15 0. 77 0. 06 0. 29 0. 08 0. 36 0. 13 0. 69 Vines 3. 80 11. 54 3. 65 8. 81 6. 88 12. 87 4. 19 11. 49 Wine 2. 28 7. 64 2. 26 6. 55 4. 83 10. 92 2. 61 8. 08 Wheat Reaped 22. 98 64. 22 20. 01 55. 14 15. 58 41. 05 21. 67 60. 71 Cattle 35. 55 65. 07 31. 78 44. 15 31. 01 40. 86 34. 52 60. 32 Horses 5. 80 10. 08 4. 42 6. 69 4. 54 6. 81 5. 48 9. 39 Notes: N = observations, HH = household size, M = mean, SD = standard deviation. Only farming households are included in the sample. TABLE 2: Mean household per capita production levels, by population groups over time
Mean household per capita output of wine, 1700 - 1773 59
Descriptive results Figure 1: Cumulative Density Functions of Wine Production 60 by group - 1773
Results I NWH WH Slaves*NWH (1) (2) (3) (4) (5) 0. 191 1. 721*** 0. 482*** 1. 917*** 0. 168*** 0. 510*** 1. 793*** 0. 166*** -0. 011 -0. 128 0. 899*** 0. 044*** -0. 081 1. 030*** 0. 068*** -0. 022 -0. 343*** 0. 764*** 0. 068*** -0. 016 -0. 516*** 0. 653*** 0. 067*** -0. 009 -0. 074*** 0. 096 -0. 894 1. 877** 0. 120*** 0. 117*** 0. 048** -0. 073*** 0. 093 -0. 84 2. 004** 0. 120*** 0. 117*** 0. 048** -0. 066*** 0. 106 -0. 842 1. 914** 0. 121*** 0. 114*** 0. 047** -0. 001 0. 011*** 0. 01 -0. 003* 0. 010*** 0. 018 1. 419*** 0. 781*** 0. 125 -0. 003* 0. 010*** 0. 018 1. 403*** 0. 726*** 0. 095 0. 369*** 0. 368*** Slaves*WH Knechts*NWH Knechts*WH Vines*NWH Vines*WH Cattle Wheat reaped Horses Stellenbosch Drakenstein Swellendam Married to NWH Married to WH Born abroad Coertzen Year dummies Constant R-squared N F statistic 0. 416** 0. 014 0. 369** 1. 468 2. 218* 0. 008 0. 132*** 0. 112*** 0. 03 (6) (7) Yes Yes Yes -0. 002 0. 010*** 0. 017 1. 399*** 0. 693*** 0. 067 0. 380*** 0. 421*** 0. 687*** -0. 22 Yes -2. 420*** 0. 104 9078 48. 121 -3. 115*** 0. 296 9078 148. 702 -3. 095*** 0. 297 9078 129. 223 -3. 531*** 0. 542 9078 134. 253 -4. 213*** 0. 564 9078 217. 507 -4. 223*** 0. 565 9078 204. 4 -4. 294*** 0. 566 9078 197. 634 NOTES: NWH = Huguenots from non-wine producing regions. WH = Huguenots from wine-producing regions. Base category: non-Huguenots and the year 1700. Wheat reaped is measured in muiden, Vines in number of thousands. Converted to household per capita levels. Estimates are weighted by household size and significance levels are based on the use of robust standard errors. . *** denotes significance at the 1% significance level, ** at 5% and * at 10%. Dependent Variable: log(Wine per household member produced) (in leaguers), full farmer sample, OLS
Results II WH Slaves*WH Knechts*WH Vines*WH Cattle Wheat reaped Horses Stellenbosch Drakenstein Swellendam Married to NWH Married to WH Born abroad Coertzen Non-numeracy Year dummies Constant R-squared N F statistic (1) 1. 509*** (2) 1. 430*** 0. 172*** 2. 148** Yes -1. 977*** 0. 092 2230 16. 349 Yes -2. 119*** 0. 212 2230 26. 165 (3) 1. 286*** 0. 156*** 0. 025 1. 784 0. 785 (4) 0. 998*** 0. 046*** -0. 047** -0. 541 2. 490 0. 236*** -0. 066* -0. 001 0. 011** 0. 002 1. 076*** 1. 264*** 0. 294 (5) 1. 003*** 0. 052*** -0. 053** -0. 518 2. 559 0. 237*** -0. 068** -0. 001 0. 012** 0. 000 0. 982*** 1. 158*** 0. 240 0. 426*** 0. 380** (6) 1. 029*** 0. 049*** -0. 050** -0. 357 2. 292 0. 235*** -0. 066** -0. 001 0. 013** 0. 004 0. 923*** 1. 036*** 0. 101 0. 412** 0. 419*** 1. 019*** -0. 148 Yes -2. 038*** 0. 213 2230 23. 828 Yes -4. 397*** 0. 602 2230 95. 992 Yes -4. 634*** 0. 604 2230 90. 772 Yes -5. 270*** 0. 611 2230 91. 677 (7) 1. 140*** 0. 029 -0. 034 2. 651*** -0. 977 0. 257*** -0. 088 -0. 003 0. 013* 0. 045 0. 852* 0. 962*** 0. 158 0. 33 0. 285 0. 788*** -0. 158 0. 003 Yes -5. 376*** 0. 596 1675 70. 06 NOTES: WH = Huguenots from wine-producing regions. Base category: Non-Wine Huguenots and the year 1700. Wheat reaped is measured in muiden, Vines in number of thousands. Converted to household per capita levels. Estimates are weighted by household size and significance levels are based on the use of robust standard errors. . *** denotes significance at the 1% significance level, ** at 5% and * at 10%. Dependent Variable: log(Wine per household member produced) (in leaguers), full Huguenot sample, OLS
Results III (1) NWH WH Slaves*NWH Slaves*WH Knechts*NWH Knechts*WH Wheat sown*NWH Wheat sown*WH Cattle Wine Horses Stellenbosch Drakenstein Swellendam Married to NWH Married to WH Born abroad Coertzen Year dummies Constant R-squared N F statistic 0. 26 0. 563*** (2) 0. 249 0. 946*** 0. 198*** 0. 060* -0. 04 -0. 096 2. 379* 2. 836* (3) 0. 100 0. 566*** -0. 002 -0. 343 0. 317*** 0. 145*** 0. 06 -0. 002 0. 045** 0. 126*** Yes -2. 296*** 0. 124 9078 58. 898 Yes -3. 059*** 0. 278 9078 111. 596 Yes -3. 377*** 0. 545 9078 139. 109 (4) -0. 006 0. 242 0. 01 -0. 019 0. 012 -0. 242 0. 212 1. 781* 0. 312*** 0. 154*** 0. 048 -0. 003 0. 007 0. 141*** 0. 978*** 0. 975*** -0. 371*** (5) -0. 097 0. 084 0. 01 -0. 019 0. 011 -0. 241 0. 287 1. 918* 0. 311*** 0. 155*** 0. 046 -0. 003 0. 006 0. 141*** 0. 972*** 0. 981*** -0. 372*** -0. 146 0. 291 Yes -3. 919*** 0. 558 9078 297. 805 Yes -3. 908*** 0. 558 9078 277. 66 (6) -0. 219 -0. 028 0. 009 -0. 012 0. 016 -0. 229 0. 277 1. 831* 0. 312*** 0. 149*** 0. 041 -0. 003 0. 006 0. 141*** 0. 966*** 0. 952*** -0. 392*** -0. 142 0. 285 0. 572** 0. 06 Yes -3. 969*** 0. 559 9078 262. 055 NOTES: NWH = Huguenots from non-wine producing regions. WH = Huguenots from wine-producing regions. Base category: non-Huguenots and the year 1700. Wheat sown is measured in muiden, Wine in number of leauguers produced. Wheat reaped is converted to household per capita levels. Estimates are weighted by household size and significance levels are based on the use of robust standard errors. . *** denotes significance at the 1% significance level, ** at 5% and * at 10%. Dependent Variable: log(Wheat produced) (in muiden) full sample, OLS
Interpretations and conclusions Settler skills and colonial development 64
Location ? Approximate location of 37 Huguenot families in the Drakenstein/Franschhoek area • “This valley is on account of its extraordinary fertility the best portion of the Cape. It was unusually well cultivated through the diligence and untiring industry of the first French colonists and has been maintained in this state by their successors. The fertility of this little district can be imagined from the fact that the first colonists arrived there destitute of all means, and like all others had to borrow from the Company their cattle, farm implements, seed and bread-corn and everything else they needed; yet were the first to repay their debt amounting to many thousands of gulden. ” – O. F. Mentzel • Seems to be productivity rather than natural fertility Digital imprint, Map division: South African Library, Cape Town, 2008. 65
Controls Land � Capital � Slaves, wheat reaped, horses Labour � Region dummies Knechts, household size Married to WH***, married to NWH*** Born abroad*** Coertzen’s dummy (seven farming families) Non-numeracy (only within FH, smaller sample) Time dummies*** 66
Skills We argue that it was because the Huguenots brought specific skills from France, skills that gave them an advantage in making wine � There was always a market for the best wines in Cape Town; ships needed wine that lasted their entire voyage, i. e. quality wine � “It must be understood that not all Cape wines are suitable for maturing. What is not good wine by nature and quality (or, as I think, has not been properly prepared) is not improved by long seasoning, but only becomes sharp and prickly as they say there. Really good, well prepared and well cellared Cape wines improve with age. ” OFM � WH produced higher quality wines, i. e. wines that would last longer These skills they protected, either � deliberately – “Many colonists at the Cape do indeed know the secret of preparing good wine, but they are not such fools as to give away their secrets” – OFM � or accidentally due to the high costs of transfer – years of learning-by-doing � Importantly: a handful of farmers at the top of the distribution drive results, protecting their skills in wine (but not wheat) production 67
Interpretations More broadly, the results also suggest: �A re-evaluation of the idea that settler groups are homogenous I. e. that it is only the conditions in the settler economy that determine their “success” � Settlers’ skills may shape the “production function” of the new settlement � A rethinking of the Engerman-Sokoloff hypothesis; with implications for long-run inequality 68
SA ECONOMIC HISTORY Johan Fourie IPSU • 2011
Mfecane Period of tribal warfare (before the collision with whites) Stronger coastal tribes (including the Zulu and Xhosa) shifted the relatively stable balance of power in the region – forced coalitions or war By the turn of the century (1800), the Mfecane had started, of continuous warfare between tribes Many areas of the country was left deserted as clans fled or were killed
Shaka Zulu Using new techniques (the bull-head technique) his reign united the tribes of Natal After his assasination in 1828 by his own brothers, he was followed by Dingane (which we meet again later)
1795 – 1806 Cape British protectorate (1795 -1803) Batavian rule (1803 -1806) British rule (1806) British colony in 1814
The eastern border Frontier farmers move to the east checked by the Xhosa Frequent Xhosa-wars, small raids between the farmers and the Xhosa, resulting in low human loss Andries Stockenstrom
1820 British settlers Due to overpopulation in England rapid increases in poverty and the unemployment rate – British government decides to send settlers to SA to anglicanize and stabilise the frontier border Many of these settlers not farmers – traders, craftsmen
1820 Settlers 80 000 applicants, 4000 arrived Settled in eastern Cape – Cradock, Grahamstown Many moved to urban areas soon after their arrival
“Die Groot Trek” The Great Trek – 1836 Who? Afrikaners Reasons: � Lack of land � Security, continuous trouble with Xhosa � Political marginalisation � Oliver Shneider: they felt that they were treated as second-class citizens
“Die Groot Trek” Logistics: � 6000 people left by 1840 (about 10% of the white population in the Cape Colony) � By 1845, 15000 Afrikaners and 5000 servants had left � Traveling in groups with one leader: Hendrik Potgieter (Tarka), Gerrit Maritz (Graaff Reinet), Piet Uys (Uitenhage)
“Die Groot Trek” Extremely dangerous: � Battle of Vegkop: 35 trekkers vs. 6000 Ndebele warriors – only 2 trekkers were killed, but they lost all their cattle Inter-Trekker rivalry � Destination unknown: Potgieter wanted to go to the North, Piet Retief to Natal
Piet Retief Typified as the “hero” of the Afrikaners Very little on his CV suggests hero status He, and his party was killed by Dingane when trying to sign treaty in 1838
“Bloedrivier” The Trekkers (only called Voortrekkers after 1880) were motivated by the fact that Zulu chief Dingane ka. Senzangakhona had killed one of their leaders, Piet Retief, after negotiating a treaty with him. Dingane's impis had also attacked Voortrekker encampments, killing an estimated 500 women, children, and men, including servants, most notably at Blaukraans.
“Bloedrivier”
“Bloedrivier” After two hours and four waves of attack, Pretorius ordered a group of horsemen to leave the encampment and engage the Zulu in order to disintegrate their formations. The Zulu withstood the charge for some time, but rapid losses led them to scatter Cilliers noted later that " 'we left the Kafirs lying on the ground as thick almost as pumpkins upon the field that has borne a plentiful crop”
By the 1860 s Large parts of South Africa had been settled by white farmers – many of them very poor Cape Town and areas close to it had developed rapidly since the establishment of British rule But in 1867 something happened that would set the future of South Africa on a totally different course…
1867 - 1899 Diamonds (1867) � Kimberley founded Gold (1886) � Johannesburg Massive shift in economic power of South Africa � Severe founded political, cultural and social consequences Results in Anglo-Boer War
Before the war 1894 – Glen Grey Act 1896 – Jameson Raid 1899 – Anglo-Boer War begins
After the war South Africa becomes Union in 1910 Free-market policy until 1924 Pact-government of Hertzog – more government involvement Industrialisation Poor white problem Great depression Afrikaner nationalism Second World War
LESSONS FROM THE POOR WHITE PROBLEM FOR BLACK POVERTY TODAY Johan Fourie IPSU • 2011
Overview Introduction Depth and severity of the problem Causes of poverty Economic growth Solutions to poverty Two important lessons � More successful � Less successful Policy proposals Conclusions 88
Introduction The “discovery” of poor whitism by the turn of the century Major economic, political and social crisis by the 1930 s Due to various reasons, poor whitism largely eradicated in five decades Black poverty is major economic, political and social problem Again a number of policies have been implemented to address the problem What can we learn from the poor white experience of the 1930 s? 89
Depth and severity Poor quantitative sources make comparisons difficult (Carnegie report does present us with some useable info) Data about poor whites in Natal Result: Black poverty is today much larger and more severe than white Class poverty 1930 s 1 of the Class 2 Class 3 (R 3571) (R 7143) (R 10714) White poverty (Carnegie 1932) 19. 35% 60. 22% 83. 33% Black poverty (AMPS 2000) 59. 32% 84. 41% 94. 74% 90
Causes of poverty Many reasons for poor white problem � Including poor education system � Urbanisation � The Anglo-Boer War � Livestock losses � Droughts � Culture and language differences � Government policy Compare with reasons for black poverty today � Poor education system � Urbanisation � Culture and language differences � Government policy 91
Economic growth 92
Solutions Various government policies to eradicate white poverty � Includes an improved education system � Higher social spending � Industrialisation � A repressive and discriminatory labour system Government policies to eradicate black poverty today � Improving education and skills training � High social spending � Infrastructure and industry development � A discriminatory labour system 93
Two important lessons Most important factor that contributed to the eradication of white poverty before 1970 was the high economic growth rates achieved in SA For the poor to participate in this higher economic growth, government policies was necessary 94
Successful government policies Improvement in both the quantity and quality of education Higher social transfers to the poor to ensure a basic living standard Protection of property rights in cities for poor whites A programme of industrialisation – such as the founding of ESCOM (1923) and ISCOR (1928) 95
Less successful government policies The discriminatory labour legislation after 1924 that intended to protect white workers This legislation, labeled “temporary discrimination by Verwoerd in 1934, did little to alleviate white poverty 96
Policy proposals for government today Possible policy strategies to implement: � Improve the quality of education (and the institutional culture, maybe through cooperation from NGO’s or churches). � Provide property rights to the poor (on the land which they already live on, not land redistribution as practiced today) � Develop high-technology industries and economic infrastructure – such as investment in broadband biodiesel � Relax labour laws 97
Concluding remarks Where Afrikaner nationalists proclaimed 40 years after the poor white problem that the nation was cured by its own policies, it is not entirely true Economic growth (and the potential to make use of that growth) is what saved the poor white Similarly, BBEE (Broad-based Black Economic Empowerment) will not solve the massive black poverty problem The government can only implement strategies to ensure that a large part of the poor population will benefit from higher economic growth 98
TWENTIETH CENTURY Johan Fourie IPSU • 2011
After the war South Africa becomes Union in 1910 Free-market policy until 1924 Pact-government of Hertzog – more government involvement Industrialisation Poor white problem Great depression Afrikaner nationalism Second World War
1948 Election victory for Afrikaners – NP wins parliament (with little more than 40% of the votes) Little quirks of history – Smuts and Cambridge DF Malan head NP – rapid changes follows
7 decades of economic performance
Policy of Apartheid Groups Act (1950) Bantu Education (1954) Homelands (1956) 1958 – Hendrik Verwoerd becomes prime minister
1960 s – Great Apartheid 1960 – Sharpeville, Winds of Change, Referendum 1961 – Republic of South Africa 1963 – Rivonia trial 1966 – Hendrik Verwoerd assassinated
Rough and tumble decades 1972/73 – Oil crisis, first strikes (Durban) 1976 – Soweto uprising 1977 – Steve Biko dies in prison
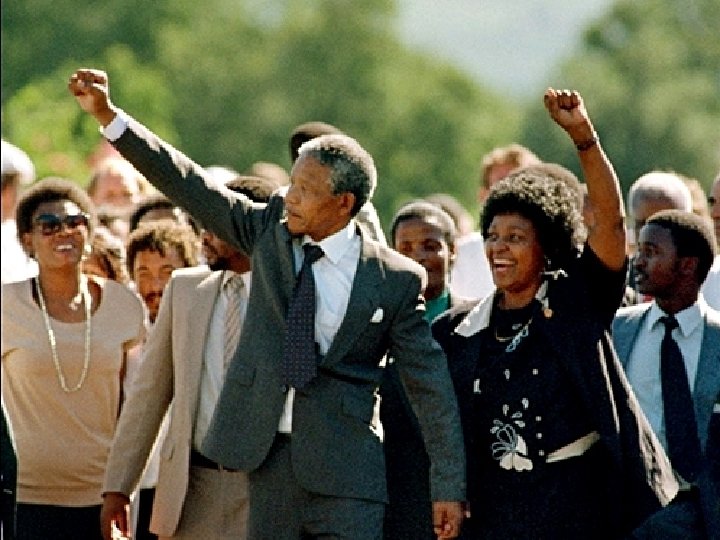
Rough and tumble decades 1985 – Rubicon speech (PW Botha) 1990 – FW de Klerk releases Mandela
Instability before 1994 1990 – ANC unbanned 14 000 – 16 000 people die between 1990 and 1994, mostly in fightings between ANC and Inkatha members Chris Hani assassinated (1993)
1994 first democratic elections