
Border Region Data collection Johan van der Valk
Border Region Data collection Johan van der Valk Statistics Netherlands
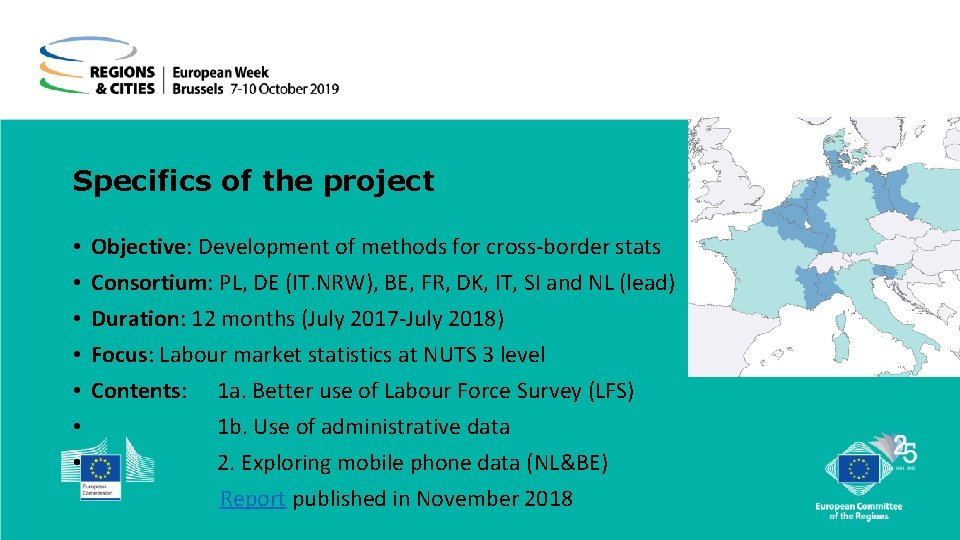
Specifics of the project • • Objective: Development of methods for cross-border stats Consortium: PL, DE (IT. NRW), BE, FR, DK, IT, SI and NL (lead) Duration: 12 months (July 2017 -July 2018) Focus: Labour market statistics at NUTS 3 level Contents: 1 a. Better use of Labour Force Survey (LFS) 1 b. Use of administrative data 2. Exploring mobile phone data (NL&BE) Report published in November 2018
LFS: available but of limited use ØNUTS 3 estimates on f. i. Unemployment rate not reliable in (larger) countries like DE, FR, PL ØOther indicators on structures (like employment rates) possible but not much added value compared with readily available NUTS 2 data ØUsing NUTS 3 regions as building blocks to generate larger (border) regions has potential
Admin data and Mobile phone data • Administrative data • Provides interesting information • is available and directly usable • Data collection can be arranged • Mobile phone data • Powerful information • Not yet directly accessible • Methods require further development
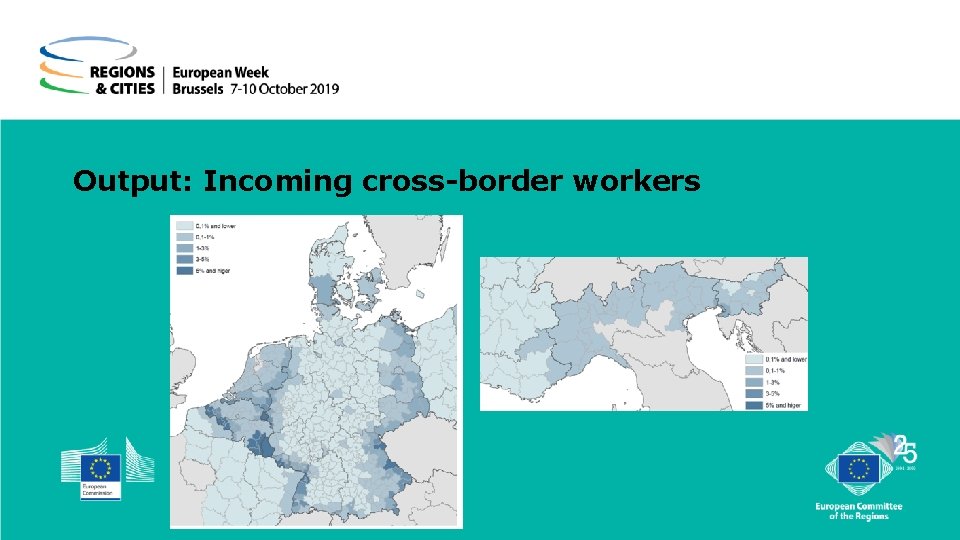
Output: Incoming cross-border workers
Successful project? Project proves: 1. valuable cross-border labour market information can be produced for the countries involved 2. Statistical institutes are willing to cooperate in the context of crossborder data 3. Statistical institutes are able to produce data with limited resources
And where to go to next?
Users vs Producers of cross-border data • Users • Diverse • Different region levels (local, regional, national and international) • Producers • NSI’s • National level (mainly)
SI’s should cover production of x-border stats • Why? • Methods should be harmonised (inter)nationally • Is efficient using existing data and expertise • Best equipped for setting up a sustainable system • For national stakeholders cross-border data is required • Stop depicting a country as an island! • Fits into mandate of the European Statistical System
Consequences of including x-border statistics • Substantial enlargement of their scope • Involves extra work and resources • Requires international coordination • Should be financed within the national statistical systems • SI’s should start discussions
What we would need? • Network of statisticians responsible for cross-border statistics (within ESS, with international orgs) • Structural dataset of basic indicators for border regions • Internet tool for aggregating and presenting data for cross-border regions • Database of detailed information available for specific local research projects
How do we get there? • Make use of existing data and infrastructures • Use strategy of constructive collaboration • Start with small group of volunteering SI’s • Cooperating with stakeholders and relevant organisations • Aligned with other initiatives • Meeting exchanging practices
Conclusion • Cross-border data is desperately needed • We can start a process to produce cross-border statistics in a sustainable way • Several statistical offices and countries are willing pick up the gauntlet • We have momentum now, don’t waste it!
- Slides: 13