
KI 2 7 Clustering Algorithms Johan Everts Kunstmatige
- Slides: 42
KI 2 - 7 Clustering Algorithms Johan Everts Kunstmatige Intelligentie / Ru. G 1
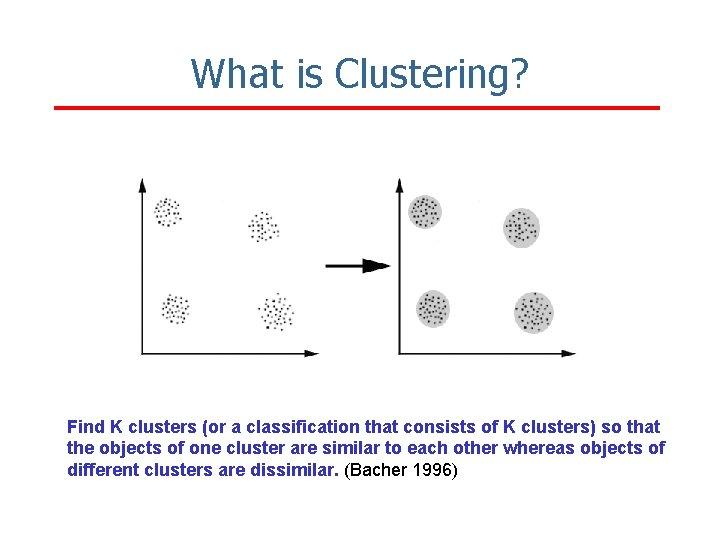
What is Clustering? Find K clusters (or a classification that consists of K clusters) so that the objects of one cluster are similar to each other whereas objects of different clusters are dissimilar. (Bacher 1996)
The Goals of Clustering n n Determine the intrinsic grouping in a set of unlabeled data. What constitutes a good clustering? All clustering algorithms will produce clusters, regardless of whether the data contains them There is no golden standard, depends on goal: n n data reduction “natural clusters” “useful” clusters outlier detection
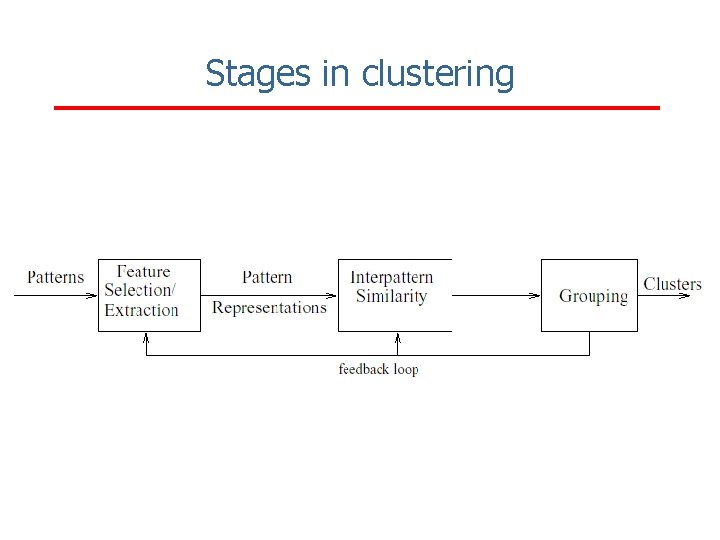
Stages in clustering
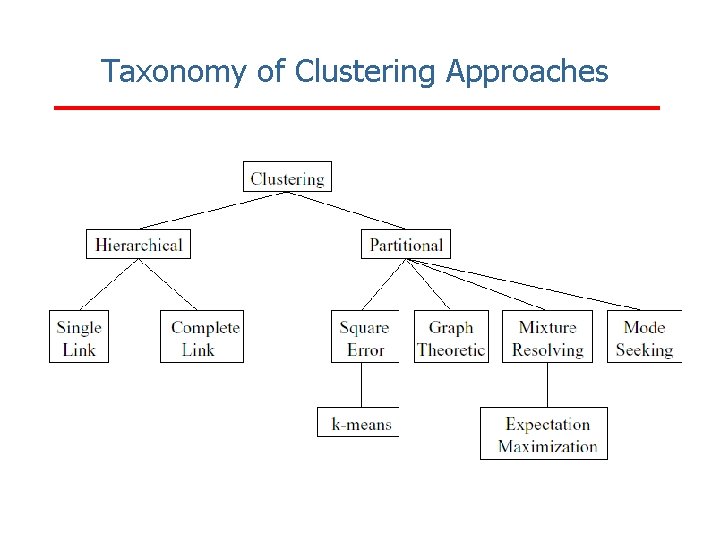
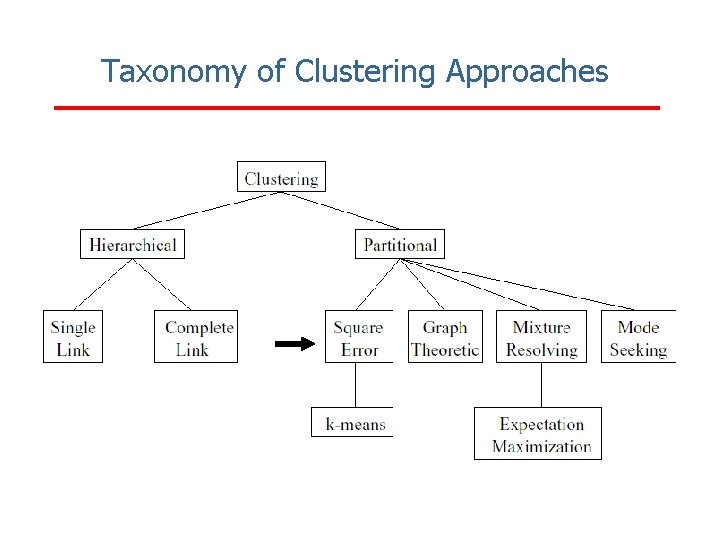
Taxonomy of Clustering Approaches
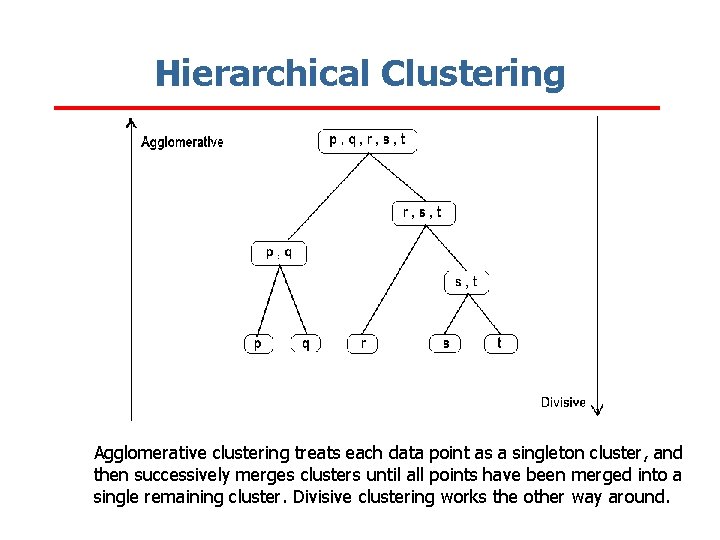
Hierarchical Clustering Agglomerative clustering treats each data point as a singleton cluster, and then successively merges clusters until all points have been merged into a single remaining cluster. Divisive clustering works the other way around.
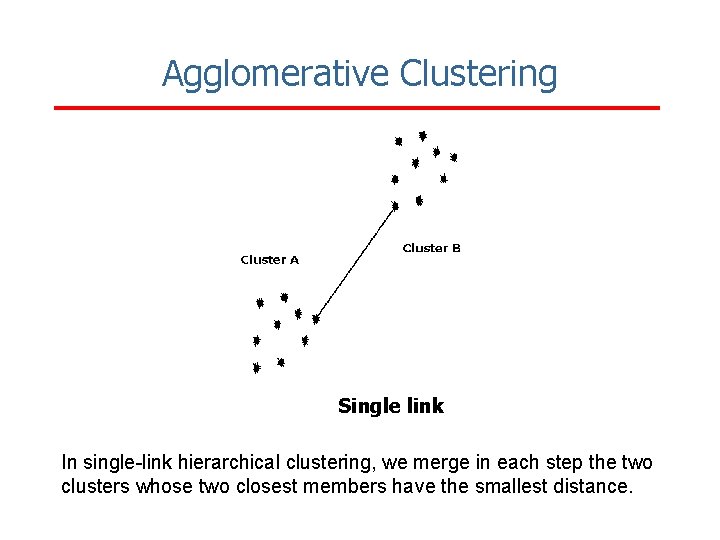
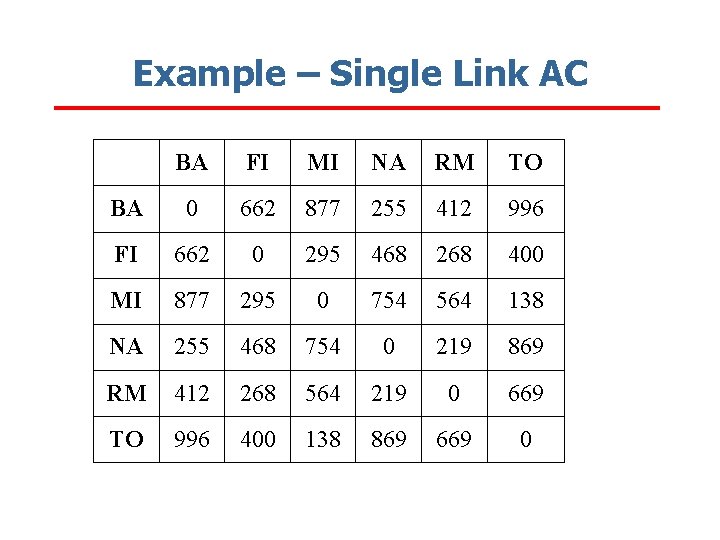
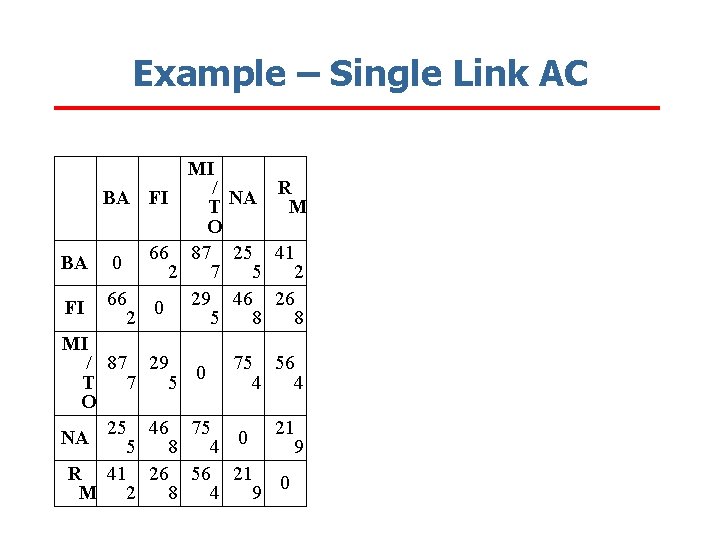
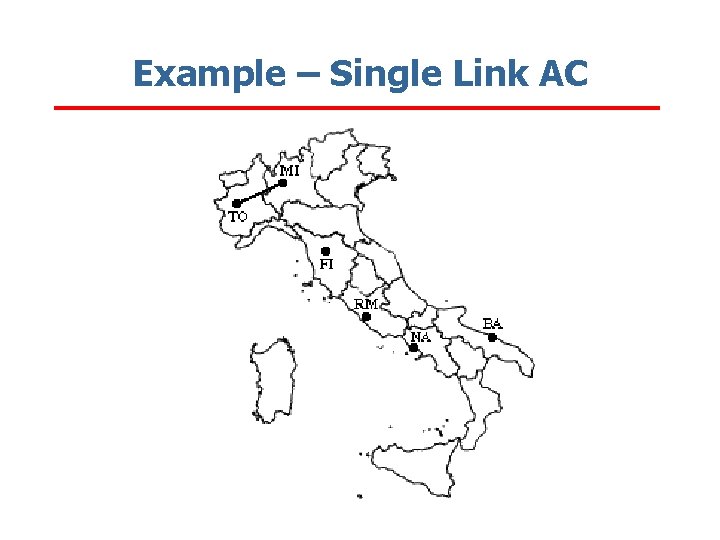
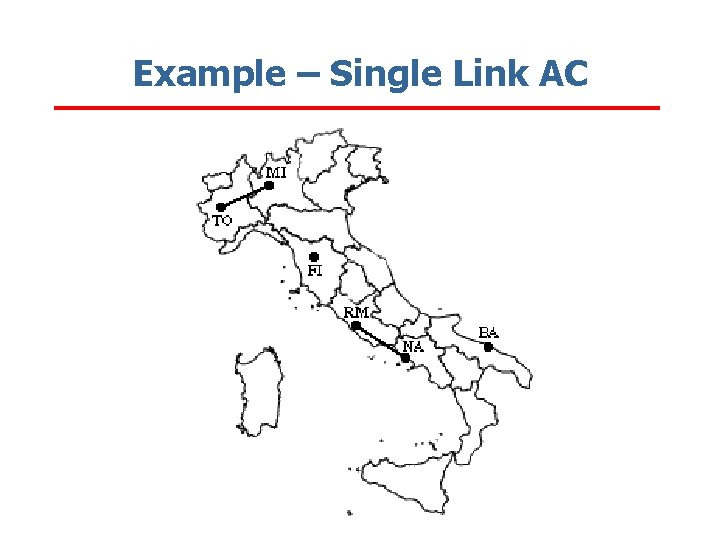
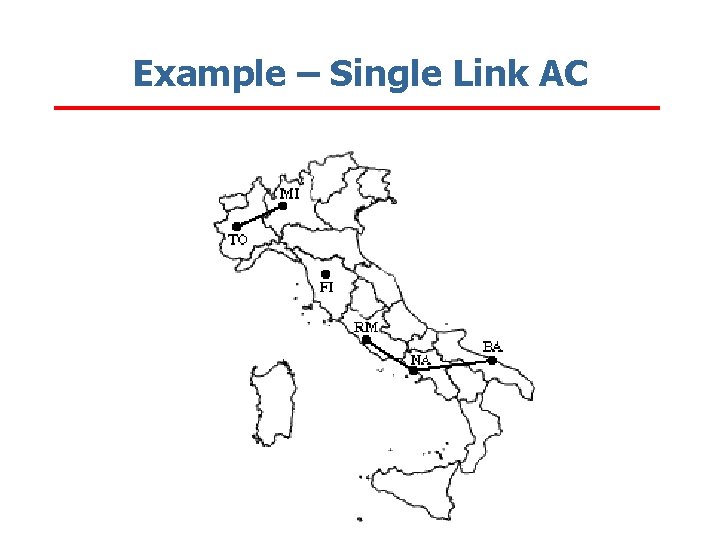
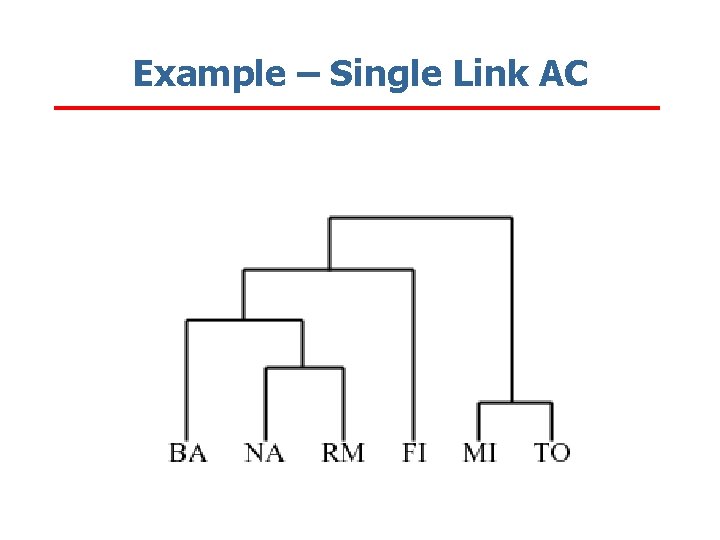
Agglomerative Clustering Single link In single-link hierarchical clustering, we merge in each step the two clusters whose two closest members have the smallest distance.
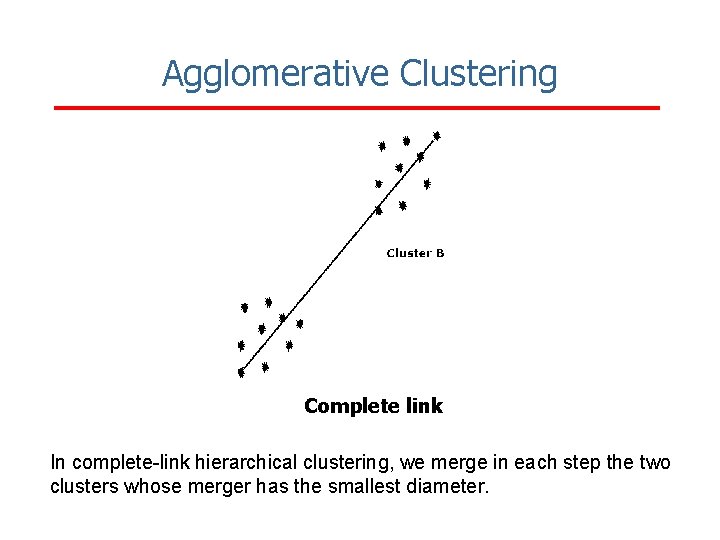
Agglomerative Clustering Complete link In complete-link hierarchical clustering, we merge in each step the two clusters whose merger has the smallest diameter.
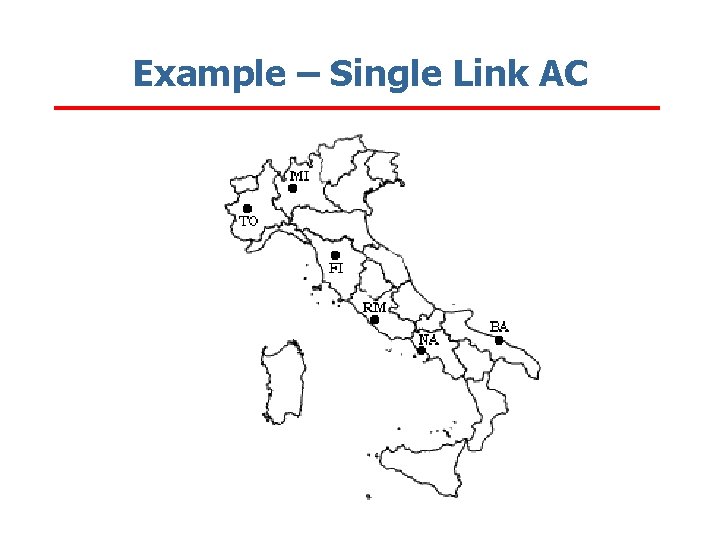
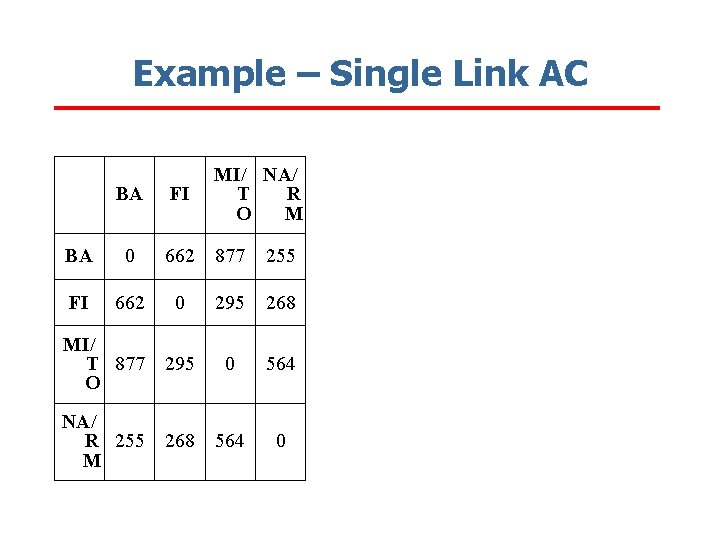
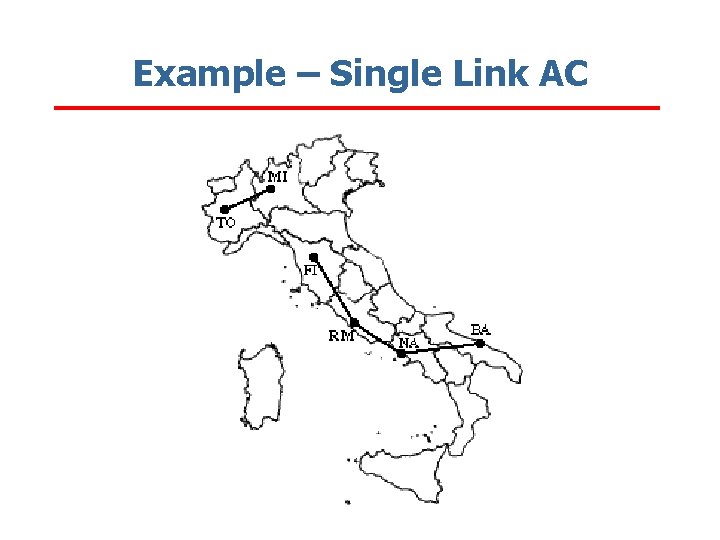
Example – Single Link AC BA FI MI NA RM TO BA 0 662 877 255 412 996 FI 662 0 295 468 268 400 MI 877 295 0 754 564 138 NA 255 468 754 0 219 869 RM 412 268 564 219 0 669 TO 996 400 138 869 669 0
Example – Single Link AC
Example – Single Link AC MI / NA R BA FI T M O BA 0 662 877 255 412 FI 662 0 295 468 268 MI / 87 29 0 75 56 T 7 5 4 4 O NA 255 468 754 0 219 R 41 26 56 21 0 M 2 8 4 9
Example – Single Link AC
Example – Single Link AC BA FI MI/ NA/ T R O M BA 0 662 877 255 FI 662 0 295 268 MI/ T 877 O 295 0 564 NA/ R 255 M 268 564 0
Example – Single Link AC
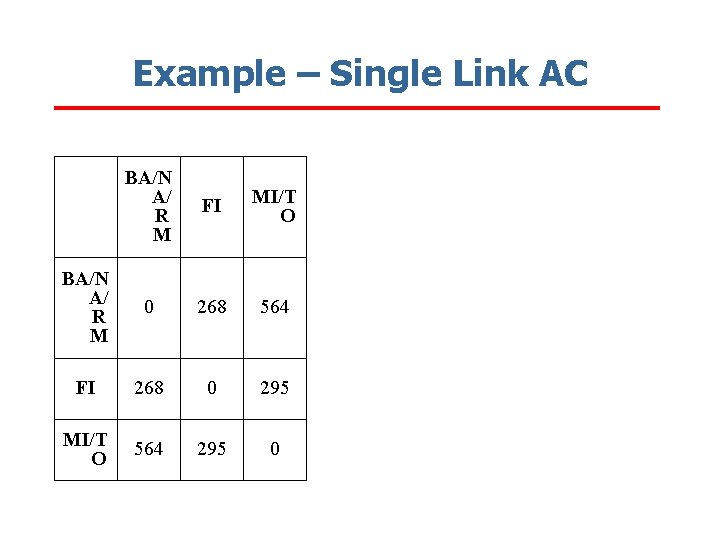
Example – Single Link AC BA/N A/ R M FI MI/T O BA/N A/ R M 0 268 564 FI 268 0 295 MI/T O 564 295 0
Example – Single Link AC
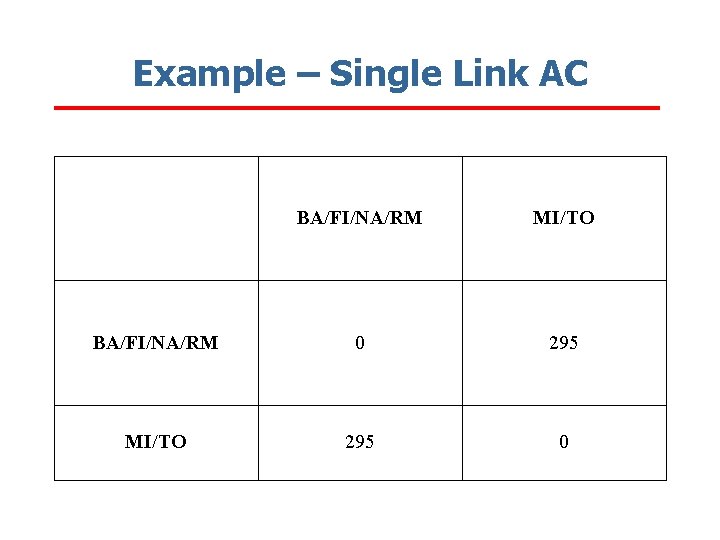
Example – Single Link AC BA/FI/NA/RM MI/TO BA/FI/NA/RM 0 295 MI/TO 295 0
Example – Single Link AC
Example – Single Link AC
Taxonomy of Clustering Approaches
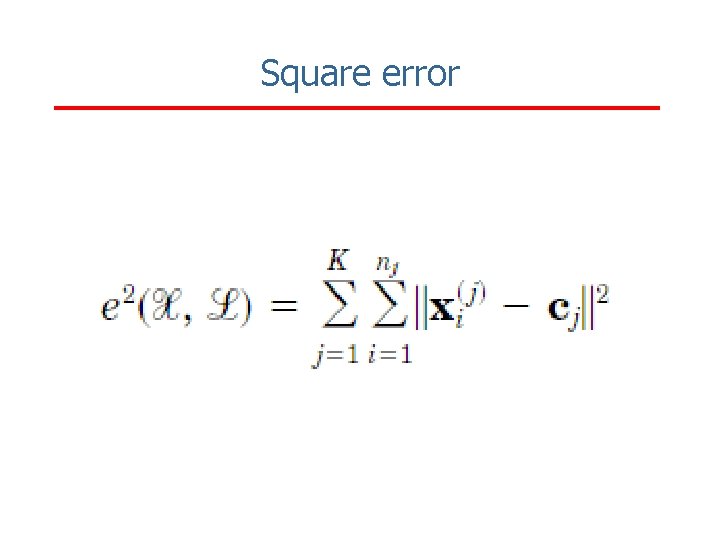
Square error
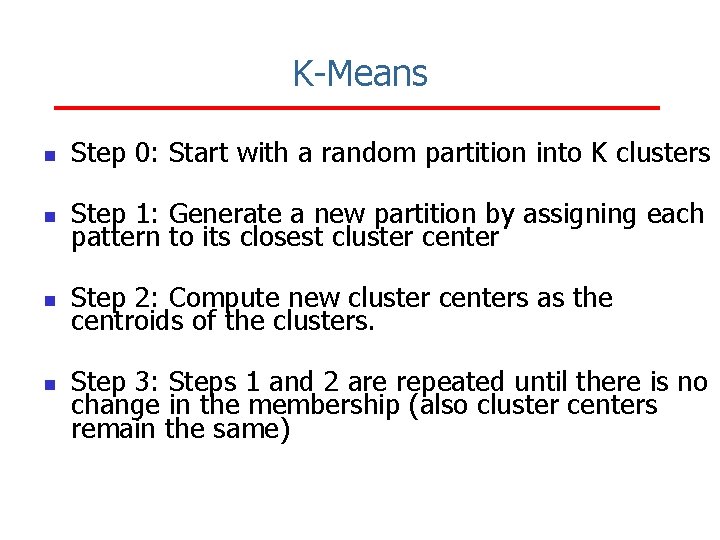
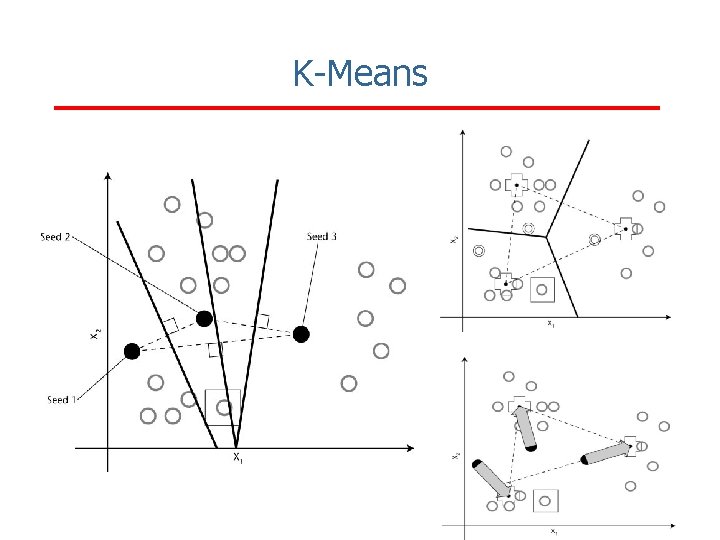
K-Means n Step 0: Start with a random partition into K clusters n Step 1: Generate a new partition by assigning each pattern to its closest cluster center n Step 2: Compute new cluster centers as the centroids of the clusters. n Step 3: Steps 1 and 2 are repeated until there is no change in the membership (also cluster centers remain the same)
K-Means
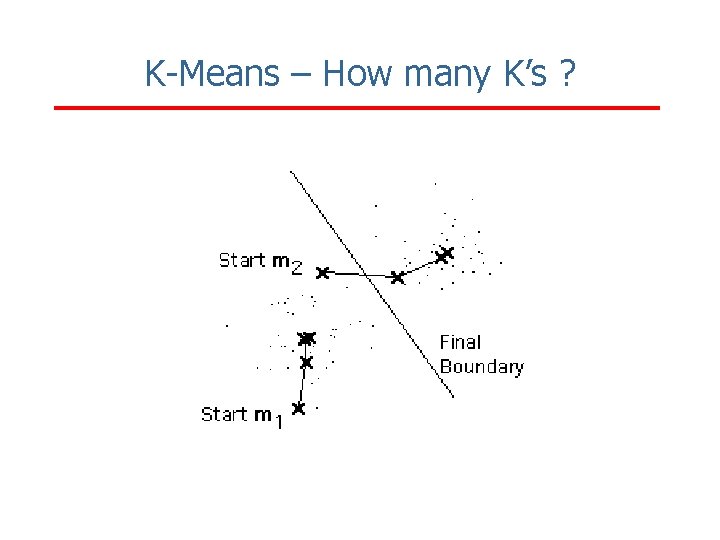
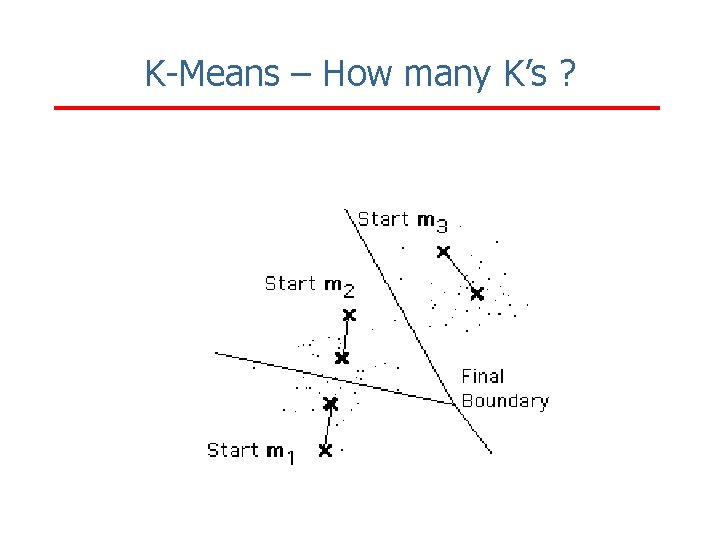
K-Means – How many K’s ?
K-Means – How many K’s ?
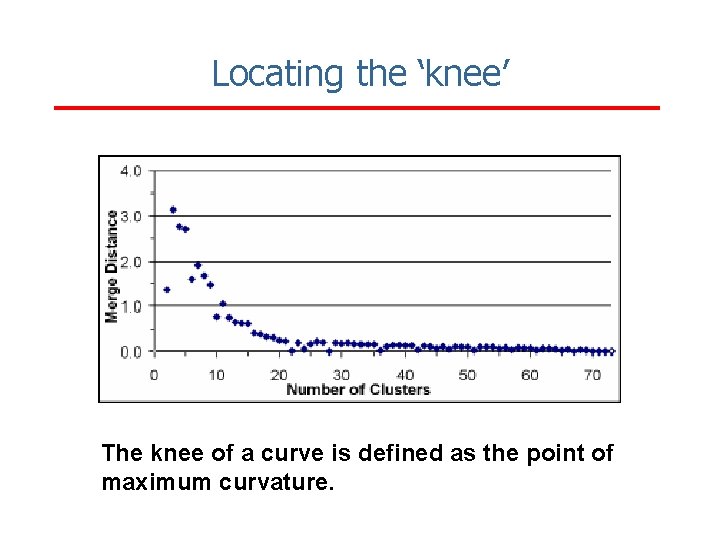
Locating the ‘knee’ The knee of a curve is defined as the point of maximum curvature.
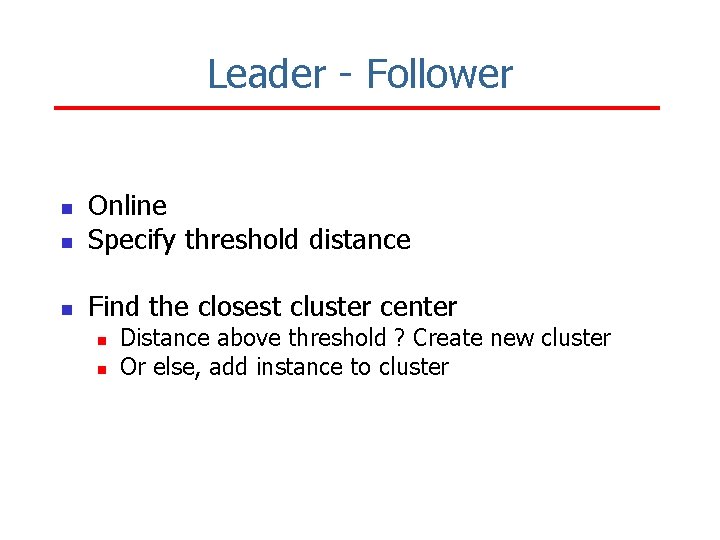
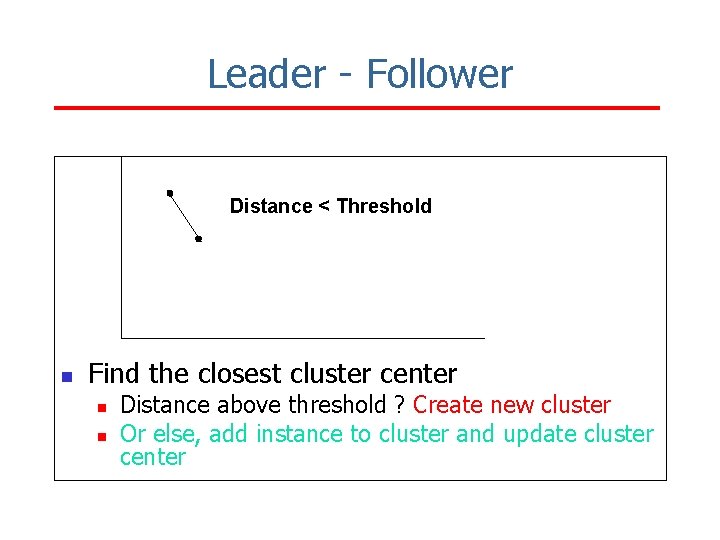
Leader - Follower n Online Specify threshold distance n Find the closest cluster center n n n Distance above threshold ? Create new cluster Or else, add instance to cluster
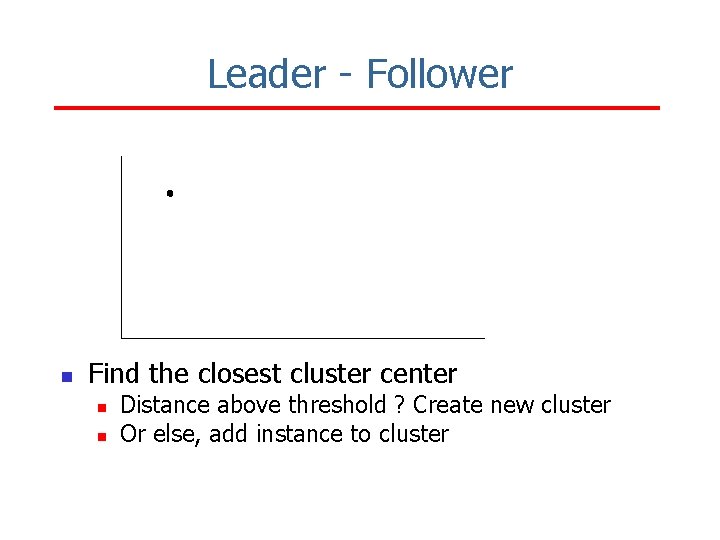
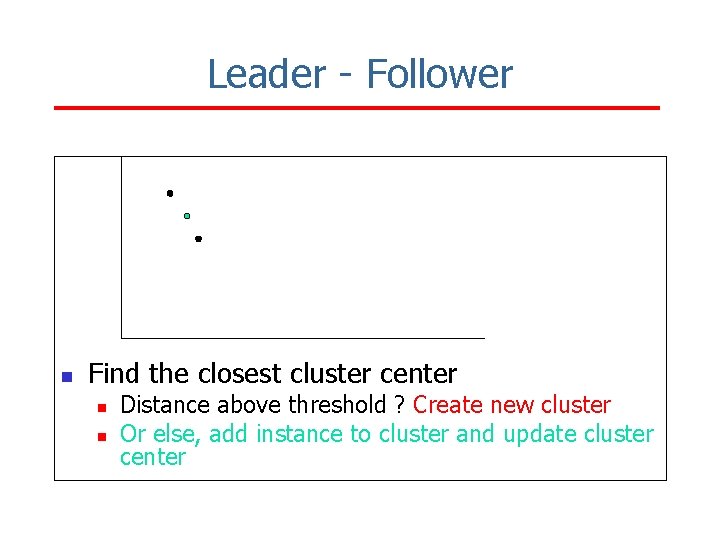
Leader - Follower n Find the closest cluster center n n Distance above threshold ? Create new cluster Or else, add instance to cluster
Leader - Follower Distance < Threshold n Find the closest cluster center n n Distance above threshold ? Create new cluster Or else, add instance to cluster and update cluster center
Leader - Follower n Find the closest cluster center n n Distance above threshold ? Create new cluster Or else, add instance to cluster and update cluster center
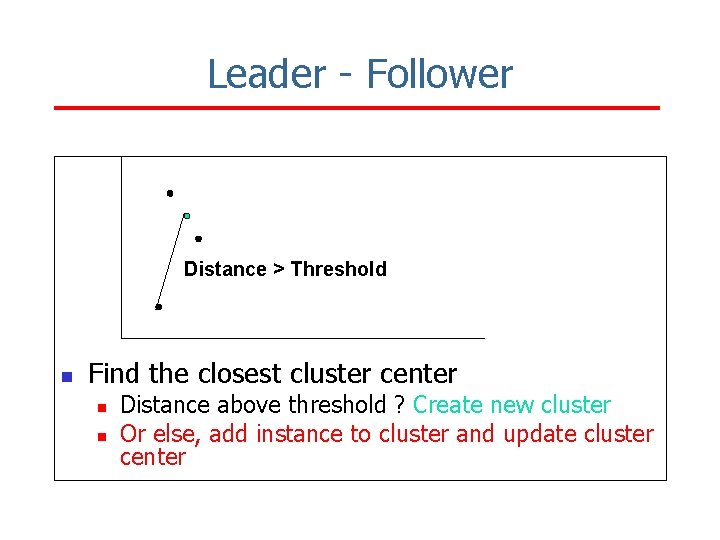
Leader - Follower Distance > Threshold n Find the closest cluster center n n Distance above threshold ? Create new cluster Or else, add instance to cluster and update cluster center
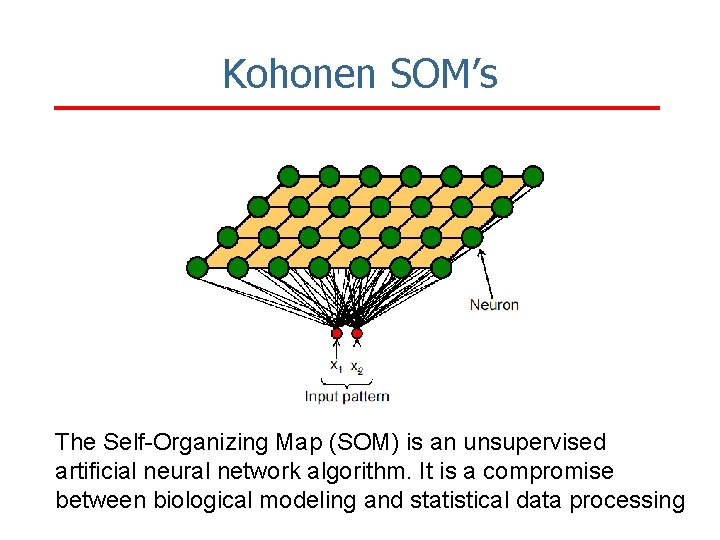
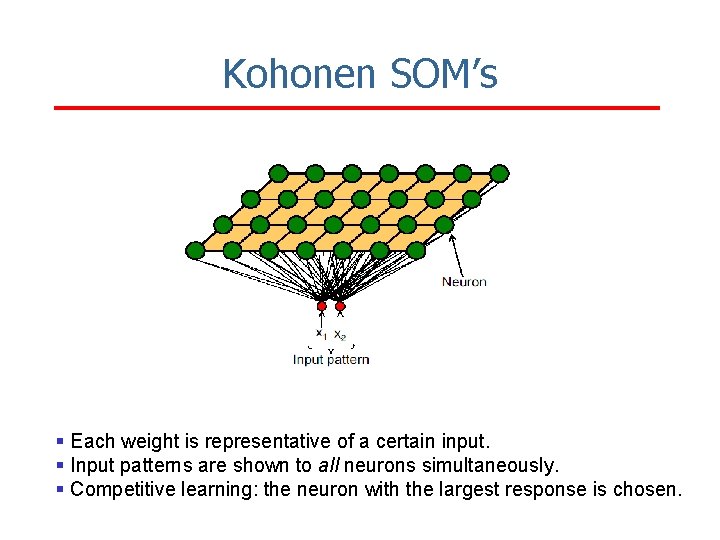
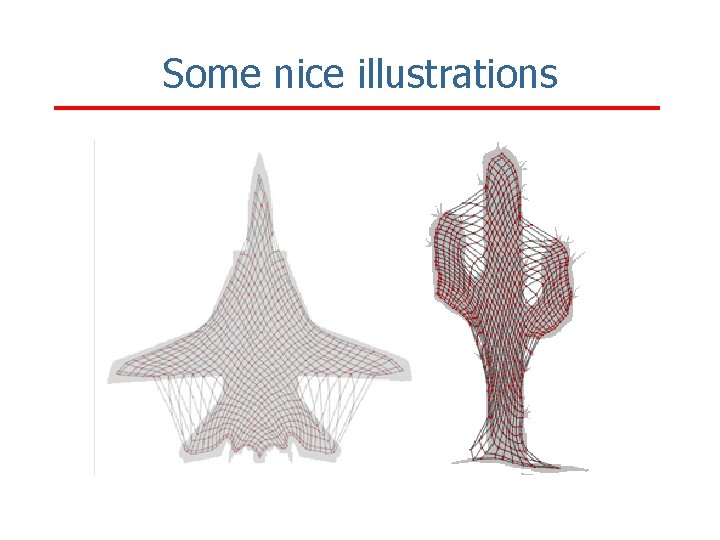
Kohonen SOM’s The Self-Organizing Map (SOM) is an unsupervised artificial neural network algorithm. It is a compromise between biological modeling and statistical data processing
Kohonen SOM’s § Each weight is representative of a certain input. § Input patterns are shown to all neurons simultaneously. § Competitive learning: the neuron with the largest response is chosen.
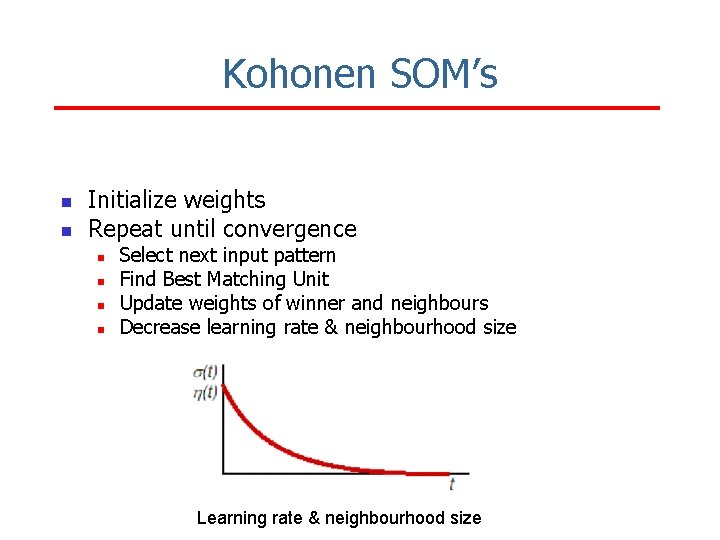
Kohonen SOM’s n n Initialize weights Repeat until convergence n n Select next input pattern Find Best Matching Unit Update weights of winner and neighbours Decrease learning rate & neighbourhood size Learning rate & neighbourhood size
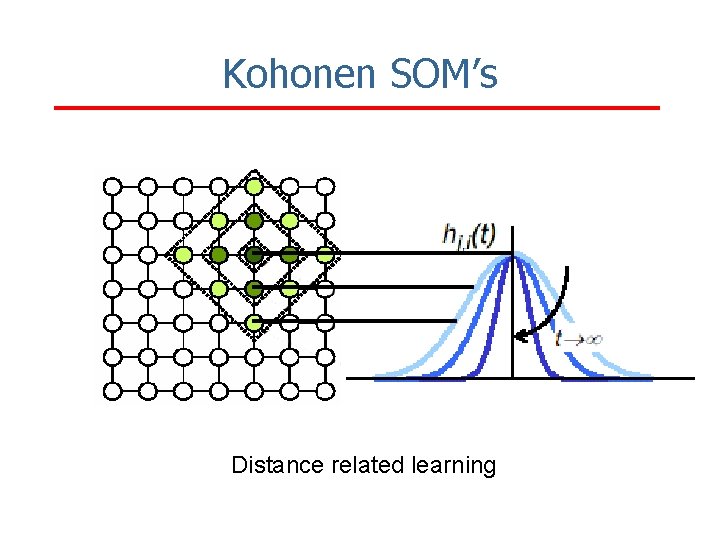
Kohonen SOM’s Distance related learning
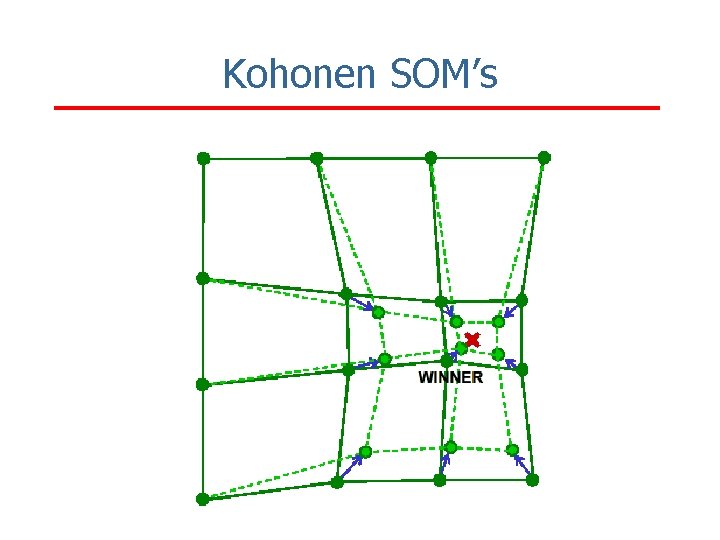
Kohonen SOM’s
Some nice illustrations
Kohonen SOM’s n Kohonen SOM Demo (from ai-junkie. com): mapping a 3 D colorspace on a 2 D Kohonen map
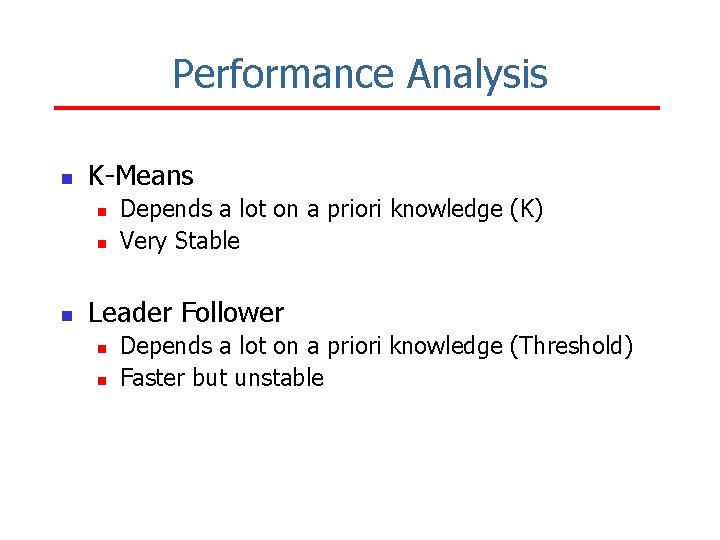
Performance Analysis n K-Means n n n Depends a lot on a priori knowledge (K) Very Stable Leader Follower n n Depends a lot on a priori knowledge (Threshold) Faster but unstable
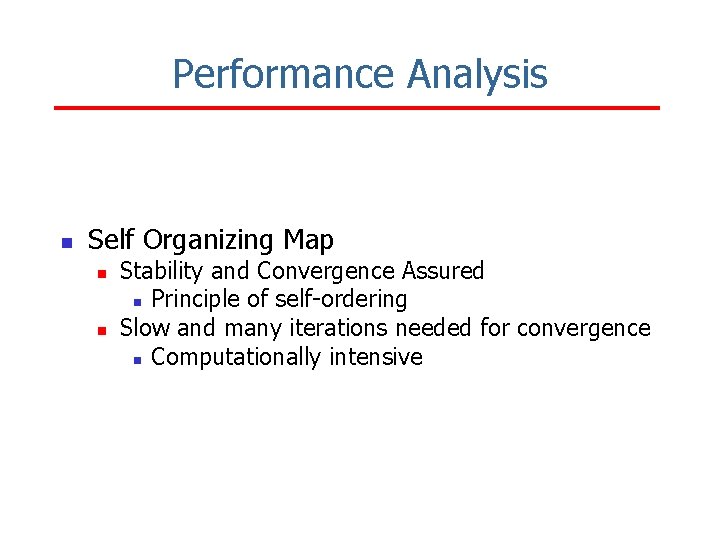
Performance Analysis n Self Organizing Map n n Stability and Convergence Assured n Principle of self-ordering Slow and many iterations needed for convergence n Computationally intensive
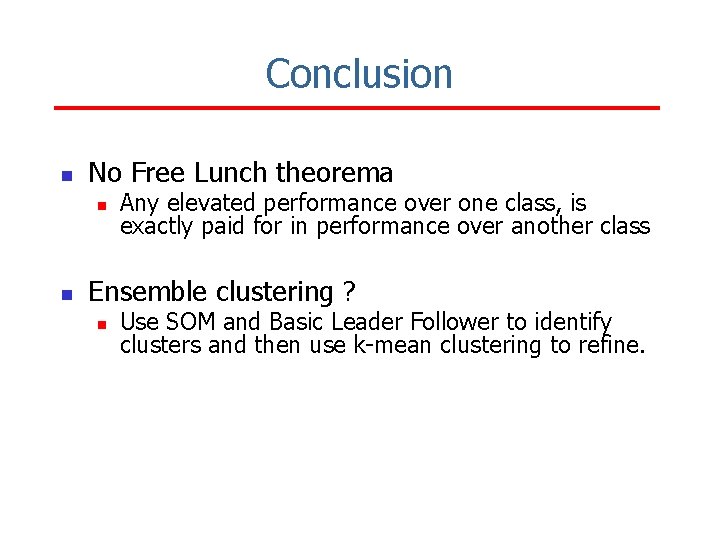
Conclusion n No Free Lunch theorema n n Any elevated performance over one class, is exactly paid for in performance over another class Ensemble clustering ? n Use SOM and Basic Leader Follower to identify clusters and then use k-mean clustering to refine.
Any Questions ? ?