The University of Mississippi INCLUSIVE EXCELLENCE Addressing Diversity


 • Women • Persons with Disabilities")
 • NSF Groups +")
 • NSF + NIMH •")


 is")


 of new UM undergraduate")


, 2018 -2019 – 53% of all faculty TT/ Tenured")


 • The representation of African American faculty to")


 to consult")


- Slides: 60
The University of Mississippi INCLUSIVE EXCELLENCE: Addressing Diversity, Equity, and Inclusion in Grant Proposals Division of Diversity and Community Engagement
Presentation Outline • • Foundational Concepts Understanding Our Context Roadmap to Addressing DEI in Grant Writing Best Practices
Projects Advancing Diversity, Equity, and Inclusion: Key Questions to Consider & Answer in your Proposal 1. What “problem” has the sponsor identified that needs to be addressed? • What are the key concerns raised by the sponsor? • Who is your audience, and what do they care about? 2. Which underrepresented groups will be chosen for inclusion? • What groups does the grantor include in its definition of underrepresented? • What is the rationale for targeting these groups in particular? • What is the local context? (cite institutional or local documents) • What (local, regional, national) disparities exist for these groups? (cite data or research) • What are the key challenges? (cite data and/or research) 3. How are you uniquely qualified to address this problem? • Be specific-What is the evidence of your past track record of success working on this problem? • How have you engaged these groups in the past? What did you learn from that experience?
Projects Advancing Diversity, Equity, and Inclusion: Key Questions to Consider & Answer in your Proposal 4. What is your plan to address the “problem” identified? • Is it a diversity, equity, and/inclusion “problem”? • What will be your approach to reduce disparities, and why? – – Does it build on what has been shown to be successful? Cite. Is it attempting something innovative? Explain. • How will you recruit and legally select participants to maximize diversity? – • • • From what communities? How will you reach them? Do you have committed partners? Do you have a track record yet? What activities will the participants be involved in, and why? How will participants benefit? How will project advance/disseminate knowledge on reducing disparities? What quantifiable performance metrics will you use? How will you assess success or failure?
Foundational Concepts
DIVERSITY The term is often used to include aspects of group (race, ethnicity, gender, sexual orientation, class) and individual identities (talents, skills, perspectives) The term simply describes the presence of individuals from various backgrounds and/or with various identities.
EQUITY Addresses justice, impartiality, and fairness within the procedures, processes, and distribution of resources. Understanding the underlying or root causes of outcome disparities caused by institutions or systems. This includes elimination of policies, practices, attitudes and cultural messages that reinforce or fail to eliminate differential outcomes by group identity/background.
INCLUSION Authentically brings the perspectives and contributions of all people to the table, equitably distributes power, and incorporates their needs, assets and perspectives into the design and implementation of processes, policies, activities, and decision-making.
EQUITY DIVERSITY Power People Ø Ø Ø # of racial minority students # of women students # of LGBTQ+ students # of students with disabilities # of students with children # of international students Ø Ø Ø INDIVIDUAL, RECRUITMENT, INCREASED ACCESS AND OPPORTUNITY INCLUSION % of women students in key student leadership roles % of racial minority students in debt % of racial minority students receiving full-tuition scholarship Amount of research support for female students Childcare Accommodations for students with Disabilities INSTITUTIONAL, RETENTION, PERSISTENCE, REMOVE INSTITUTIONAL BARRIERS, DECREASE DISPARITIES Participation Ø Ø Ø Ø Childcare Community spaces for LGBTQ+ students Addressing classroom climate Work-Life Balance Ensuring Project/Team Equity Ensuring equitable participation in High Impact Practices Avoid Isolating/Singling-Out Micro-aggressions CLIMATE, INDIVIDUAL AND INSTITUTIONAL, TREATMENT, TARGETING BEHAVIOR, DECISION MAKING
Definition - Underrepresented Groups National Science Foundation (NSF) • Women • Persons with Disabilities • Underrepresented minorities – Black/African American – American Indian – Alaskan Native – Hispanic (including persons of Mexican, Puerto Rican, Cuban, and Central or South American origin) – Pacific Islander • U. S. citizen and permanent resident • Identification of a particular group as underrepresented may vary by discipline (e. g. , women are underrepresented in many STEM fields; Asian Americans in social science and humanities fields. ) (https: //www. nsf. gov/mps/dmr/diversity. jsp)
Definition - Underrepresented Groups National Institute of Mental Health (NIMH) • NSF Groups + • Individuals from disadvantaged backgrounds – Individuals who come from a family with an annual income below established low-income thresholds. These thresholds are based on family size, published by the U. S. Bureau of the Census; adjusted annually for changes in the Consumer Price Index; and, adjusted by the Secretary for use in all health professions programs. The Secretary of Health and Human Services (HHS) periodically publishes these income levels at http: //aspe. hhs. gov/poverty/index. shtml. – Individuals who come from an educational environment such as that found in certain rural or inner-city environments that has demonstrably and directly inhibited the individual from obtaining the knowledge, skills, and abilities necessary to develop and participate in a research career. – The disadvantaged category refers to the financial and educational status of individuals while residing in the United States and is only applicable to programs focused on high school and undergraduate candidates.
Definition - Underrepresented Groups National Institute of Health (NIH) • NSF + NIMH • Individuals from disadvantaged backgrounds, defined as those who meet two or more of the following criteria: – Were or currently are homeless, as defined by the Mc. Kinney-Vento Homeless Assistance Act (Definition: https: //nche. ed. gov/mckinney-vento/); – Were or currently are in the foster care system, as defined by the Administration for Children and Families (Definition: https: //www. acf. hhs. gov/cb/focus-areas/foster-care); – Were eligible for the Federal Free and Reduced Lunch Program for two or more years (Definition: https: //www. fns. usda. gov/school-meals/income-eligibility-guidelines); – Have/had no parents or legal guardians who completed a bachelor’s degree (see https: //nces. ed. gov/pubs 2018/2018009. pdf); – Were or currently are eligible for Federal Pell grants (Definition: https: //www 2. ed. gov/programs/fpg/eligibility. html); – Received support from the Special Supplemental Nutrition Program for Women, Infants and Children (WIC) as a parent or child (Definition: https: //www. fns. usda. gov/wic-eligibility-requirements). – Grew up in one of the following areas: a) a U. S. rural area, as designated by the Health Resources and Services Administration (HRSA) Rural Health Grants Eligibility Analyzer, or b) a Centers for Medicare and Medicaid Services-designated Low-Income and Health Professional Shortage Areas (qualifying zipcodes are included in the file). Only one of the two possibilities listed can be used as a criterion for the disadvantaged background definition. https: //diversity. nih. gov/about-us/population-underrepresented
Definition - Underrepresented Groups TRIO • • NSF Racial/Ethnic Minority Groups First generation college student – (A) an individual both of whose parents did not complete a baccalaureate degree; or – (B) in the case of any individual who regularly resided with and received support from only one parent, an individual whose only such parent did not complete a baccalaureate degree. Low-income individual – The term “low-income individual” means an individual from a family whose taxable income for the preceding year did not exceed 150 percent of an amount equal to the poverty level determined by using criteria of poverty established by the Bureau of the Census. Veteran eligibility – No veteran shall be deemed ineligible to participate in any program under this division by reason of such individual's age who— – (A) served on active duty for a period of more than 180 days and was discharged or released therefrom under conditions other than dishonorable; – (B) served on active duty and was discharged or released therefrom because of a service connected disability; – (C) was a member of a reserve component of the Armed Forces called to active duty for a period of more than 30 days; or – (D) was a member of a reserve component of the Armed Forces who served on active duty in support of a contingency operation (as that term is defined in section 101(a)(13) of title 10) on or after September 11, 2001.
Understanding Our Landscape
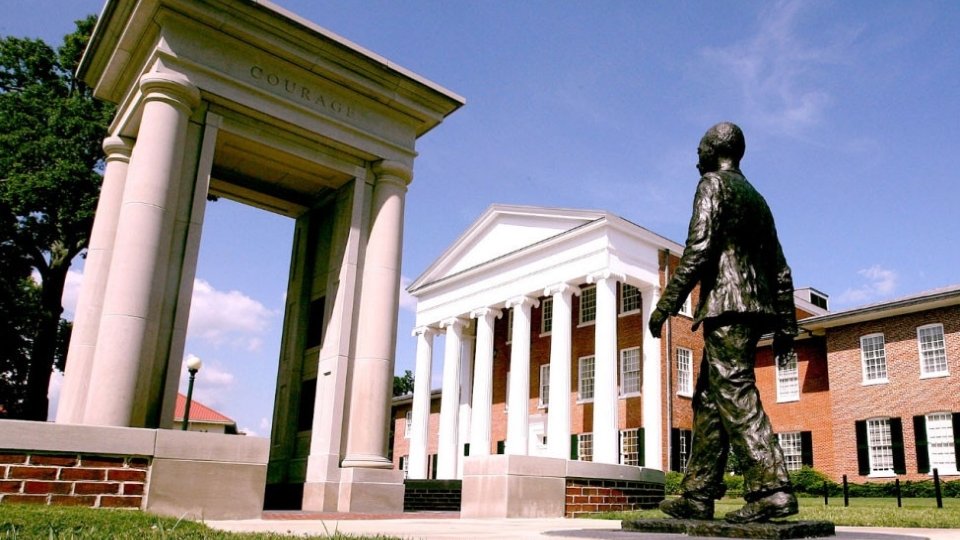
Our State and Institutional History The University of Mississippi is actively pursuing inclusive excellence through major institutional change in a state recognized for persistent poverty and racial inequality. For decades after the violently protested integration of UM in 1962, individual faculty and administrators have worked to create an inclusive climate and build programs to open doors for underrepresented students. We are now on the cusp of more coordinated institutional change with the 2017 establishment of the Division of Diversity and Community Engagement. Support is in place to advance inclusive teaching in STEM and we are ready and eager to do this work. Joining the HHMI IE 3 learning community would maximize the impact of existing campus diversity and inclusion efforts and help center the role of faculty.
Our State and Institutional History Chartered in 1844, the University of Mississippi (UM) is a flagship, public, Research I institution in Oxford, Mississippi. In 1962, the university was presented on the national stage as epicenter for protest and racial integration. Since, UM, also known as Ole Miss, has vacillated in the public’s mind as an institution stubbornly rooted in the past and also as a progressive campus overcoming divisive forces to take action to shed symbols and end practices that continued to harbor racism and inequity. Because of its history and ever-present need to address racial equity, UM is uniquely positioned to serve as a national leader in developing programs that reconcile a history of racial discrimination to create a more inclusive climate that will move the needle on achieving equity in higher education. To fully appreciate the challenges and opportunities for colleges and universities in Mississippi, it is important to understand several dimensions of the demographic and socioeconomic landscape of the state. Disproportionately high numbers of individuals in three significant categories highlight the challenges and opportunities that these institutions face: people living in rural communities (51. 2%), people living below poverty (21. 5%), and African Americans (38%). As the flagship university of the state of Mississippi, UM understands its unique responsibility to serve our residents in these often intersectional groups, because of the history of inaccessibility and inequity in our state.
Nuances of Diversity Data 1. Minority – a category of people who experience relative disadvantage as compared to members of a dominant social group • Underrepresented Racial/Ethnic Minority Groups (Black/African American, Hispanic/Latino/a, American Indian, Alaskan Native, Pacific Islander, Hawaiian) • Minority vs. Underrepresented Racial/Ethnic Minority Groups (Asian American) 2. Multi-racial (2 or more races) 3. Black vs African American or Latino/a vs. Hispanic • Sponsor language/data 4. IHL/IPEDs distinction • consistency, definition 5. Gender Identity/Sex • (women/trans*- social category) (female/male – biological category) 6. Gender • diversity vs. equity vs. inclusion
EQUITY DIVERSITY Power People Women were 51. 5% of the population Ø Ø “Women have reached parity with men among S&E bachelor’s degree recipients—half of S&E bachelor’s degrees were awarded to women in 2016”(https: //ncses. nsf. gov/pubs/nsf 19304/ digest/introduction) INDIVIDUAL, RECRUITMENT, INCREASED ACCESS AND OPPORTUNITY INCLUSION Women are still underrepresented in S&E occupations Women have been shown to be underrepresented in doctorategranting research institutions at senior faculty levels in most biomedical-relevant disciplines (https: //grants. nih. gov/grants/guide/notice-files/NOT-OD 20 -031. html) Ø NIH encourages institutions to consider women for faculty-level, diversity-targeted programs to address faculty recruitment, appointment, retention or advancement. INSTITUTIONAL, RETENTION, PERSISTENCE, REMOVE INSTITUTIONAL BARRIERS, DECREASE DISPARITIES Participation Ø Ø Ø Invisible Labor Emotional Labor “About 19 percent of the men said they experienced sexual discrimination at work, versus 50 percent of the women. In certain heavily male-dominated subsets of STEM, 78 percent of the women experienced gender discrimination” (Funk & Parker 2018). CLIMATE, INDIVIDUAL AND INSTITUTIONAL, TREATMENT, TARGETING BEHAVIOR, DECISION MAKING
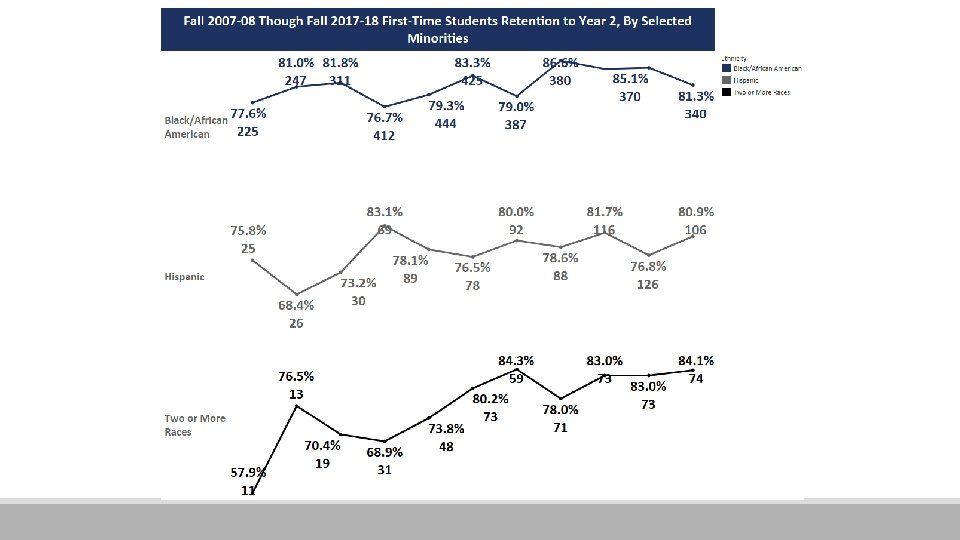
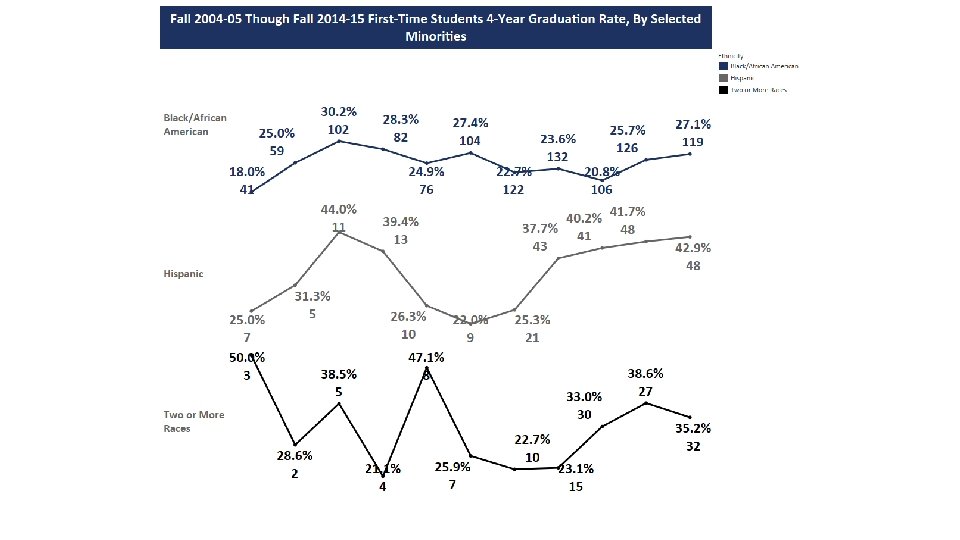
Institutional Student Data African American Students • 9. 7% (314) of new UM undergraduate students (2019 -20) • 12. 2% (2, 019) of all UM undergraduate students in (2019 -20) • 20% of Mississippi resident undergraduate student enrollment; 6. 6% of Mississippi non-resident undergraduate student enrollment • 88% of UM African American undergraduate students are Mississippi residents • Market share of Mississippi residents enrolled in MS colleges/universities (15% UM vs 25% MSU, 2018) • 88% of African American students @ UM are Mississippi residents (2527/2232); 83% of African American students @ MSU are Mississippi residents (3328/4022) (2018 -19) • 51% of UM White undergraduate students are Mississippi residents • African American men have the lowest retention/graduation rates of any other student demographic
Institutional Student Data • Retention Rate to Year 2 81. 7% Black/86. 7% White • Rate of attrition for African American students (beyond Year 2) almost doubled that of White students (2006 -2013 cohort) • Year to year persistence rate- White students (85. 5, 77. 5, 73. 5) and Black/African American (80. 7, 64. 8, 62. 02), Latinx/Hispanic (79. 8, 73. 7, 65. 9), and American Indian students (63. 6, 71. 4, 53. 3) (18 -19) • 4 -year Graduation Rate 27% Black/51% White/61% Asian (18. 9% - African American - NCES) (18 -19) • 5 -year Graduation Rate 40% Black/67% White/73% Asian (35. 5% - African American - NCES) (18 -19) • Market share of minority Mississippi residents enrolled in MS colleges (15% UM vs 25% MSU, 2018) IREP/IHL – Minority Data National Center for Educational Statistics
Faculty Gender/Racial Diversity – UM Men Women Black 7% White Asian 5% 5% Other Racial Groups 6% 6% 5% 8% 83% 80% 22% 33% 42% 45% 58% 82% 68% 67% 58% 55% 42% Tenured Tenure-Track Retrieved from Tableau, 2018 Non-tenure track Total 6% 5% 6% 6% Tenured Tenure-Track Non-tenure track Total
Faculty Gender/Racial Diversity – National Men Women People of Color 47% 76% 53% 24% Retrieved from NCES, 2016 Total White
Institutional Faculty Data Faculty (N=1105), 2018 -2019 – 53% of all faculty TT/ Tenured (36% Tenured/17% TT) – 47% of all faculty NTT – 55% men (611) – 45% women (494) – 80% White (884) – 8% Asian (88) – 6% Black (63) – 3% Multiracial (31) –. 45% American Indian/ Alaska Native (5) –. 09% Native Hawaiian or Pac. Islander (1) IREP – IHL Data
Institutional Faculty Data Of all 1105 faculty, largest groups by Race/tenure-track/Non tenure track (2018 -19) – White Non tenure track (426) – White Tenured (330) – White Tenure track (128) – Asian Tenure track (41) – Black Non tenure track (31) – Asian Non tenure track (26) – Black Tenured (23) – Latino Non tenure track (21) – Asian Tenured (21) – Multi-racial Tenured (19) – Black Tenure track (9) – Latino Tenure track (7) IREP – IHL Data
Institutional Faculty Data Of all 1105 faculty, largest groups by gender/tenuretrack/non tenure track (2018 -2019) – 26% Non-tenure track women (282) – 24% Tenured men (268) – 21% Non-tenure track men (234) – 12% Tenured women (132) – 10% Tenure track men (109) – 7% Tenure track women (80) IREP – IHL Data
Roadmap to Addressing DEI in Grant Writing
Projects Advancing Diversity, Equity, and Inclusion: Key Questions to Consider & Answer in your Proposal 1. What “problem” has the sponsor identified that needs to be addressed? • What are the key concerns raised by the sponsor? • Who is your audience, and what do they care about? 2. Which underrepresented groups will be chosen for inclusion? • What groups does the grantor include in its definition of underrepresented? • What is the rationale for targeting these groups in particular? • What is the local context? (cite institutional or local documents) • What (local, regional, national) disparities exist for these groups? (cite data or research) • What are the key challenges? (cite data and/or research) 3. How are you uniquely qualified to address this problem? • Be specific-What is the evidence of your past track record of success working on this problem? • How have you engaged these groups in the past? What did you learn from that experience?
Example What “problem” has the grantor identified that needs to be addressed? • What are the key concerns raised by the grantor? • Who is your audience, and what do they care about? NSF Advance CLIMATE, INDIVIDUAL AND RETENTION, PERSISTENCE, INSTITUTIONAL, TREATMENT, REMOVE INSTITUTIONAL TARGETING BEHAVIOR, POWER BARRIERS, DECREASE DISTRIBUTION DISPARITIES The NSF ADVANCE program goal is to broaden the implementation of evidence-based systemic change strategies that promote equity for STEM 2 faculty in academic workplaces and the academic profession. The NSF ADVANCE program provides grants to enhance the systemic factors that support equity and inclusion and to mitigate the systemic factors that create inequities in the academic profession and workplaces. Systemic (or organizational) inequities may exist in areas such as policy and practice as well as in organizational culture and climate. For example, practices in academic departments that result in the inequitable allocation of service or teaching assignments may impede research productivity, delay advancement, and create a culture of differential treatment and rewards. Similarly, policies and procedures that do not mitigate implicit bias in hiring, tenure, and promotion decisions could lead to women and racial and ethnic minorities being evaluated less favorably, perpetuating historical under-participation in STEM academic careers and contributing to an academic climate that is not inclusive. All NSF ADVANCE proposals are expected to use intersectional approaches in the design of systemic change strategies in recognition that gender, race and ethnicity do not exist in isolation from each other and from other categories of social identity.
Which underrepresented groups will be chosen for inclusion? • What groups does the grantor include in its definition of underrepresented? CLIMATE, INDIVIDUAL AND Intersectionality is a theoretical framework for • What is the rationale for targeting these groups in particular? • What is the local context? (cite institutional or local documents) INSTITUTIONAL, TREATMENT, understanding how aspects of one's social and • What (local, regional, national) disparities exist for these groups? (cite data or research) TARGETING BEHAVIOR, political identities (gender, race, class, sexuality, • What are the key challenges? (cite data and/or research) WHAT GROUPS FACE POWER NSF Advance DISTRIBUTION ability, etc. ) might combine to create unique INEQUITIES BASED ON LOCAL modes of discrimination. INSTITUTIONAL DATA? The NSF ADVANCE program goal is to broaden the implementation of evidence-based systemic change strategies that promote equity for STEM 2 faculty in academic workplaces and the academic profession. The NSF ADVANCE program provides grants to enhance the systemic factors that support equity and inclusion and to mitigate the systemic factors that create inequities in the academic profession and workplaces. Systemic (or organizational) inequities may exist in areas such as policy and practice as well as in organizational culture and climate. For example, practices in academic departments that result in the inequitable allocation of service or teaching assignments may impede research productivity, delay advancement, and create a culture of differential treatment and rewards. Similarly, policies and procedures that do not mitigate implicit bias in hiring, tenure, and promotion decisions could lead to women and racial and ethnic minorities being evaluated less favorably, perpetuating historical under-participation in STEM academic careers and contributing to an academic climate that is not inclusive. All NSF ADVANCE proposals are expected to use intersectional approaches in the design of systemic change strategies in recognition that gender, race and ethnicity do not exist in isolation from each other and from other categories of social identity.
Understanding the Context (local, regional, national) • The representation of African American faculty to African American students is 27: 1. • Mississippi leads the 50 states in the percentage of residents who are African Americans: 38%. (Louisiana is second at 32%). • At the University of Mississippi, over 10 years (2002 -2011), minority enrollment has increased by 78. 9 % and African-American enrollment is up 84. 0%. Last fall, 24. 2% (nearly one in four) of UM students were minorities and 16. 5% were African-American. • We will develop a K-12 outreach program of science demonstrations at the North Panola high school, North Panola Junior high school and Green Hill elementary schools. 97% of the students at these schools are African American and 87% qualify for free lunch programs. Through this outreach program, we will try to recruit these students into our high school, undergraduate and graduate programs.
How are you uniquely qualified to address this problem? • Be specific-What is the evidence of your past track record of success working on this problem? • How have you engaged these groups in the past? What did you learn from that experience? Establish a Track Record (Be Specific –Evidence Based) Too Broad: A group of tick researchers at UM’s has offered an exciting course on ticks, edited a useful handbook on ticks, developed several outreach programs, and collaborated on lots of research—all involving members of underrepresented groups. Specific: • The PI and 5 senior Native American women students built a traveling “Tick. Mobile” that has so far shown 1, 000 kindergartners attending public schools in the Mississippi Delta how to safely extract ticks from other children on the playground. • The PI developed the “Tick Engineering Camp” through which she has recruited 10 students (including seven women and one African American student) into the Center for Manufacturing Engineering. • The PI sponsored Brad Paisley to the Oxford Science Café in 2012, where he performed his song “I’d Like to Check You for Ticks” for over 100 community members, at least 50 of whom were older adults.
How are you uniquely qualified to address this problem? • Be specific-What is the evidence of your past track record of success working on this problem? • How have you engaged these groups in the past? What did you learn from that experience? Establish a Track Record (Be Specific –Evidence Based) • The PI has mentored four high school, nine undergraduate, and four graduate students to date, over 50% of whom are from underrepresented groups (mostly Latino/a and Women) and this commitment will continue during this project period. • The PI’s research group has published 15 tick-related articles in peer-reviewed journals, including 5 articles with undergraduate co-authors, and two with an undergraduate, Latino/a student as the lead author [Give References]. This project should result in between 2 and 4 additional student co-authored journal publications.
Projects Advancing Diversity, Equity, and Inclusion: Key Questions to Consider & Answer in your Proposal 4. What is your plan to address the “problem” identified? • Is it a diversity, equity, and/inclusion “problem”? • What will be your approach to reduce disparities, and why? – – Does it build on what has been shown to be successful? Cite. Is it attempting something innovative? Explain. • How will you recruit and legally select participants to maximize diversity? – • • • From what communities? How will you reach them? Do you have committed partners? Do you have a track record yet? What activities will the participants be involved in, and why? How will participants benefit? How will project advance/disseminate knowledge on reducing disparities? What quantifiable performance metrics will you use? How will you assess success or failure?
Approach to Reduce Disparities DIVERSITY EQUITY INDIVIDUAL, RECRUITMENT, INCREASED ACCESS AND OPPORTUNITY INSTITUTIONAL, RETENTION, PERSISTENCE, REMOVE INSTITUTIONAL BARRIERS, DECREASE DISPARITIES People Power INCLUSION Participation CLIMATE, INDIVIDUAL AND INSTITUTIONAL, TREATMENT, TARGETING BEHAVIOR, DECISION-MAKING
Recruitment Strategies • Internal – – – Minority Student Affinity Groups (BPGSA, NOBCCh. E, BSU, NSBE, NABA, etc. ) Center for Inclusion and Cross-Cultural Engagement Mc. Nair Scholars Program, Grove Scholars Program, IMAGE (NSF LSMAMP) NSF Supplemental Funding NSF REU Programs URM Faculty • External – Recruiting from HBCUs, Tribal Colleges, and other institutions with significant numbers of students from underrepresented groups (build on existing relationships, shared responsibility for program design, mutually beneficial partnerships, etc. ) – Participation in national student science conferences that draw significant participation from students from underrepresented groups – Advertising programs in that include or prioritize under-represented racial or ethnic groups in media-based communication
Best Practices
Do: Demonstrate Need/Equity Minded Responses Don’t: Blame Underrepresented Groups Asset-based vs. Deficit Based Language • Asset-based approach focuses on strengths. It views diversity in thought, culture, and traits as positive assets. Teachers and students alike are valued for what they bring to the classroom rather than being characterized by what they may need to work on or lack. • Deficit-based approaches focus on the perceived weaknesses of individuals or groups, such that the individuals or groups become viewed as “the problem. ” Avoid Pejorative Words/Concepts • At-risk vs Students disproportionately/historically disadvantaged because of … • Achievement gap vs Opportunity gap • Minority (abilities vs representation) Equity-Minded Approaches • Identifying major changes in institutional practices, routines, and culture needed to obtain equitable outcomes for historically marginalized and minoritized populations. Frames inequities as a problem of practice rather than a problem with students, emphasizing the responsibility of higher education institutions, faculty, staff, and leaders to eliminate disparities in educational outcomes and create equity for all students (Bensimon, Center for Urban Education).
Do: Demonstrate Need/Equity-Minded Responses Don’t: Blame Underrepresented Groups POOR Underrepresented minority high school students in Mississippi are generally unprepared for college. They often lack the skills, rigorous classes, and knowledge about the college experience. These deficits make it difficult for them to be competitive in our fullscholarship competitions at the university. We need to develop a program that better prepares these students so that they have an opportunity to avoid financial challenges during college. GOOD Underrepresented minority students are not competitive in full-scholarship competitions at the university, because 65% of them live in rural communities in Mississippi that have limited access to enhanced college-preparation resources (GRE Prep courses, Advanced Placement courses, etc. ). The lack of access to these awards increases the likelihood that these students face financial challenges and insecurity during college. As a result, the university should consider adding more equitable and proven measures that appropriately assess student’s ability to excel in college.
Don’t: Editorialize or Use Sweeping Rhetoric Do: Make Fact-Based Claims POOR • Mississippi is the worst state in the nation when it comes to Advanced Placement. • Mississippi’s political elite devalues public education; that is why our Advanced Placement offerings are so dismal. GOOD • Mississippi lags the nation in both the percentage of its students who take AP exams in any subject (2014 rank: 49 th at 17. 2%, leading only North Dakota) and the percentage of AP exams passed in any subject with a score of 3 or better (2014 rank: 49 th at 32. 4%, leading only Arkansas). • In 2014, only about 44% (126 out 282) of Mississippi’s public high schools even offered AP courses of any type (College Board, 2014).
NSF Broader Impacts • What is the potential of this project to benefit the society and/or contribute to the achievement of specific, desired societal outcomes? • Per NSF, “such incomes include, but are not limited to: full participation of women, women persons with disabilities, persons with disabilities and underrepresented minorities in underrepresented minorities science, technology, engineering, and mathematics (STEM); improved STEM education and educator development at any level; increased public scientific literacy and public engagement with science and technology; improved well-being of individuals in society; development of a diverse, globally competitive STEM workforce; increased partnerships between academia, industry, and others; improved national security; increased economic competitiveness of the United States; and enhanced infrastructure for research and education. ”
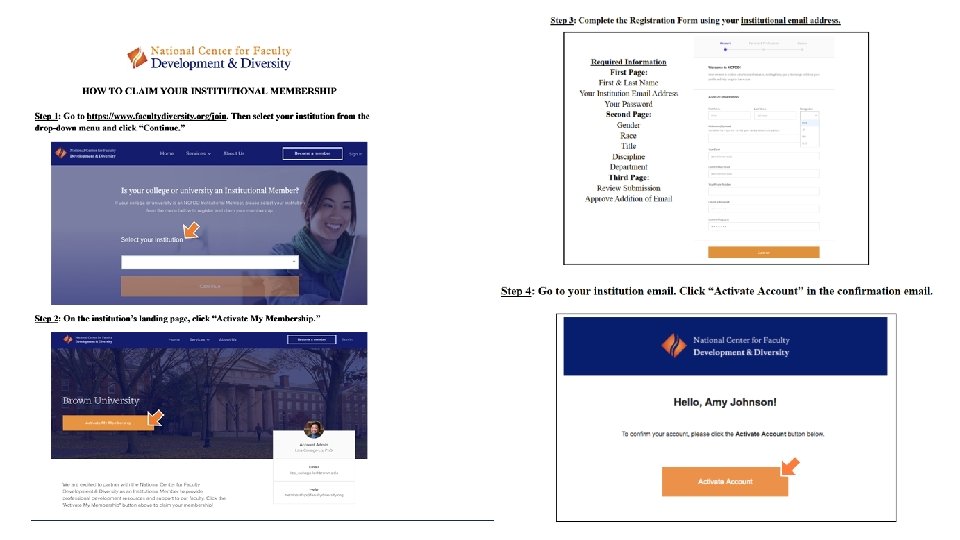
What grant mentorship is available? UM has an institutional membership in the National Center for Faculty Development and Diversity https: //www. facultydiversity. org/ UM folks can partner with mentors grant writing mentors from other member orgs. “The National Center for Faculty Development & Diversity is an independent professional development, training, and mentoring community for faculty members, postdocs, and graduate students. We are 100% dedicated to supporting academics in making successful transitions throughout their careers. ” “Members receive a weekly motivational email (the Monday Motivator) and access to the full NCFDD Core Curriculum, guest expert webinars, intensive multi-week courses facilitated by national experts, a private discussion forum, monthly writing challenges, and the opportunity to connect with a writing accountability partner. ”
What grant mentorship is available? ORSP Grant Mentorship Incentive Program http: //research. olemiss. edu/Grant. Mentors Provides an avenue for UM/Oxford Faculty with expertise and experience to make substantial contributions to the enhancement of competitive funding proposals to receive extra and/or supplemental compensation by serving as Grant Mentors.
What grant mentorship is available? Enhanced Narrative Review http: //research. olemiss. edu/Enhanced. Review ORSP Enhanced Review • Internal, no-cost, non-technical review of a proposal Draft Narrative T. I. G. External Disciplinary Expert Review • For $750, an external disciplinary expert with sponsored programs experience will review and provide suggestions for improvement. TIG Internal Review With Revisions • Fee-based comprehensive mentoring and reviews for larger grants
What if the sponsor doesn’t explicitly refer to diversity, equity or inclusion ? Things you can do: • Look for other language in the funding solicitation or other communications that signal what the sponsor cares about, and then use the roadmap from today’s presentation to tie those sponsor interests to DEI. • Initiate a preliminary conversation with the program officer or other sponsor official, to see whether, and to what degree, the sponsor will entertain proposals that include DEI elements not explicitly called for in the funding announcement.
What is the best way to get institutional data to support grant proposals? Tableau https: //olemiss. edu/tableau/ Individuals applying for grants are welcome to use the data in the Tableau visualizations to prepare their grants. I offer a strong word of caution, however. The individual should ensure that the data required for the grant application is the data that is available in Tableau. It may be that a period of time differs or definitions between the grant application and Tableau differ slightly. For example, we may post data on an academic year basis, but the grant wants calendar year. Initiate a preliminary conversation with the program officer or other sponsor official, to see whether, and to what degree, the sponsor will entertain proposals that include DEI elements not explicitly called for in the funding announcement.
What is the best way to get institutional data to support grant proposals? IREP Data Inquiry Form https: //irep. olemiss. edu/data-inquiry-form/ Anyone is welcome to submit an inquiry form at any time. That said, in the case of grants, especially large grants (e. g. , NIH or NSF) the request can be very time consuming and labor intensive. The requestor should allow a minimum of two weeks or longer for more complex analyses.
What is the best way to get institutional data to support grant proposals? Diversity Dashboard Diversity and Community Engagement leaders have been in conversations with IREP about creating a Diversity Dashboard with more fine-tuned institutional data that can inform, among other initiatives, DEI proposal development. At this time, this is still a work-in-progress.
When should one reach out to the Center for Research Evaluation (CERE) to consult on an evaluation for a proposed project? As early in the process as possible! https: //cere. olemiss. edu/ The earlier you talk to CERE, the better than will be able to understand your goal and help you to structure an approach where the progress towards achieving those goals can be measured. CERE has also been working on developing framework for measuring DEI in Mississippi.
Is there a recommended “binary” sex/gender nomenclature to use in most federal grants? woman/man vs. female/male? From Kirsten Dellinger: As a sociologist, I would suggest women and men. But I do think there is a lot of variation in what people use or prefer. From Jason Hale: We (ORSP) have no clear, sweeping recommendation here, other thank to know and use the terminology that the sponsor uses. Male/female tends to be more of a biological classification vs. an identity classification. When addressing challenges and solutions related to diversity, equity, and inclusion (DEI), it might make more sense to use language that evokes group identity rather than anatomical difference. However, as Dr. Dellinger pointed out in the Q/A discussion, terms like “maledominated-culture” evoke DEI issues just fine and are commonly understood.
African Americans are 38% of MS population. What % of all MS college enrolled are African American? (how does the college population compare vs. the general population) Katie Busby shared these resources: IHL reports: http: //www. mississippi. edu/research/stats. asp IHL interactive data portal: http: //www. mississippi. edu/research/idp. asp IHL Fall Enrollment Fact Book: http: //www. mississippi. edu/research/downloads/2019 enrollmentbook. pdf The IHL System Profile: http: //www. mississippi. edu/research/downloads/profile 2018. pdf IHL Fast Facts: http: //www. mississippi. edu/research/downloads/fast_facts_1920. pdf
African Americans are 38% of MS population. What % of all MS college enrolled are African American? (how does the college population compare vs. the general population)
African Americans are 38% of MS population. What % of all MS college enrolled are African American? (how does the college population compare vs. the general population) From Jason Hale: For national comparison purposes, NSF provides statistical tables on trends in the participation of women, minorities, and persons with disabilities in science and engineering fields. Topics include higher-education enrollments, degrees, institutions, and financial support and employment status, occupations, sectors, and salaries. A formal report is issued every two years. The 2019 report (and tables) are accessible here: https: //ncses. nsf. gov/pubs/nsf 19304/ For example, from Table 2 -1, we see that in 2016, Non-Hispanic Black or African American undergraduate enrollment at all US institutions was 2, 111, 156 out of 17, 081, 187, or about 12. 4%. From Table 1 -2, in 2017 (almost the same year), Non. Hispanic Black or African between the ages of 18 -24 were residents represented about 14. % of the US population in that age range (4, 402. 172 out of 30, 672, 088).
Additional Information The name of the equity gap expert Dr. Caldwell mentioned in the May 13 presentation is Estela Mara Bensimon. Dr. Benison is professor of higher education at the USC Rossier School of Education and Director of the Center for Urban Education. Link to David J. Asai’s commentary “Race Matters” that uses the term “PEERs” – persons excluded because of their ethnicity and race. https: //www. cell. com/cell/pdf/S 0092 -8674(20)30337 -8. pd Katie Morrison, Director of Foundation Relations, mentioned that University Development has access to some resources that the Office of Development subscribes to, including background info on private foundations, typical grant amounts, universities who have received those grants, etc. Contact Katie if you would like assistance navigating what a particular private foundation might be interested in funding. The recording(s) of this presentation, along with any updates to the slides, will be made available by the end of May at http: //research. olemiss. edu/presentations.