The Introduction of Recommender System Evaluation of Recommender


 • The most popular measure")


, (47, 4. 5), (263,")


 • gender, income,")

 Experiment design")

 Quasi-experimental design • Lacking random assignments of subjects to different treatments • subjects")

 that let")
 Nonexperimental designs • Include all other forms of quantitative research, as well as")

 Cross-sectional research • Analyzing relations among variables that are simultaneously measured in different")
 Case studies • Analyzing empirical evidence • Answering research questions about how and")
- Slides: 52
推荐系统导论 The Introduction of Recommender System 李树青
第六章:推荐系统评价 • Evaluation of Recommender Systems
Questions • A technical method is efficient with respect to a specified goal? • • • Responsiveness to user requests Scalability Peak load or reliability Maintainability Extensibility Lowering the cost of ownership • Increasing customer satisfaction? • Ensuring the economic success of an ecommerce platform?
1 General properties
1. 1 Subjects: dataset • Natural datasets include historical interaction records of real users
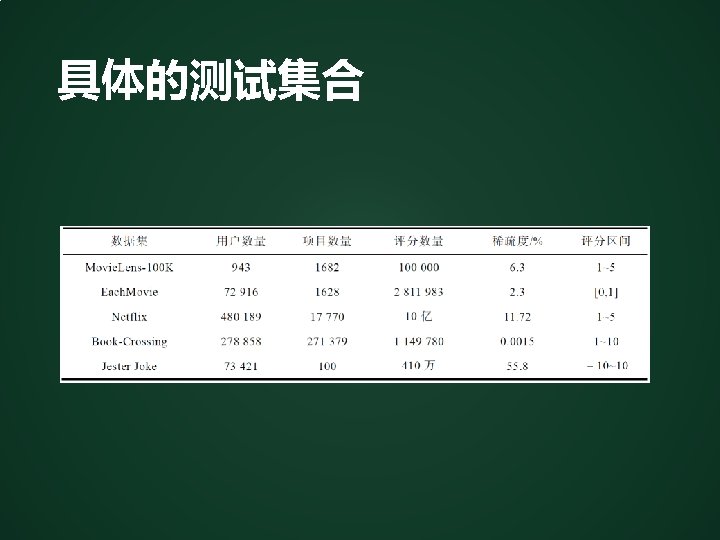
Popular data sets
How to calculate Sparsity? • R = ratings • I = items • U = users
All kinds of results
Possible problem • Nevertheless, the results of evaluating recommender systems using historical datasets cannot be compared directly to studies with real users and vice versa • No assumptions can be made for all unrated items because users might not have been aware of the existence of these items • By default, these unknown item preferences are interpreted as disliked items and can therefore lead to false positives in evaluations
2 Evaluation on historical datasets
Example user ratings
Metrics
Mean Absolute Error (MAE) • The most popular measure
Precision • hitsu: number of correctly recommended relevant items for user u • The Precision metric (P) relates the number of hits to the total number of recommended items (|recsetu|)
Recall • The ratio of hits to theoretical maximum number of hits owing to the testing set size (|testsetu|)
• Measuring an algorithm’s performance based on Precision and Recall reflects the real user experience better than MAE does because, in most cases, users actually receive ranked lists from a recommender instead of predictions for ratings of specific items
Example • recset 234 ={ • • (912, 4. 8), (47, 4. 5), (263, 4. 4), (539, 4. 1), (348, 4), . . . , (719, 3. 8) } • MAE=0. 65 • only the five highest ranked items – P = 0. 2 – R = 0. 5
F metric • Effectively averages Precision and Recall with bias toward the weaker value
Rank scores • The rationale behind this weighting is that later positions have a higher chance of being overlooked by the user, even though they might be useful recommendations
half-life utility rank score
Example • user 234 with twenty recommendations and hits on the fourth and twentieth positions • a=10
lift index • It assumes that the ranked list is divided into 10 equal deciles and counts the number of hits in each decile as S 1, u, S 2, u, . . . , S 10, u
Example
3 Methods • The observed or measured aspects are termed variables • Either independent or dependent
Independent variables • A few variables are always independent (often static) • gender, income, education, or personality traits • Further variables are independent if they are controlled by the evaluation design • the type of recommendation algorithm
Dependent variables • Dependent variables are those that are assumed to be influenced by the independent variables • User satisfaction, perceived utility, or clickthrough rate
1) Experiment design
• Subjects are randomly assigned to different treatments • Different recommendation algorithms • The type of algorithm would constitute the manipulated variable • The dependent variables (e. g. , v 1 and v 2) are measured before and after the treatment
2) Quasi-experimental design • Lacking random assignments of subjects to different treatments • subjects decide on their own about their treatment
• Might introduce uncontrollable bias because subjects may make the decision based on unknown reasons • When comparing mortality rates between populations being treated in hospitals and those staying at home, it is obvious that higher mortality rates in hospitals do not allow us to conclude that these medical treatments are a threat to people’s lives
• There could be unknown reasons (i. e. , uncontrolled variables) that let users who have a strong tendency to buy also use the recommender system • some items that were rarely purchased in the period before the introduction of the recommendation system became top-selling items afterward and further analysis indicated that the increase in the number of pieces sold for these items correlated positively with the occurrence of these items in actual recommendations
3) Nonexperimental designs • Include all other forms of quantitative research, as well as qualitative research • asking users different questions about the perceived utility of a recommendation application with answers on a N-point Likert scale • qualitative research approaches would conduct interviews with open-ended questions
Longitudinal research, • The entity under investigation is observed repeatedly as it evolves over time
4) Cross-sectional research • Analyzing relations among variables that are simultaneously measured in different groups
5) Case studies • Analyzing empirical evidence • Answering research questions about how and why and combine whichever types of quantitative and qualitative methods