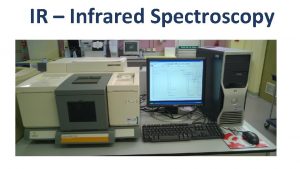
Spectroscopy Infrared Spectroscopy Introduction n Spectroscopy is an


- Slides: 141

Spectroscopy Infrared Spectroscopy

Introduction n Spectroscopy is an analytical technique which helps determine structure n It destroys little or no sample n The amount of light absorbed by the sample is measured as wavelength is varied 2020/11/22 2

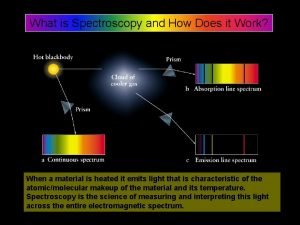
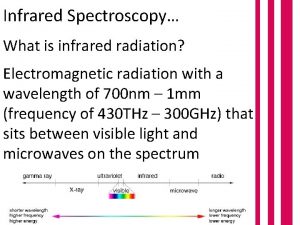
Electromagnetic Spectrum n Examples: X rays, microwaves, radio waves, visible light, IR, and UV n Frequency and wavelength are inversely proportional n c = ln, where c is the speed of light n Energy per photon = hn, where h is Planck’s constant 2020/11/22 3

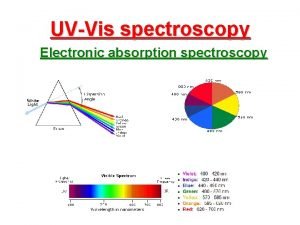
The Electromagnetic Spectrum High X-ray Frequency Energy UV uv 200 nm 2020/11/22 IR visible 400 nm Low Micro Radio wave NMR Vibrational IR 800 nm 2. 5 m 1 m 5 m 4

Energy Transitions Table 1. Types of energy transitions of the electromagnetic spectrum Region of spectrum Energy transition X-rays UV/Visible IR Microwave Radiofrequencies 2020/11/22 Bond breaking Electronic Vibrational Rotational Nuclear spin (NMR) Electron spin (ESR) 5

The Spectrum and Molecular Effects => 2020/11/22 6

The IR Region n Just below red in the visible region n Wavelengths usually 2. 5 -25 mm n More common units are wavenumbers, or cm-1, the reciprocal of the wavelength in centimeters (4000 - 400 cm-1) n Wavenumbers are proportional to frequency and energy 2020/11/22 7

Molecular Vibrations n Light is absorbed when radiation frequency = frequency of vibration in molecule n Covalent bonds vibrate at only certain allowable frequencies n Associated with types of bonds and movement of atoms n Vibrations include stretching and bending 2020/11/22 8

IR Spectrum Baseline Absorbance/ Peak n No two molecules will give exactly the same IR spectrum (except enantiomers) n Simple stretching: 1600 -3500 cm-1 n Complex vibrations: 400 -1400 cm-1, called the “fingerprint region” 2020/11/22 9

Interpretation n Looking for presence/absence of functional groups n Correlation tables n A polar bond is usually IR-active n A nonpolar bond in a symmetrical molecule will absorb weakly or not at all 2020/11/22 10

Carbon-Carbon Bond Stretching n Stronger bonds absorb at higher frequencies: n C-C 1200 cm-1 n C=C 1660 cm-1 n C C 2200 cm-1 (weak or absent if internal) n Conjugation lowers the frequency: n isolated C=C 1640 -1680 cm-1 n conjugated C=C 1620 -1640 cm-1 n aromatic C=C approx. 1600 cm-1 2020/11/22 11

Carbon-Hydrogen Stretching n Bonds with more s character absorb at a higher frequency sp 3 C-H, just below 3000 cm-1 (to the right) n sp 2 C-H, just above 3000 cm-1 (to the left) n sp C-H, at 3300 cm-1 n 2020/11/22 12

An Alkane IR Spectrum 2020/11/22 13

An Alkene IR Spectrum 2020/11/22 14

An Alkyne IR Spectrum 2020/11/22 15

O-H and N-H Stretching n Both of these occur around 3300 cm-1, but they look different Alcohol O-H, broad with rounded tip n Secondary amine (R 2 NH), broad with one sharp spike n Primary amine (RNH 2), broad with two sharp spikes n No signal for a tertiary amine (R 3 N) n 2020/11/22 16

An Alcohol IR Spectrum 2020/11/22 17

An Amine IR Spectrum 2020/11/22 18

Carbonyl Stretching n The C=O bond of simple ketones, aldehydes, and carboxylic acids absorb around 1710 cm-1 n Usually, it’s the strongest IR signal n Carboxylic acids will have O-H also n Aldehydes have two C-H signals around 2700 and 2800 cm-1 2020/11/22 19

A Ketone IR Spectrum 2020/11/22 20

An Aldehyde IR Spectrum 2020/11/22 21

O-H Stretch of a Carboxylic Acid This O-H absorbs broadly, 2500 -3500 cm-1, due to strong hydrogen bonding 2020/11/22 22

Variations in C=O Absorption n Conjugation of C=O with C=C lowers the stretching frequency to ~1680 cm-1 n The C=O group of an amide absorbs at an even lower frequency, 1640 -1680 cm-1 n The C=O of an ester absorbs at a higher frequency, ~1730 -1740 cm-1 n Carbonyl groups in small rings (5 C’s or less) absorb at an even higher frequency 2020/11/22 23

An Amide IR Spectrum 2020/11/22 24

Carbon - Nitrogen Stretching n C - N absorbs around 1200 cm-1 n C = N absorbs around 1660 cm-1 and is much stronger than the C = C absorption in the same region n C N absorbs strongly just above 2200 cm-1. The alkyne C C signal is much weaker and is just below 2200 cm-1 2020/11/22 25

A Nitrile IR Spectrum 2020/11/22 26

Summary of IR Absorptions 2020/11/22 27

Strengths and Limitations n IR alone cannot determine a structure n Some signals may be ambiguous n The functional group is usually indicated n The absence of a signal is definite proof that the functional group is absent n Correspondence with a known sample’s IR spectrum confirms the identity of the compound 2020/11/22 28

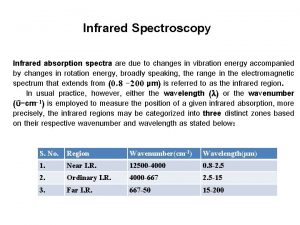
Infrared Regions Region wavelength wavenumber frequency (mm) (cm-1) (Hz) Near Middle Far Most used 0. 78 ~ 2. 5 12800 ~ 4000 2. 5 ~ 50 4000 ~ 200 50 ~ 1000 200 ~ 10 2. 5 ~ 15 4000 ~ 670 2020/11/22 3. 8 x 10¹⁴~ 1. 2 x 10¹⁴~ 6. 0 x 1012~ 3. 0 x 1011 1. 2 x 10¹⁴~ 2. 0 x 1013 29

IR Application Near IR: 770 ~ 2500 nm 1. Using photometers or spectrophotometer similar to UV spectrometry 2. Application: routine quantitative determination of species, e. g. moisture, proteins, CHs, fats in agricultural, food, and chemical industries. 2020/11/22 30

IR Application Mid-IR: 1. Used largely for qualitative organic analysis and structural determination based on absorption spectra. 2. FT-IR has been used for quantitative analysis of complex gaseous, liquid, or solid mixtures. Far-IR: Used for qualitative analysis of pure inorganic or metal organic species. 2020/11/22 31

IR Sources n An inert solid heated btw 1500 ~ 2000 k, The max radiation ~ 5900 cm-1 (1. 7 m. M); at long wavelength, 1% of max ~ 670 cm-1 (15 m. M). n Types of Sources ►The Nernst Glower: rare earth oxides, negative temp coeff of resistance, heated to red heat ► The Globar Source: a silicon carbide rod, positive temp coeff, greater output at > 5 mm. 2020/11/22 32

Types of Instruments for IR n Dispersive grating photometers: used for qualitative work n Fourier transform photometers: used for both qualitative and quantitative works; speedy, reliable, and convenient n Nondispersive photometers: for quantitative use 2020/11/22 33

IR Absorption Region λ= 2. 5 ~ 15 mm (10 -4 cm = 1 mm = 104 Ao). (4000 cm-1 ~ 666 cm-1 ) wavenumber: � (cm-1, reciprocal centimeters) �(cm-1) = 1 / (cm) ν(Hz) = � c = c (cm/sec) / (cm) wavenumber �(cm-1) = 104 / wavelength (mm) = 104 /�(cm-1) 2020/11/22 34

Theoretical Introduction ΔE = h. ν = h c /λ = h c � C : velocity of light, 3 x 1010 cm/sec h : Planck’s constant ν : frequency (1/sec) λ : wavelength (mm) � : wavenumber (cm-1) 2020/11/22 35

IR Absorption Process n A Quantized Process: n Only selected frequencies (energies) of infrared n radiation will be absorbed by a molecule n Bonds have dipole moment, Yes ! n Symmetric bonds, No ! (e. g. H 2, Cl 2) 2020/11/22 36

IR Application n Infrared spectrum can be a fingerprint used for identification. n Infrared spectrum gives the structural information about a molecule. 2020/11/22 37

Absorption UV example Transmittance: T = I/Io Absorbance: A = Log Io/I if no absorption, T = 1; A = 0 Most spectrometers display absorbance on vertical axis, and the commonly observed range from 0 (100% T) to 2 (1% T) max: The wavelength of maximum absorbance 2020/11/22 38

An Infrared Spectrum 2020/11/22 39

IR Spectrum Baseline Absorbance/ Peak n No two molecules will give exactly the same IR spectrum (except enantiomers) n Simple stretching: 1600 -3500 cm-1 n Complex vibrations: 400 -1400 cm-1, called the “fingerprint region” 2020/11/22 40

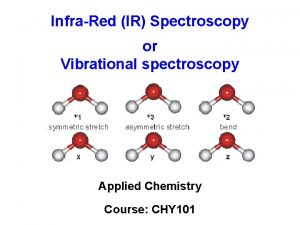
Vibration Modes Symmetric Stretch Asymmetric Stretch Symmetric Bend 2020/11/22 41

Vibration Modes of CH 2 Group n Gas Phase IR Spectrum of Formaldehyde, H 2 C=O 2020/11/22 42

Vibration Modes Sym. Stretching (~ 2853) Asym. Stretching (~ 2926) Scissoring (~ 1450) Rocking (~ 720) in plane Stretching vibrations 2020/11/22 wagging (~ 1250) Twisting (~ 1250) Out of plane Bending Vibrations 43

Basic Principle As for any harmonic oscillator, the energy of bond vibration: Eosc h νosc Applying Hooke’s Law K = - k. Δr K Restoring force - Arising force opposed to extension k Elasticity constant (unit: N / m = kg. m / sec 2 / m) ( ~ bond strength between two atoms) Δr extension 2020/11/22 44

Basic Principle The natural frequency of the oscillation νosc = ½ . √k / m (1) Wave equation of quantum mechanics E = (n + ½) ½ h. √k / m (2) h : Planck’s const. n : vibration quantum number Take (1) into (2): Evib = h νosc (n + ½ ) 2020/11/22 45

Basic Principle From SchrÖdiger Equation: Evib = h νosc (n + 1/2) vibration quantum number, n = 0, 1, 2, 3 ---- Ground state (n = 0): E 0 = ½ hνosc First excited state (n = 1): E 1 = 3/2 hνosc ΔEvib = E 1 – E 0 = 3/2 hνosc - ½ hνosc = hνosc 2020/11/22 46

Basic Principle The frequency of radiation, ν vibrational frequency, νosc E radiation = h ν = ΔEvib = hνosc = ½ h. √k / m or ν = νosc = ½ . √k / m 2020/11/22 47

Basic Principle νosc = 1/2 . √k / m m = m 1. m 2 / (m 1 + m 2) = reduced mass of atoms in AMU (unit: kg) ΔE vib = h. νosc = h / 2 . √k / m ν(cm-1) = E vib / h c = 1 / 2 c. √k / m = 5. 3 x 10 – 12 sec/cm. √k / m [ unit of √k / m : sec -1 ] 2020/11/22 48

Example Calculate the wavenumber and wavelength of the fundamental frequency peak due to the stretching vibration of C=O group. Solution: m 1 = 12 x 10 -3 kg / mol / 6. 0 x 10 23 atoms / mol = 2. 0 x 10 – 26 kg m 2 = 16 x 10 -3 kg / mol / 6. 0 x 10 23 atoms / mol = 2. 7 x 10 – 26 kg m = m 1. m 2 / (m 1 + m 2) = 1. 1 x 10 – 26 kg �(cm-1) = 5. 3 x 10 – 12 s/cm. √ 1 x 10 3 N /m /2. 7 x 10 – 26 kg = 1. 6 x 103 cm-1 2020/11/22 49

Example �(cm-1) = E vib / h c = 1 / 2 c. √k / m = 7. 76 x 1011/2 c √k / m’ (taking 6. 02 x 1023 out of root square) = 4. 12√k / m’ m‘ = M 1 M 2/(M 1+M 2); both are atomic weights. K : force constant in dynes/cm. 1 N = 1 kg m/sec 2 1 Dyne = 1 g cm/sec 2 2020/11/22 50

Force Constants k (Chemical bond force constant) : single bond 5 x 10² N/m = 5 x 10⁵ dynes/cm double bond 1. 0 x 103 N/m = 106 dynes/cm triple bond 1. 5 x 10³ N/m = 1. 5 x 10⁶ dynes/cm 2020/11/22 51

Force Constants C=C bond: � = 4. 12√k / m K = 106 dynes/cm m = 12 x 12/(12+12) = 6 �= 4. 12√ 106/6 = 1682 cm-1 (calculated) �= 1650 cm-1 (experimental) 2020/11/22 52

Force Constants C-H Bond: �= 4. 12√k / m K = 5 x 10⁵ dynes/cm m = 12 x(1)/(12+1) = 0. 923 �= 4. 12√ 5 x 10⁵/0. 923 = 3032 cm-1 (calculated) �= 3000 cm-1 (experimental) C-D Bond: � = 2206 cm-1 (experimental) 2020/11/22 53

Frequencies of vibration C C 2150 cm-1 C=C 1650 cm-1 C-C 1200 cm-1 increasing K 2020/11/22 54

Frequencies of vibration As the atom bonded to carbon increases in mass, the Quantity m increases, the frequency of vibration goes down. C-H 3000 cm-1 C-C 1200 cm-1 C-O 1100 cm-1 C-Cl 800 cm-1 C-Br 550 cm-1 C-I ~ 500 cm-1 Increasing m 2020/11/22 55

Frequencies of vibration Bending motion easier than stretching motions (The force constant K is smaller) C-H stretching ~ 3000 cm-1 2020/11/22 C-H bending ~ 1340 cm-1 56

Frequencies of vibration Hybridization affects the K values sp C-H 3300 2020/11/22 sp 2 =C-H 3100 sp 3 -C-H 2900 cm-1 57

Example 2020/11/22 58

Frequencies of Vibration C C C = C 2150 cm-1 1650 cm-1 C C 1200 cm-1 Increasing K C X stretching C H C C C O C Cl C Br C I 3000 1200 1100 800 550 ~500 cm-1 2020/11/22 59

Frequencies of Vibration Resonance: C=O 1715 cm-1 2020/11/22 1675 ~ 1680 cm-1 60

Substituent Effects Hyperchromic e Bathochromic (red shift) Hypsochromic (blue shift) Hypochromic UV Profiles 2020/11/22 400 blue 800 red nm 61

Substitution Effects on IR Peaks n Electronic effects n Intramolecular factors n Inductive effects R-COR C=0 1715 cm-1 ; R-COH C=0 1730 cm -1 ; R-COCl C=0 1800 cm-1 ; R-COF C=0 1920 cm-1 ; F-COF C=0 1920 cm-1 ; R-CONH 2 C=0 1928 cm-1 ; 2020/11/22 62

n Conjugated Effects cm -1 2020/11/22 cm -1 63

n Space Effects n Steric Hindrance n Ring Strain 1576 cm 3060 -3030 cm-1 -1 1611 cm -1 1644 cm-1 2020/11/22 C H 2 2900 -2800 cm-1 1781 cm -1 1678 cm -1 1657 cm -1 1651 cm -1 64

2.Intermolecular Factors 2020/11/22 65

Example 2020/11/22 66

Symbols of Vibrations s = symmetric as = asymmetirc ν = stretching vibrations (bonding vibrations) δ = deformation vibrations (bending vibrations) γ = out-of-plane deformation vibrations τ = torsional vibrations 2020/11/22 67

Characterization of IR Spectra Fingerprint Region: 1450 to 600 cm-1 region Group Frequency Region: 4000 to 1450 cm-1 region 2020/11/22 68

Degree of Freedom (DF) According to Cartesian to describe positions: Each atom has 3 degrees of freedom, (x, y, z). A molecule of n atoms has 3 n DF. For nonlinear molecules: 3 n-6 are fundamental vibration of DF. For linear molecules: 3 n-5 fundamental vibration of DF. fundamental vibration involves no change in the center of gravity of molecules 2020/11/22 69

Degree of Freedom (DF) DF of Linear CO 2: 2020/11/22 70

Degree of Freedom (DF) Three fundamental vibrations of nonlinear triatomic water molecule: 2020/11/22 71

Vibration Modes CH 2 group A. Stretching vibrations Change of bond length B. Deformation vibrations (two types: planar or non-planar) Change of bond angle 2020/11/22 72

Fingerprint Regions Localized vibrations: spectra below 1500 cm-1 are difficult to interpretation, which, we call it “fingerprint region”, are characteristic for the molecule as a whole. Most of them are derived from overtone or combination vibrations. 2020/11/22 73

Group Frequency Regions Absorption bands in the 4000 to 1450 cm-1 region are usually due to stretching vibrations of diatomic units 2020/11/22 74

Some General Trends i) Stretching frequencies are higher than corresponding bending frequencies. (It is easier to bend a bond than to stretch or compress it. ) ii) Bonds to hydrogen have higher stretching frequencies than those to heavier atoms. iii) Triple bonds have higher stretching frequencies than corresponding double bonds, which in turn have higher frequencies than single bonds. (Except for bonds to hydrogen). 2020/11/22 75

Characterization of IR Spectra Carbonyl/ethylene groups C=O 1850 ~1630 cm-1, sharp & intensity C=C 1680 ~ 1620 cm-1, generally weak 2020/11/22 76

Characterization of IR Spectra Important infrared frequencies: The IR spectra of complicated molecules have many peaks, only a few of which can be easily interpreted. Here are the places to look at: 1500 – 1800 cm-1 : A strong signal for (C=O) or an imine. 2000 – 2200 cm-1 : stretch vibrations of triple bonds and cumulenes (-C≡N, -C≡C , -N=C=O, -C=C=O). 2900 – 3000 cm-1 : stretch vibrations of aliphatic C – H bond. 3000 – 3100 cm-1 : vinyl C – H bond stretches. 3100 – 3600 cm-1 : O – H bond stretches (broad if inter-molecularly at H-bonded). Be careful, since water appears in this region. 2020/11/22 77

Characterization of IR Spectra N-H & O-H regions usually overlap O-H 3650 ~ 3200 cm-1, broad peak N-H 3500 ~ 3300 cm-1, 1 or 2 sharp absorption bands of low intensity, O-H in this region usually gives broad peak. 2020/11/22 78

Characterization of IR Spectra Hydrogen Bonding X— H --- Y : s-orbital of proton overlapping with p- or -orbital of the acceptors. Common proton donor groups: -COOH, -OH, Amines, or amides. Common proton acceptors: O, N, halogens X— H : move to lower frequency with increased intensity. The acceptors, Y ( e. g. C=O), also move to lower frequency but to a less degree. Intermolecular H-bonding: usually in dimers (e. g. RCOOH), or in neat or concentrated solutions of R-OH. Temperature, concentration affect the inter or intra- H-bonding. 2020/11/22 79

Characterization of IR Spectra Intra- H-bond is stronger when a six-membered ring is formed. H-bond is strongest when the bonded structures is stabilized by resonance. 2020/11/22 80

Characterization of IR Spectra Stretching frequencies in hydrogen bonding X— H --- Y Weak Intermolecular bonding intramolecular bonding Frequency reduction(cm-1) ν OH ν CO comp’ds 300 15 R-OH, Ph. OH intermol OH to CO Medium Strong 2020/11/22 < 100 10 1, 2 -diols most b-OH ketones 100 ~ 300 50 >500 50 RCOOH dimers > 300 100 81

Analysis of Spectra 1. If C=O 1820 ~ 1660 cm-1 : the strongest peak Acid: Amide: Ester: Anhydride: Aldehyde: Ketone: 2020/11/22 is OH present? Broad near 3400~2400 is NH present? Medium peak ~3500 is C-O present? Strong at 1300~1000 two C=O ~ at 1810 & 1760 is C-H present? Two peaks ~ 2850 & 2750 the above 5 choices were eliminated 82

Analysis of Spectra 2. If C=O absent Alcohol/phenol: check for OH - broad near 3600~3300 - confirm by C-O near 1300~1000 Amine: check for NH -medium peak near 3500 Ether: check for C-O near 1300~1000 2020/11/22 83

Analysis of Spectra 3. Double bonds/or Aromatic rings Alkene: -C=C is weak near 1650 Aromatic: -medium to strong at 1650~1450 Aromatic & vinyl CH: weak peak at 3000 4. Triple bond -C N: medium, sharp near 2250 -C C: weak, sharp near 2150 check also for acetylenic CH near 3300 2020/11/22 84

Analysis of Spectra 5. Nitro group - two strong peaks at 1600 -1500 & 1390 -1300 6. Hydrocarbon -none of above found -major peaks of CH near 3000 -very simple spectrum, others at 1450 & 1375 2020/11/22 85

Summary of IR Absorptions 2020/11/22 86

Characterization of IR Spectra 2020/11/22 87

Problem Set 1. Analysis of C 5 H 10 O IR Spectrum 2020/11/22 88

Problem Set 2. Analysis of C 8 H 8 O IR Spectrum 2020/11/22 89

Problem Set 3. Analysis of C 7 H 8 O IR Spectrum 2020/11/22 90

Problem Set 4. Analysis of C 8 H 7 N IR Spectrum 2020/11/22 91

Problem Set 5. Analysis: C 7 H 6 O IR Spectrum 2020/11/22 92

Problem Set 6. Analysis: C 3 H 7 NO IR Spectrum 2020/11/22 93

Problem Set 7. Analysis: C 4 H 8 O 2 IR Spectrum 2020/11/22 94

Problem Set 8. Analysis: C 7 H 5 OCl IR Spectrum 2020/11/22 95

Problem Set 9. Analysis: C 6 H 6 S IR Spectrum 2020/11/22 96

Problem Set 10. Analysis: C 4 H 6 IR Spectrum 2020/11/22 97

Solutions of Problem Set No. 1: 3 -pentanone No. 4: benzyl nitrile No. 7: ethyl acetate 2020/11/22 No. 2: acetophenone No. 5: benzaldehyde No. 8: benzoyl chloride No. 10: 1, 3 -butadiene No. 3: benzyl alcohol No. 6: N-methylacetamide No. 9: thiophenol 98

A Survey of the Important Functional Groups With Examples 2020/11/22 99

Characterization of IR Spectra 9. Hydrocarbons: Alkanes, Alkenes, and Alkynes A. Alkanes C-H stretch ~2980 - 2800 cm-1 CH 2 ~ 1450 CH 3 ~ 1375 C-C stretch : not useful for interpretation 2020/11/22 100

Characterization of IR Spectra B. Alkene =C-H stretch 3100 -3000 =C-H out-of-plane (oop) bending, 1000 -650 C=C 1660 -1600 (w) symmetrical type, no absorb symmetrical (cis), stronger 2020/11/22 101

Characterization of IR Spectra Aromatic rings =C-H stretch, 3100 ~ 3000 =C-H out-of-plane (oop) bending, 900 ~ 690 great utility to assign the ring substituted pattern C=C ring stretch, occurs in pair at 1600 & 1475 overtone/combination bands, 2000 ~ 1667 used to assign the ring substituted patterns 2020/11/22 102

Characterization of IR Spectra C. Alkynes C-H stretch ~ 3300 (3. 0 m) -C C stretch ~ 2150 (4. 65 m) disubstituted or symmetrical: no or weak absorption 2020/11/22 103

An Alkyne IR Spectrum 2020/11/22 104

Characterization of IR Spectra Table 2. Physical constants for sp, sp 2, sp 3 Hybridized carbon and the resulting C-H values Bond Type Length Strength IR freq. 2020/11/22 C-H sp- 1 s 1. 08Å 121 Kcal 3300 =C-H sp 2 - 1 s 1. 10Å 106 Kcal ~3100 -C-H sp 2 -1 s 1. 12Å 101 Kcal ~2900 105

Characterization of IR Spectra C-H Stretch Region 3300 3. 03 m 3100 3. 22 m 3000 3. 33 m acetylenic vinyl =C-H aliph. C-H arom. =C-H cyclopropyl -C-H sp sp 2 2850 3. 51 m 2750 3. 64 m aldehyde -CH=O sp 3 Strain moves absorption to left Increasing s character moves to left 2020/11/22 106

Characterization of IR Spectra Table 3. The stretching vibrations for various sp 3 hybridized C-H bonds Stretching vibration group Methyl CH 3 Methylene –CH 2 Methine –C-H 2020/11/22 asym. 2962 2926 2872 2853 2890 very weak 107

Characterization of IR Spectra C-H Bending Vibrations CH 2 CH 3 Scissoring 1465 Bending (as. ) bending (sy. ) 1450 Sometimes overlap 1375 1380 1370 Lone Me g’p Gem-dimethyl CH 2, ~ 720 rocking band 2020/11/22 108

Characterization of IR Spectra C=C Stretching Vibrations Conjugated effects. 1660 -1640 cm-1 Ring size effects. The frequency of (endo) double bonds in cyclic compounds is sensitive to ring size. 2020/11/22 Higher freq. 109

Characterization of IR Spectra 1650 1646 1611 1566 Angle > 90 1641 Angle < 90 ~ 1611 Figure 3. C=C Stretching vibrations in endocyclic Systems 2020/11/22 110

Characterization of IR Spectra External (exo) double bonds 1950 1780 1678 1657 1655 1651 H 2 C=C=CH 2 Allene (a) Strain moves the peak to the left (b) Ring fusion moves the absorption to the left 2020/11/22 111

Characterization of IR Spectra C-H Bending Vibrations for Alkenes In-plane scissoring: ~ 1415 Out-of-plane region: 1000 ~ 650 Valuable to indicate the substitution patterns 2020/11/22 112

Characterization of IR Spectra 10 11 12 13 14 15 m Monosubst. s s s cis-1, 2 trans-1, 2 1, 1 -disubst. trisubst. s s m tetrasubst. 1000 900 800 700 cm-1 Figure. The C-H out-of-plane bending vibrations for 2020/11/22 substituted alkenes 113

11 12 13 14 15 m Monosubst. s Ortho s m Meta s s Para m 1, 2, 4 - s s 1, 2, 3 - m s m 900 800 700 cm-1 1, 3, 5 - 2020/11/22 C-H oop C=C oop 114

Characterization of IR Spectra D. Alcohols and Phenols O-H “free” O-H C-O 2020/11/22 sharp, 3650~3600 if no H-bonding. H-bonded O-H, broad at 3500~3200 , usually in neat (pure) liquids. 1250~1000(s) 115

An Alcohol IR Spectrum 2020/11/22 116

Characterization of IR Spectra Table. The C-O and O-H stretching vibrations in Alcohols and Phenol Compound Phenols 3 - OH 2 - OH 1 - OH 2020/11/22 1100 1070 C-O stretch 1220 1150 1100 1050 1100 1070 O-H stretch 3610 3620 3630 3640 1050 1017 117

Characterization of IR Spectra E. Ethers C-O stretch, 1300 ~ 1000 phenyl & vinyl ethers, shift to higher frequency (increase of double bond character) 1250 (asy), 1040 (sy). Epoxides, 3 bands (1250, 950~815, 850~750) 2020/11/22 118

Characterization of IR Spectra F. Carbonyl compounds 1810 1800 1760 acid chloride Anhydride anhydride (band 1) (band 2) 2020/11/22 1735 1725 1710 ester ketone aldehyde carboxylic acid 1690 amide 119

Characterization of IR Spectra F-1. Factors affect C=O vibration 1. Conjugated effects. a, b-unsaturated, 30 cm-1 to lower freq. 1715 1690 2020/11/22 1725 1700 1710 1680 120

Characterization of IR Spectra 2. Ring size effects 1715 1745 2020/11/22 1715 1780 1735 1770 1690 1705 121

Characterization of IR Spectra 3. Alpha-substitution effects Axial Cl ~ 1725 2020/11/22 Equatorial Cl ~ 1750 122

Characterization of IR Spectra 4. Hydrogen Bonding Effects 1680 2020/11/22 123

Characterization of IR Spectra 5. Cyclic ketones 1815 1780 1745 1715 1705 Ring strain 2020/11/22 124

Characterization of IR Spectra 6. Carboxylic Acids O-H stretch, very broad (strongly H-bond) 3400 ~ 2400 C=O stretch, broad, 1730 ~ 1700 C-O stretch, 1320 ~ 1210 (m) 2020/11/22 125

Characterization of IR Spectra 7. Esters (R-C(=O)-O-R’) C=O stretch, 1735 a. conjugation at the R part: ν shift to the right b. conjugation with O at R’ ν part: shift to the left c. ring strain (lactones): ν shift to the left C-O stretch, two or more bands, one stronger and broader, 1300 ~ 1000 2020/11/22 126

Characterization of IR Spectra Table. The general effects of a, b-unsaturation or aryl Substitution and conjugation with oxygen on the C=O vibrations 1770 2020/11/22 1735 1720 127

Characterization of IR Spectra Table. The Effects of Ring Size, a, b-unsaturation, and Conjugation with Oxygen in the C=O Vibrations in Lactones 1735 1770 1720 1760 1750 1800 1820 2020/11/22 128

Characterization of IR Spectra 8. Amides C=O stretch, 1670 ~ 1640 N-H stretch (1 and 2 ), 3500, 3100 N-H bending, 1640 ~ 1550 ~ 1660 2020/11/22 ~ 1705 ~ 1745 129

Characterization of IR Spectra 9. Acid Chlorides C=O stretch at ~ 1800 conjugation moves to the right 10. Anhydrides C=O stretch, two bands, 1830~1800 & 1775~1740 ring strain moves to the left C-O stretch, 1300 ~ 900 2020/11/22 130

Characterization of IR Spectra G. Amines N-H stretch, 3500~3300 1 -, 2 bands; 2 -, 1 band weak, aliphatic amines stronger, aromatic amines N-H bend, 1640~ 1560 2 -, near 1500 N-H oop bending, near 800 C-N stretch, 1350 ~ 1000 2020/11/22 131

Characterization of IR Spectra H. Nitriles, Isocyanates and Imines -C N stretch, sharp ~ 2250 -N=C=O a broad, intense band ~ 2270 -N=C=S a broad, intense band ~ 2125 -C=N- in imine or oxime 1690 -1640 C C give much weak band at ~ 2250 region. 2020/11/22 132

Characterization of IR Spectra J. Nitro Compounds N=O stretch, two strong bands, 1600 ~ 1500 & 1390 ~ 1300 Nitroalkanes: ~ 1550, 1380 Nitroarenes: ~ 1530, 1350 Nitroso (R-N=O) one band, 1600 ~ 1500 2020/11/22 133

Characterization of IR Spectra J-1. Carboxylate Salts, RC(=O)-Oasym ~1600 (s) sym ~1400 (s) J-2. Amine Salts 2020/11/22 N-H stretch (broad), 3300 ~ 2600 N-H bend, 1610 ~ 1500 (s) 1 (two bands), 1610, 1500 2 (one band), 1610 ~ 1550 134

Characterization of IR Spectra K. Sulfur Compounds Mercaptans S-H stretch, ~ 2550 (w) Sulfides, R-S-R Sulfoxides, R-S(=O)-R S=O stretch, ~1050 (s) Sulfones, RSO 2 R S=O 1300 (s), 1150 (s) Sulfates RSO 3 R S=O 1375(s), 1200(s) S-O 1000~750 Sulfonamides RSO 2 NH 2, RSO 2 NHR S=O 1325 (s), 1140 (s) N-H 3350, 3250 (1 ) 3250 (2 ) 2020/11/22 135

Characterization of IR Spectra L. Alkyl and Aryl Halides Fluorides C-F stretch, 1400~1000 (s) Chlorides C-Cl stretch, 800~ 600 (s) CH 2 -Cl bend (wagging), 1300 ~ 1200 Bromides/Iodides C-Br/C-I stretch, ~ 660 out of range CH 2 -Br/CH 2 -I bend (wagging), 1250 ~ 1150 2020/11/22 136

Infrared Sources and Transducers Infrared sources: An inert solid with continuous radiation at heated temperature: 1500 ~ 2000 K. Range of radiation intensity: 5000 ~ 670 cm-1 (2 ~ 15 m. M) 2020/11/22 137

1. The Nernst Glower temperature: 1200 ~ 2200 K 2. The Globar Source a silicon carbide rod electrically heated (1300 ~ 1500 K) 2020/11/22 138

Sample Handling Techniques n Neat liquids: 一滴樣品夾於二鹽片(rock-salt plate)間(厚 度約為 ≦ 0. 01 mm), a neat spectrum obtained. 一般 僅適合用於定性的分析. n Solids: n n KBr pellet: 2 ~ 5 mg sample, mixing with 100~150 mg of powdered KBr, pressing with pressure of 5 ~ 10 Ton to give a transparent disc. n KBr is hygroscopic, weak OH band at 3450 cm-1 appeared Nujol mull: grinding the sample with mineral oil (Nujol) to create a suspension and placed between salt plates n Solutions: compound dissolved in common solvents, ex. CS 2, CCl 4, CHCl 3, dioxane, cyclohexane, benzene. 2020/11/22 139

2020/11/22 140

2020/11/22 141
 Near infrared spectroscopy instrumentation
 Nitro group ir peak
 Infrared spectroscopy theory
 Infrared spectroscopy ppt
 Spectroscopy infrared
 Infrared vs bluetooth
 Infrared vs bluetooth
 Pengertian infrared
 Bill nye light and optics
 Characteristic of infrared waves
 Infrared spektroskopisi
 What is an infrared thermometer best used for servsafe
 Shortwave infrared camera
 Bluetooth vs infrared
 Manufacturer infrared heating
 Herschel infrared discovery
 Thermal infrared
 Drainage network
 Advantage and disadvantage of touch screen
 Nirops
 Wide field infrared survey explorer
 Electro magnetic scale
 Infrared radiation hazards
 Infrared sensor principle
 Infrared building envelope
 Made up school
 Catalytic heater oil and gas
 Introduction to molecular spectroscopy
 Charge d'un électron
 Body paragraph
 What is spectroscopy
 Woodward fieser rules examples
 Terahertz spectroscopy principles and applications
 Definition of ir spectroscopy
 Absorbance chemistry
 Sample holder in ir spectroscopy
 Pengertian ssa
 What is the difference between ftir and raman spectroscopy
 Difference between ir and raman spectroscopy
 Nmr associates
 Objectives of spectroscopy
 Pes spectroscopy
 Stretching and bending vibrations in ir spectroscopy
 Mass spectroscopy principle
 Advantages of nmr spectroscopy
 Gross and specific selection rules
 Introduction to spectrophotometry
 Pes spectrum for magnesium
 Dept nmr spectroscopy
 Low na
 Ortec renaissance
 Periklis papadopoulos
 Application for ir spectroscopy
 Stretching and bending vibrations in ir spectroscopy
 Interferogram
 Components of flame photometer
 Dispersive ir spectroscopy
 C triple bond n ir spectra
 Theory of atomic absorption spectroscopy
 Principle of fluorescence spectroscopy
 Atomic emission spectroscopy ppt
 Atomic emission spectroscopy principle
 Principle of atomic absorption
 Nebulizer in aas
 Applications of uv visible spectroscopy
 Spectroscopy ap chem
 Photoelectron spectroscopy ap chemistry
 How is beer-lambert law used in spectroscopy
 Spectroscopy definition
 Lambert beer law and its limitations
 Auxochrome in uv spectroscopy
 Beer lambert law definition
 Application of woodward fieser rule
 Selection rules for raman spectroscopy
 Props wikipedia
 Uv vis spectroscopy in pharmaceutical analysis
 Laser diffraction spectroscopy
 Principle of mossbauer spectroscopy
 Application of rotational spectroscopy
 Rotational spectroscopy
 Difference between atomic and molecular spectroscopy
 Gas separation
 Hook's law describes the relationship between:
 Chirped pulse fourier transform microwave spectroscopy
 Erzeng
 Jpl molecular spectroscopy
 Impedance definition
 Applications of atomic emission spectroscopy
 Interference of atomic absorption spectroscopy
 Flame aas
 Spectroscopy jokes
 Vernier spectral analysis
 Spectroscopy problem set
 Use of raman spectroscopy
 Ir spectroscopy provides information about
 Conjugation in spectroscopy
 Fes spectroscopy
 Atomic fluorescence spectroscopy principle
 Atomic emission spectroscopy lecture notes
 Application of atomic absorption spectroscopy
 Kaiser raman probe
 Absorbtion spectroscopy
 Spectroscopy
 Slit spectroscopy
 Slit spectroscopy
 Mossbauer spectroscopy
 Mossbauer spectroscopy
 Spectroscopy
 Mossbauer spectroscopy
 Mossbauer spectroscopy
 Photoluminescence spectroscopy
 Spectroscopy
 Mossbauer spectroscopy
 Bu organic chemistry
 Xray photoelectron spectroscopy
 Spectroscopy
 Raman spectroscopy disadvantages
 Ir spectroscopy
 P-diethylbenzene nmr
 Non rigid rotator
 Rotational spectral lines
 Benzene and acetone deviation
 Principle of absorption
 Absorption equation
 Nmr spectroscopy
 Factors affecting chemical shift
 Larmor frequency
 Microwave spectroscopy definition
 Spectroscopy types
 Isms2017
 Ir spectroscopy
 Carboxylic acid ir
 Spectroscopy
 Ir spectra chart
 Rotational spectroscopy notes
 Explain quantum yield
 Electrochemical impedance spectroscopy
 Reflectance spectroscopy
 Machine learning in astronomy
 Spatially resolved acoustic spectroscopy
 International symposium on molecular spectroscopy
 Principles of fluorescence spectroscopy
