Remote Sensing in Environmental Research Georgios Aim Skianis


")


. City of Pyrgos (Western Peloponnesos) Brightness value (tonality) of")
 Channel 3 (red) Channel 4 (NIR, 0. 76 -0. 9 μm)")
 RGB 432 (NIR, Red, Green)")
")
 RGB 432 (NIR, Red, Green) RGB 421 (NIR, Green,")


 Landsat image over Mesologi-Evinos river Thermal infrared image of the")


, L-HV (green) και C-HH (blue). Endeavour SIR-CX-SAR")
, mean value L-VV and C-VV (green)")

 • Image enhancement (contrast")


 image")


 before and after the floods")


 by a Landsat image")
- Slides: 47
Remote Sensing in Environmental Research Georgios Aim. Skianis University of Athens, Faculty of Geology and Geo-Environment, Department of Geography and Climatology, Remote Sensing Laboratory.
1. Physical principles 2. Platforms and Sensors 3. Images at the visible and infrared spectrum 4. Images at thermal infrared spectrum 5. Radar images 6. Image analysis 7. Some environmental applications
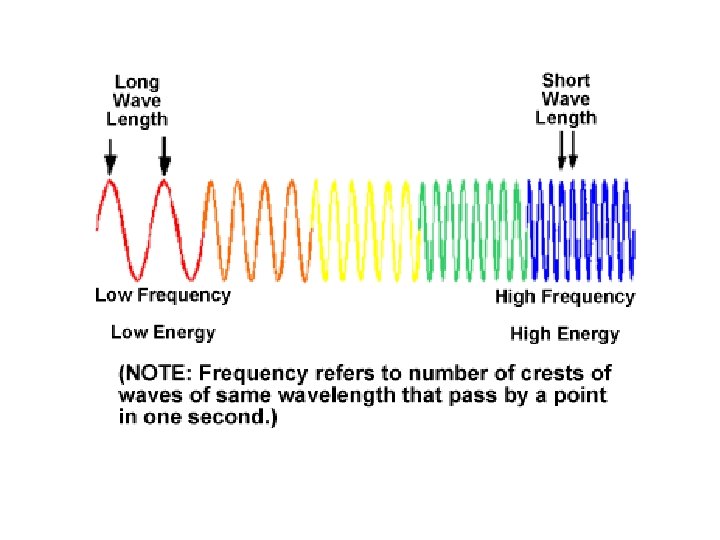
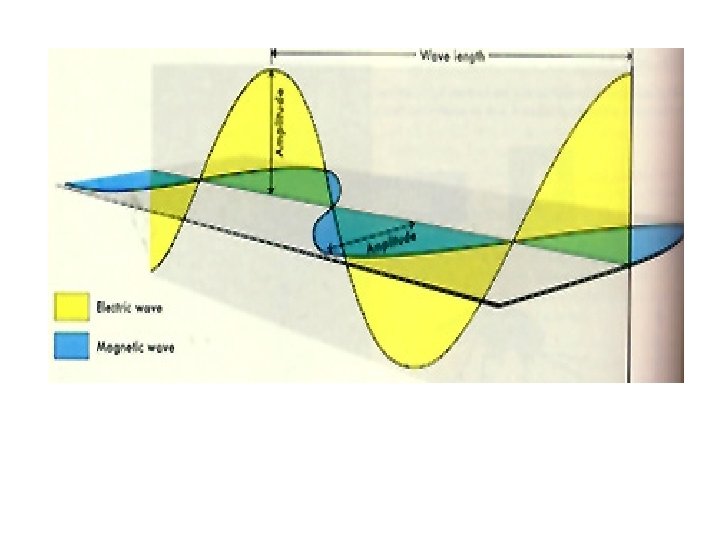
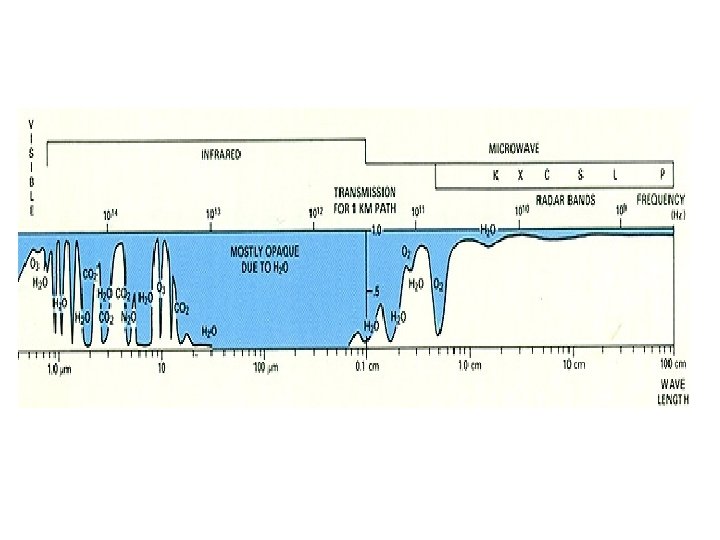
1. Physical Principles
Red, Green, Blue additive colors Green channel 2 Blue channel 1 Red channel 3
RGB 321 (color composite)
Spectral Signature
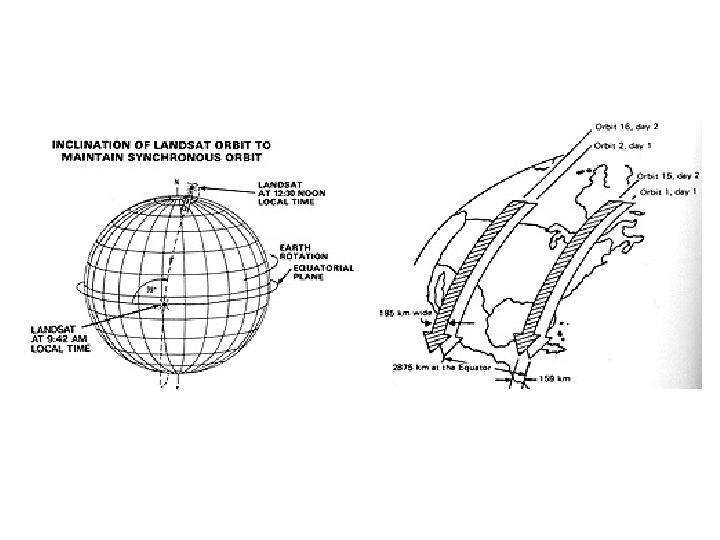
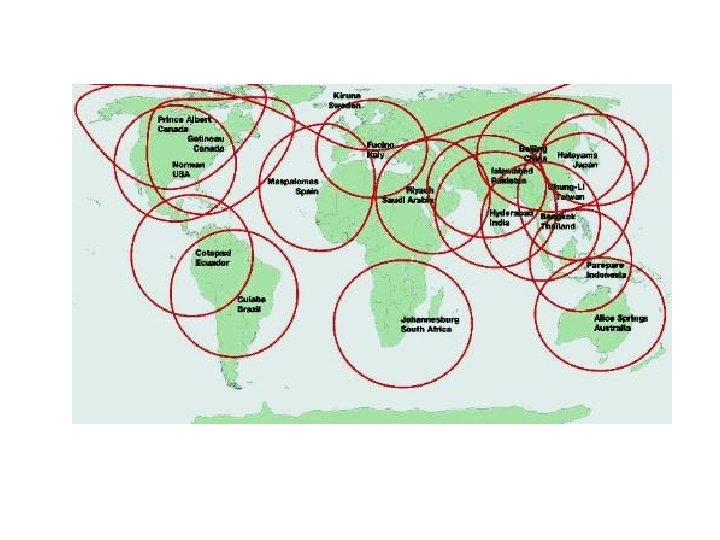
2. Platforms, Scanners and Sensors
3. Images at the visible and infrared spectrum
Landsat ETM channel 1 (blue). City of Pyrgos (Western Peloponnesos) Brightness value (tonality) of each pixel
Channel 2 (green) Channel 3 (red) Channel 4 (NIR, 0. 76 -0. 9 μm) Channel 5 (middle infarred, 1. 55 -1. 75 μm)
RGB 321 (Red, Green, Blue) RGB 432 (NIR, Red, Green)
RGB 542 (Middle Infrared, NIR, Red)
Landsat natural colors (RGB 321) RGB 432 (NIR, Red, Green) RGB 421 (NIR, Green, Blue) RGB 742 (middle infrared, NIR, Green)
4. Images at thermal infrared spectrum Τrad = ε 1/4. Τkin P T radiant, emissivity, T kinetik thermal inertia (how easy does the temperature change)
As long as thermal inertia increases, temperature variation decreases
RGB 321 (natural colors) Landsat image over Mesologi-Evinos river Thermal infrared image of the same region
Landsat nocturnal image of the lakes Ontario and Erie, USA
L = c. DN Landsat image, thermal infrared channel A map of temperatures
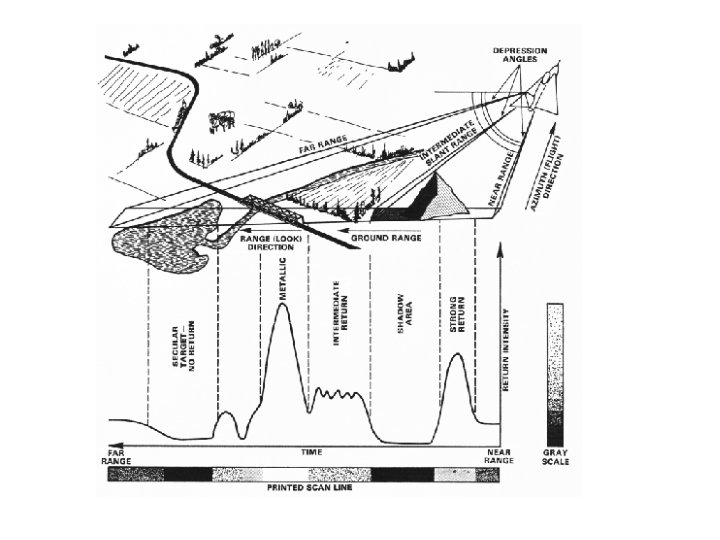
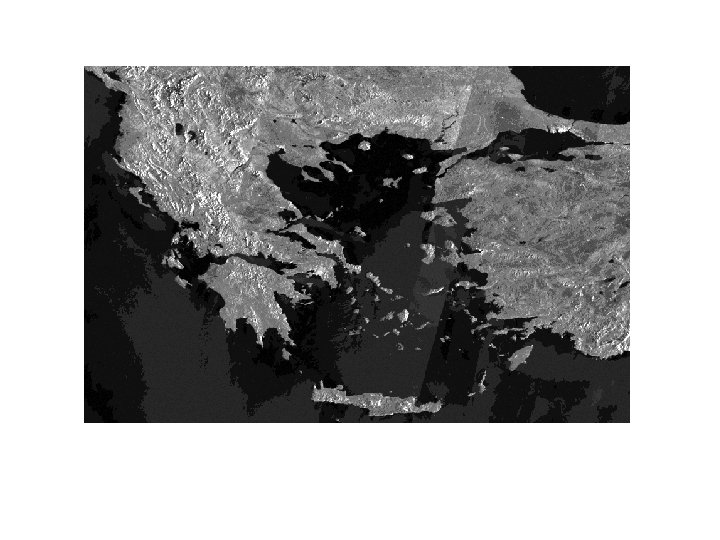
5. Radar Images Active Passive remote sensing
Radar image, ERS-1, Udine, Italy Landsat image, Udine, Italy
Zone L, Polarization HH, Endeavour SIR-CX-SAR Zone L, Polarization HV, Endeavour SIR-CX-SAR
RGB L-HH (red), L-HV (green) και C-HH (blue). Endeavour SIR-CX-SAR
Detection of an oil spill RGB L-VV (red), mean value L-VV and C-VV (green) and C-VV (blue). Οι εικόνες ελήφθησαν από το σύστημα Endeavour, SIR-CX-SAR. Mumbai, India
Radar may penetrate certain meters below ground surface Radar image L-HH, SIR-A, over Sahara Desert. The Landsat image is represented by yelloworange colors.
6. Image Analysis • Preprocessing (georeferencing, atmospheric correction, destriping, …) • Image enhancement (contrast enhancement, image sharpening, edge detection, …) • Information extraction (vegetation indices, classification, principal component analysis, …)
Atmospheric correction
Landsat RGB 321 image Atmospherically corrected image
Destriping Initial image Filtered (destriped) image
Contrast enhancement Initial Linear stretch Equalization
Edge detection – 1 0 1 fx = – 2 0 2 – 1 0 1 Initial image 1 2 1 fy = 0 0 0 – 2 – 1 Sobel filter Filtered image
Classification Spectral domain
Training fields
Classified image
7. Some environmental applications Thermal channel Detection of submarine carstic springs Contrast enhanced temperature map of the Argolic Bay
Mapping of the drainage network The drainage network of a region of Southern Yemen, as it appears in a Landsat image
Mapping of floods Satellite images of Elvas river (Germany) before and after the floods of 2000
Land cover mapping using vegetation indices Satellite image of Nile river, Egypt, in natural colors The NDVI vegetation index of the region. NDVI = (NIR-Red)/(NIR +Red)
Mapping burnt areas NDVI image produced by an ALOS multispectral image
Oceanography Terra Modis satellite image over the Gulf of Mexico. The meandric structure with the bright tones is the Gulf stream.
Archaeology Detection of the ancient city of Ubar (Arabic Peninsula) by a Landsat image