
Electrical and MagnetoTransport Properties of Reduced Graphene Oxide

- Slides: 53
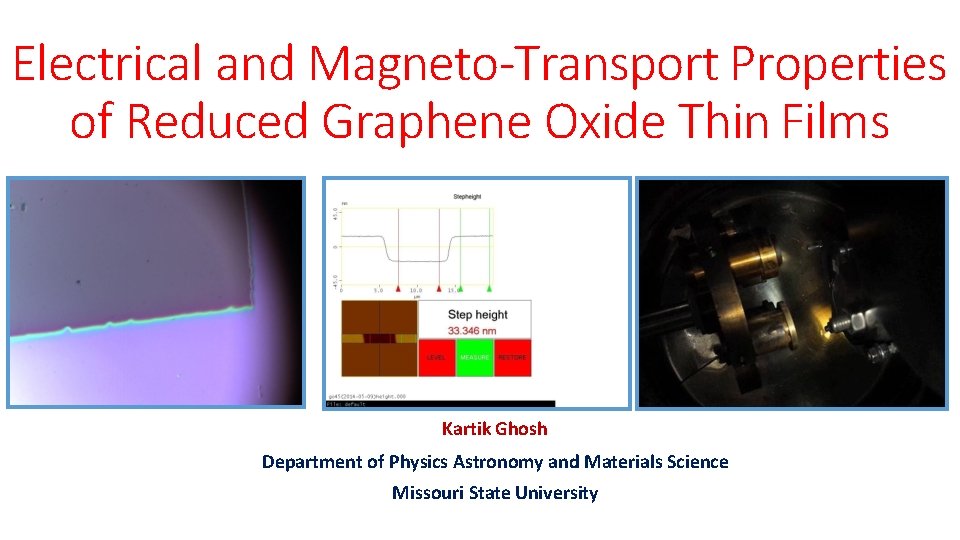
Electrical and Magneto-Transport Properties of Reduced Graphene Oxide Thin Films Kartik Ghosh Department of Physics Astronomy and Materials Science Missouri State University
Outline Introduction 2 D Materials Graphene, Graphene oxide and its properties Results and Discussion Raman spectroscopy XRD XPS Photoluminescence spectroscopy Hall measurement Resistance vs Temperature measurement Magneto-resistance Conclusions and Future Works
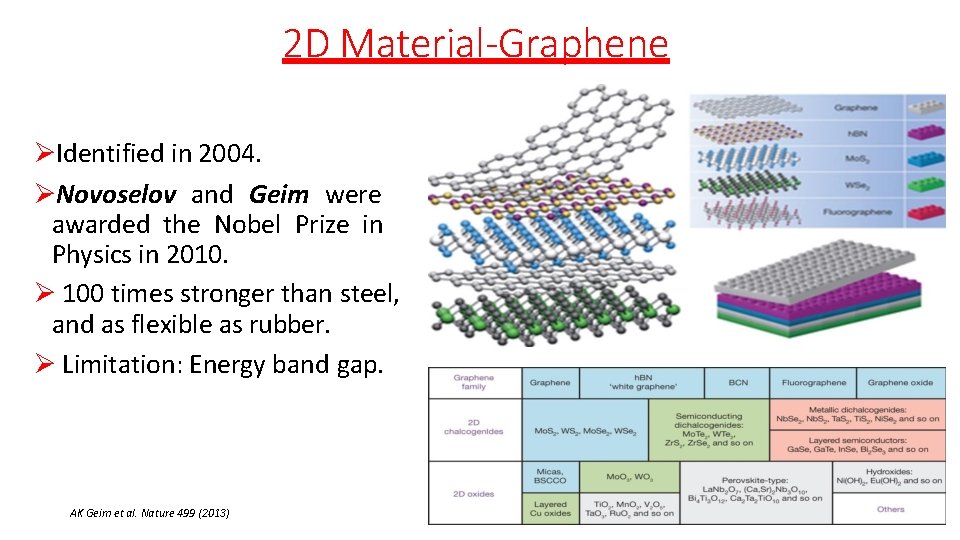
2 D Material-Graphene Identified in 2004. Novoselov and Geim were awarded the Nobel Prize in Physics in 2010. 100 times stronger than steel, and as flexible as rubber. Limitation: Energy band gap. AK Geim et al. Nature 499 (2013)
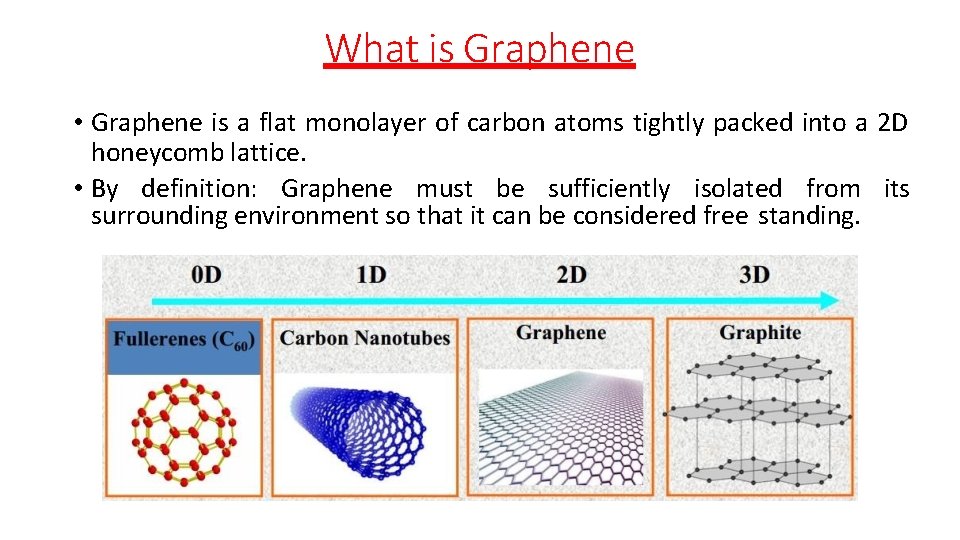
What is Graphene • Graphene is a flat monolayer of carbon atoms tightly packed into a 2 D honeycomb lattice. • By definition: Graphene must be sufficiently isolated from its surrounding environment so that it can be considered free standing.
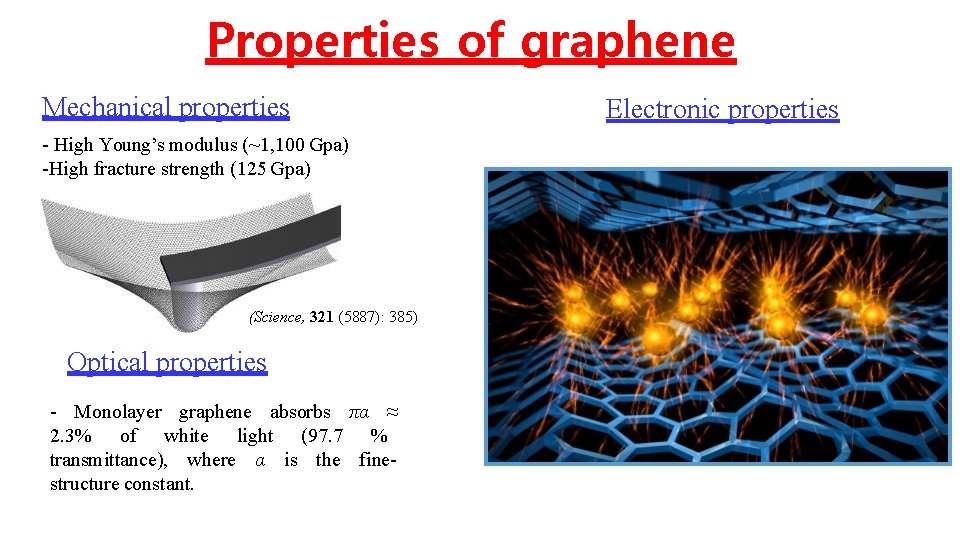
Properties of graphene Mechanical properties - High Young’s modulus (~1, 100 Gpa) -High fracture strength (125 Gpa) (Science, 321 (5887): 385) Optical properties - Monolayer graphene absorbs πα ≈ 2. 3% of white light (97. 7 % transmittance), where α is the finestructure constant. Electronic properties
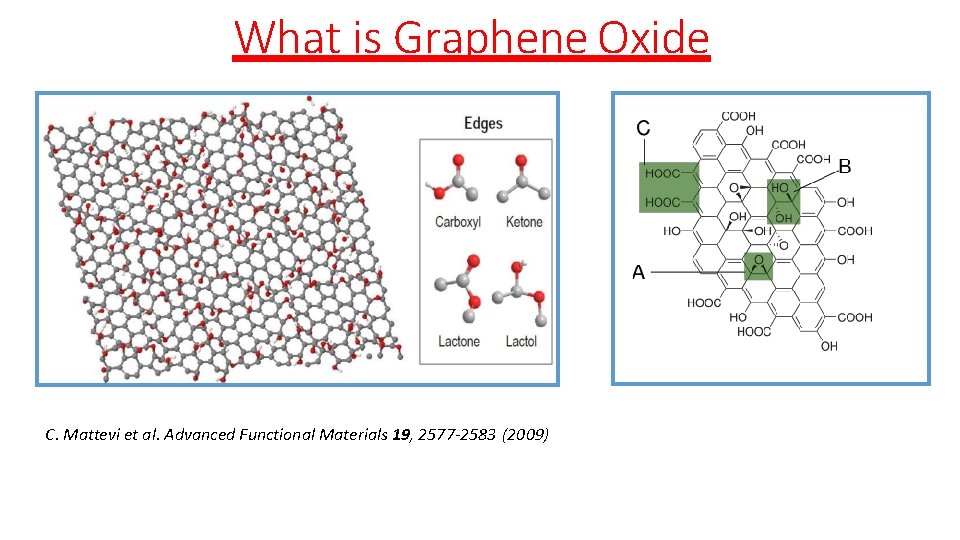
What is Graphene Oxide C. Mattevi et al. Advanced Functional Materials 19, 2577 -2583 (2009)
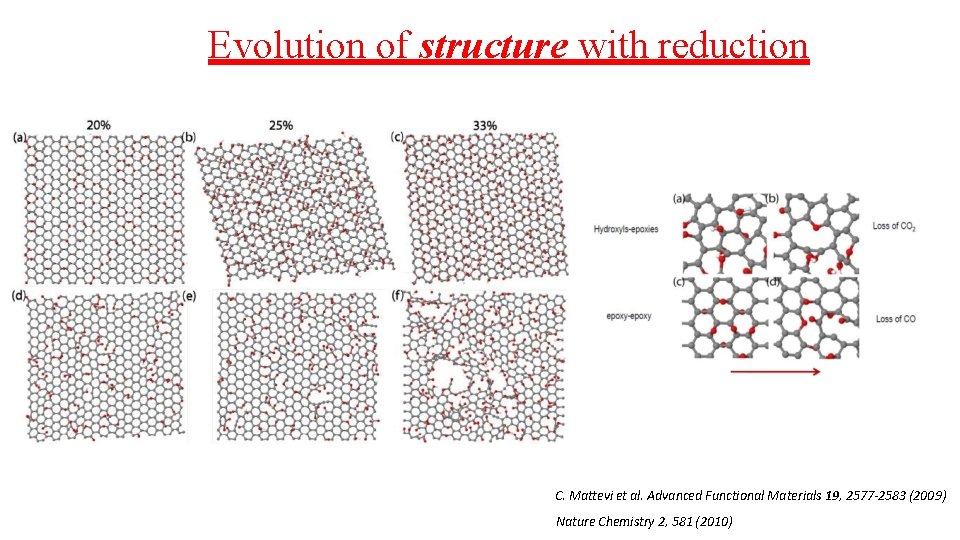
Evolution of structure with reduction C. Mattevi et al. Advanced Functional Materials 19, 2577 -2583 (2009) Nature Chemistry 2, 581 (2010)
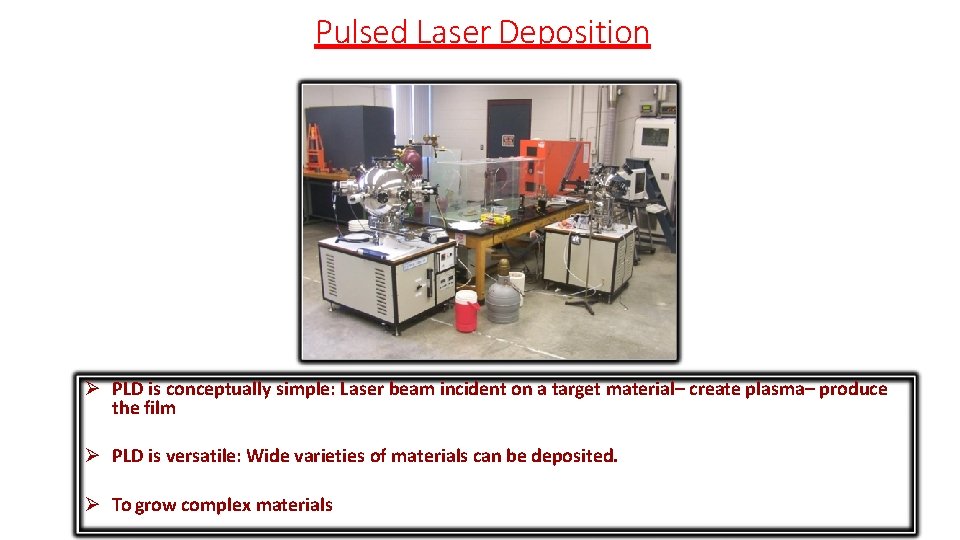
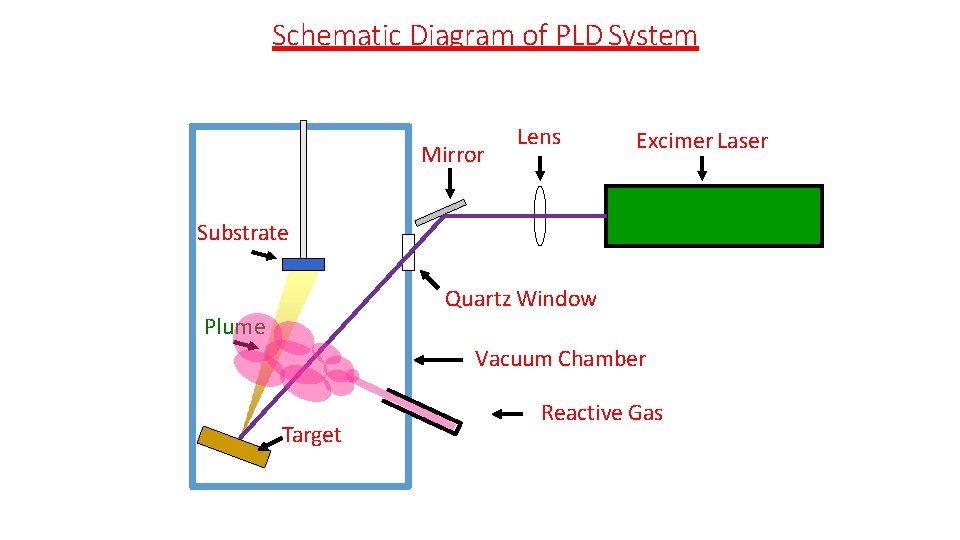
Pulsed Laser Deposition PLD is conceptually simple: Laser beam incident on a target material– create plasma– produce the film PLD is versatile: Wide varieties of materials can be deposited. To grow complex materials
Schematic Diagram of PLD System Mirror Lens Excimer Laser Substrate Quartz Window Plume Vacuum Chamber Target Reactive Gas
Motivation behind this research work • How does the GO structure (chemical, atomic, electronic) evolve upon reduction? • How do the properties (optical, electrical) change on reduction? • What are the limiting factors for mobility and conductivity of r. GO?
Results and Discussion on Reduced Graphene Oxide : Our Research work
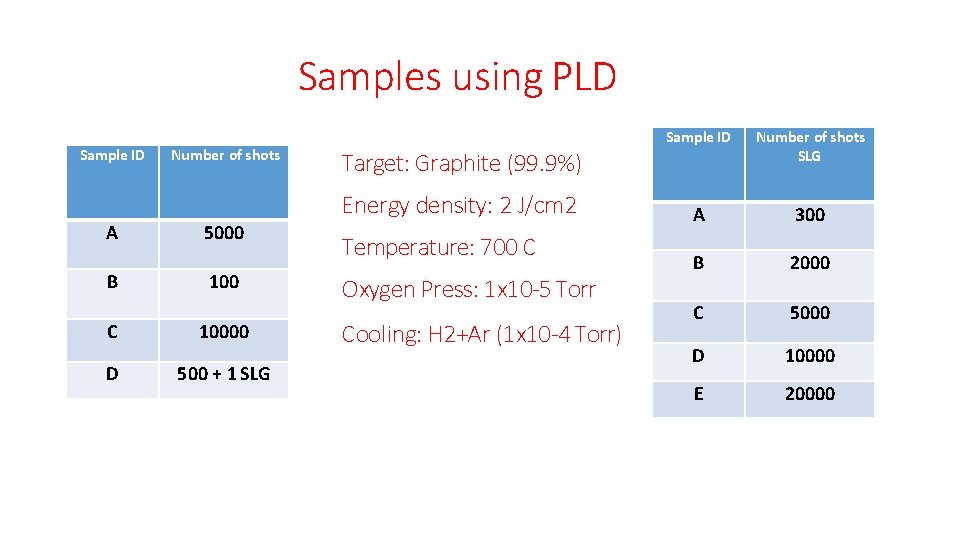
Samples using PLD Sample ID Number of shots B 5000 100 C 10000 D 500 + 1 SLG Number of shots SLG A 300 B 2000 C 5000 D 10000 E 20000 Target: Graphite (99. 9%) Energy density: 2 J/cm 2 A Sample ID Temperature: 700 C Oxygen Press: 1 x 10 -5 Torr Cooling: H 2+Ar (1 x 10 -4 Torr)
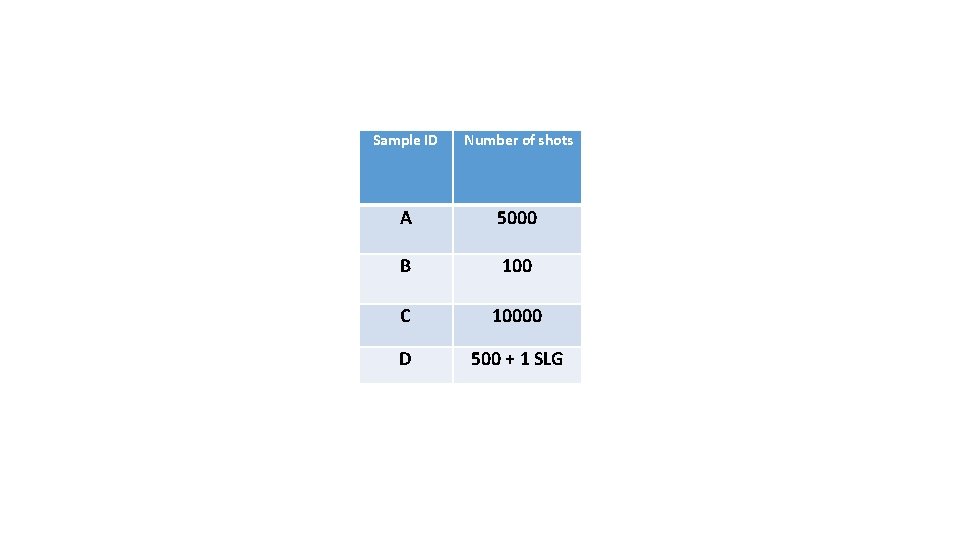
Sample ID Number of shots A 5000 B 100 C 10000 D 500 + 1 SLG
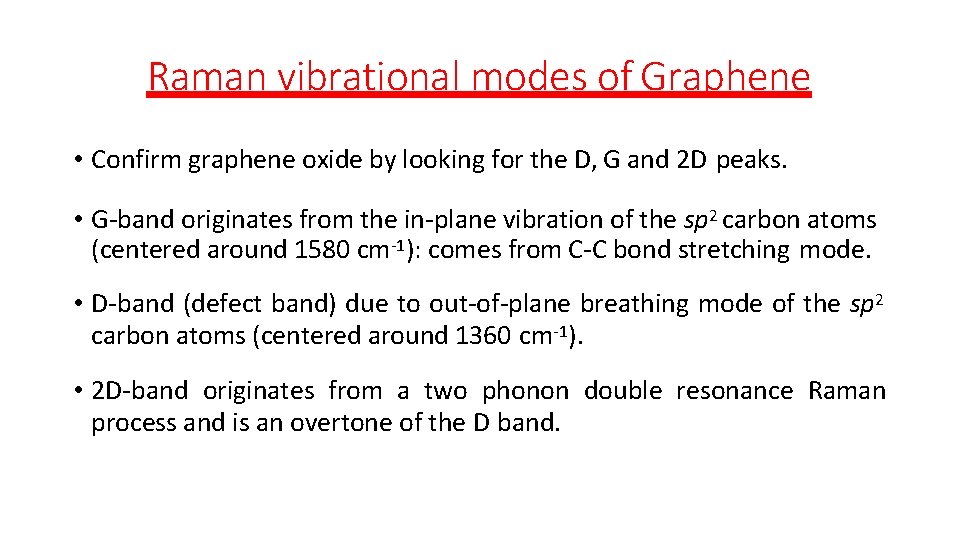
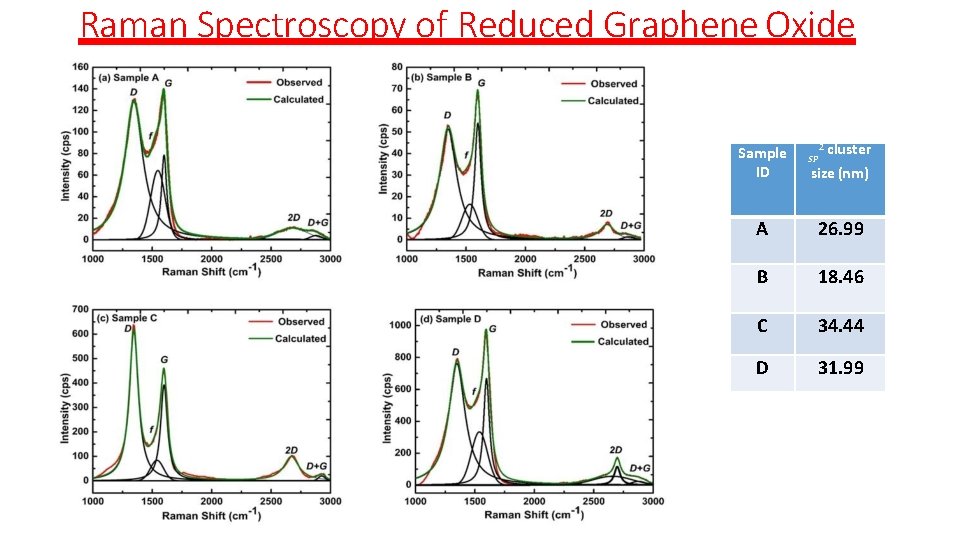
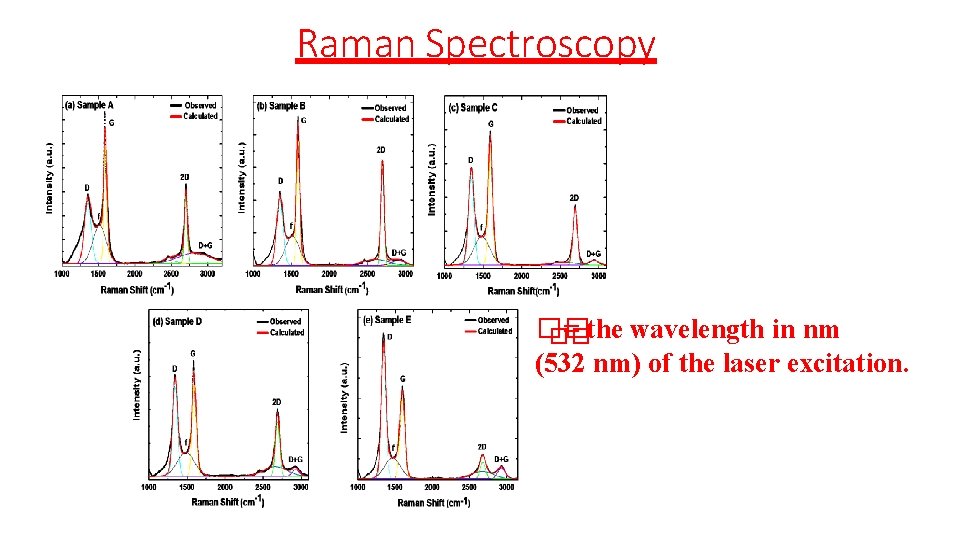
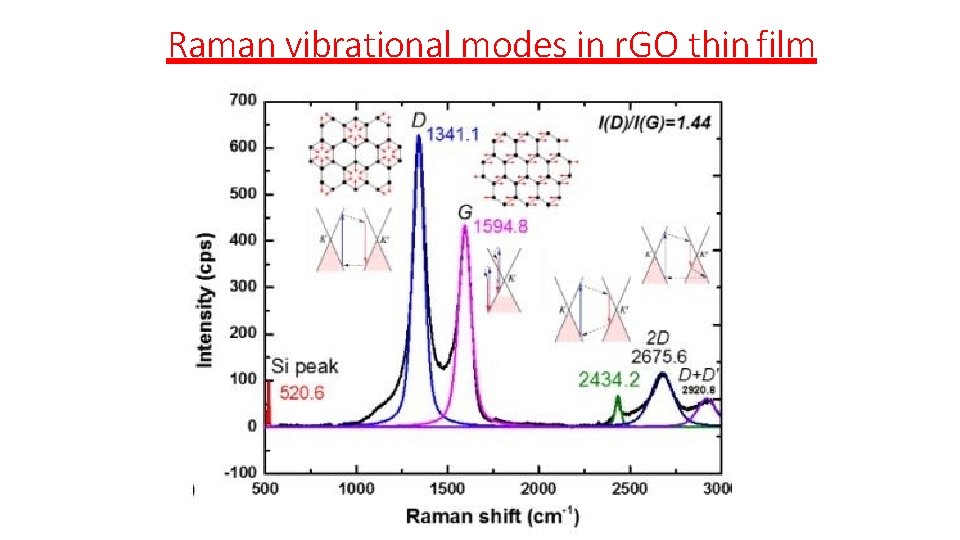
Raman vibrational modes of Graphene • Confirm graphene oxide by looking for the D, G and 2 D peaks. • G-band originates from the in-plane vibration of the sp 2 carbon atoms (centered around 1580 cm-1): comes from C-C bond stretching mode. • D-band (defect band) due to out-of-plane breathing mode of the sp 2 carbon atoms (centered around 1360 cm-1). • 2 D-band originates from a two phonon double resonance Raman process and is an overtone of the D band.
Raman Spectroscopy of Reduced Graphene Oxide Sample ID SP 2 cluster size (nm) A 26. 99 B 18. 46 C 34. 44 D 31. 99
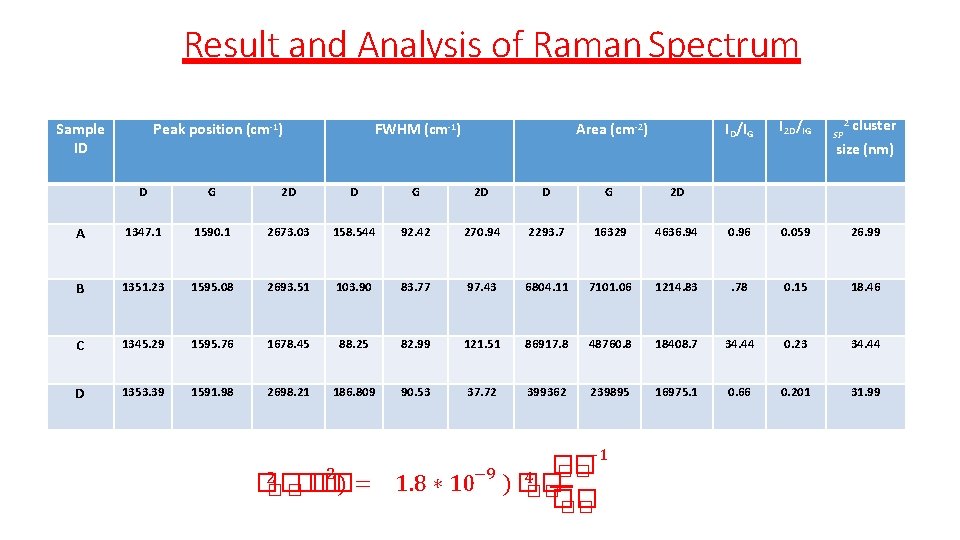
Result and Analysis of Raman Spectrum Sample ID Peak position (cm-1) FWHM (cm-1) Area (cm-2) ID/IG I 2 D/IG SP 2 cluster size (nm) D G 2 D A 1347. 1 1590. 1 2673. 03 158. 544 92. 42 270. 94 2293. 7 16329 4636. 94 0. 96 0. 059 26. 99 B 1351. 23 1595. 08 2693. 51 103. 90 83. 77 97. 43 6804. 11 7101. 06 1214. 83 . 78 0. 15 18. 46 C 1345. 29 1595. 76 1678. 45 88. 25 82. 99 121. 51 86917. 8 48760. 8 18408. 7 34. 44 0. 23 34. 44 D 1353. 39 1591. 98 2698. 21 186. 809 90. 53 37. 72 399362 239895 16975. 1 0. 66 0. 201 31. 99 2 2 �� �� �� )= �� 1. 8 ∗ − 1 �� �� − 9 4 10 ) �� ��
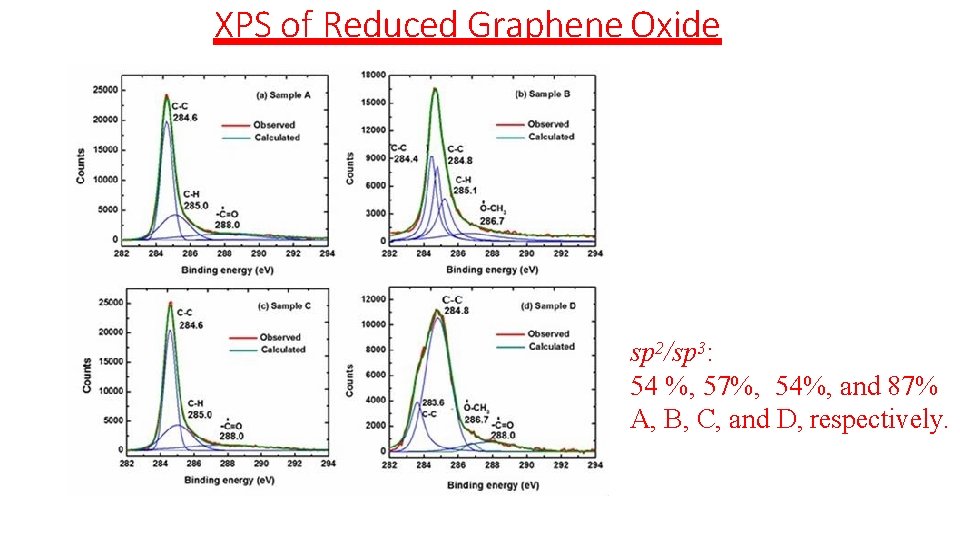
XPS of Reduced Graphene Oxide sp 2/sp 3: 54 %, 57%, 54%, and 87% A, B, C, and D, respectively.
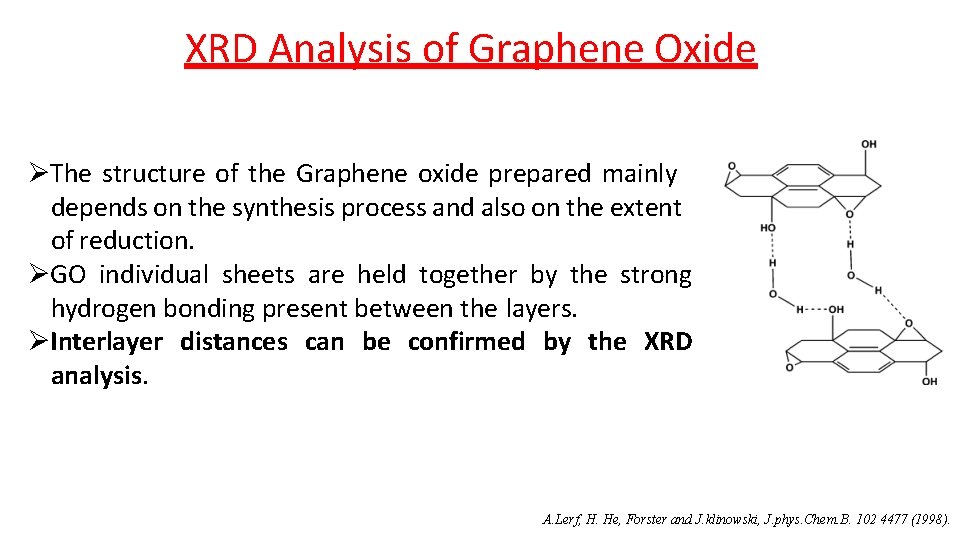
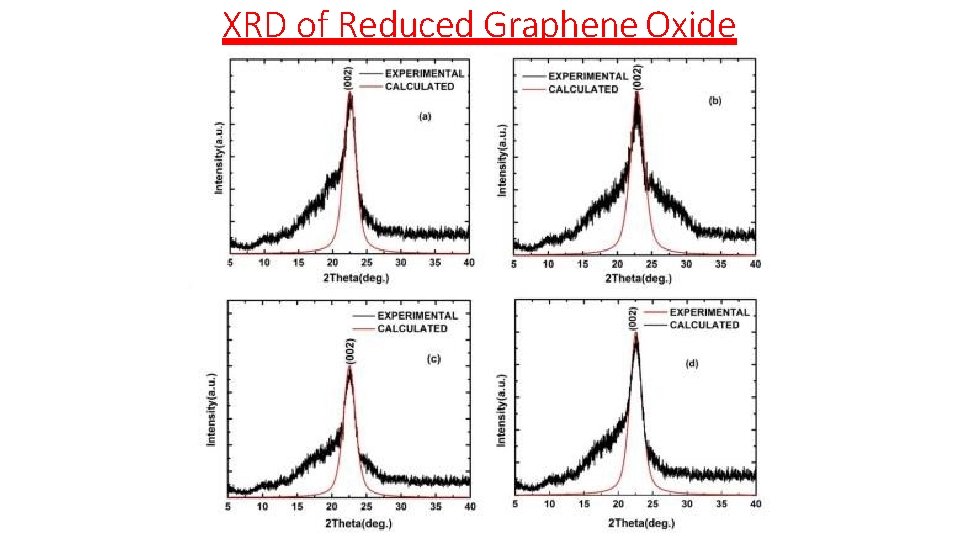
XRD Analysis of Graphene Oxide The structure of the Graphene oxide prepared mainly depends on the synthesis process and also on the extent of reduction. GO individual sheets are held together by the strong hydrogen bonding present between the layers. Interlayer distances can be confirmed by the XRD analysis. A. Lerf, H. He, Forster and J. klinowski, J. phys. Chem. B. 102 4477 (1998).
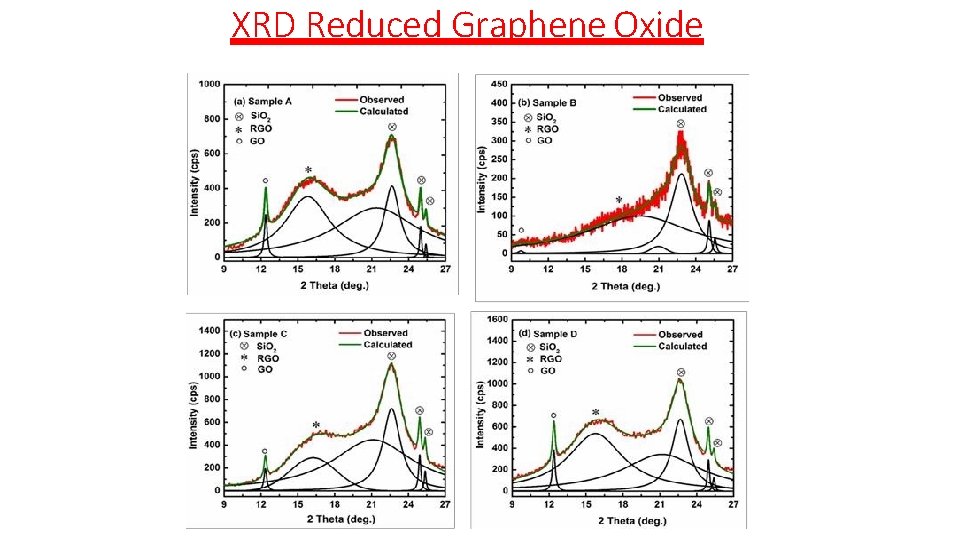
XRD Reduced Graphene Oxide
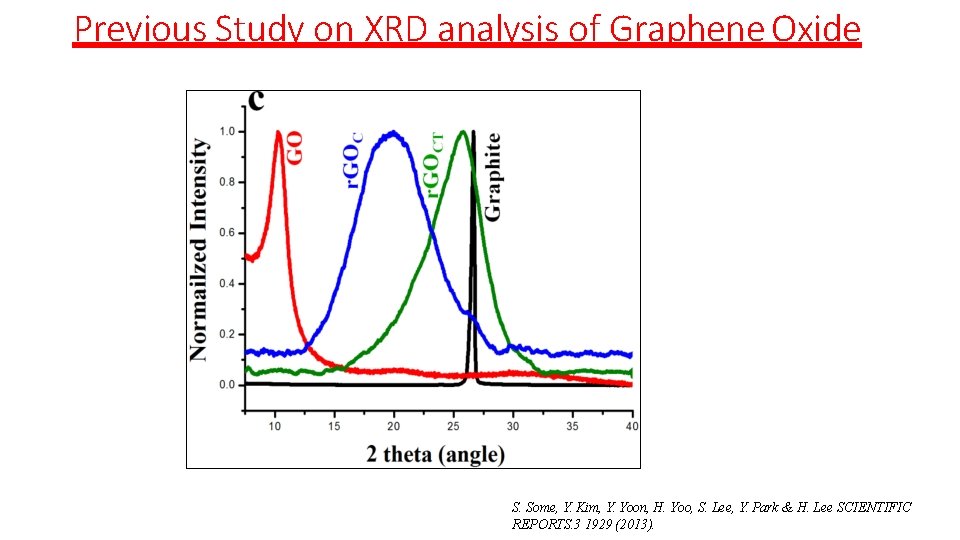
Previous Study on XRD analysis of Graphene Oxide S. Some, Y. Kim, Y. Yoon, H. Yoo, S. Lee, Y. Park & H. Lee SCIENTIFIC REPORTS. 3 1929 (2013).
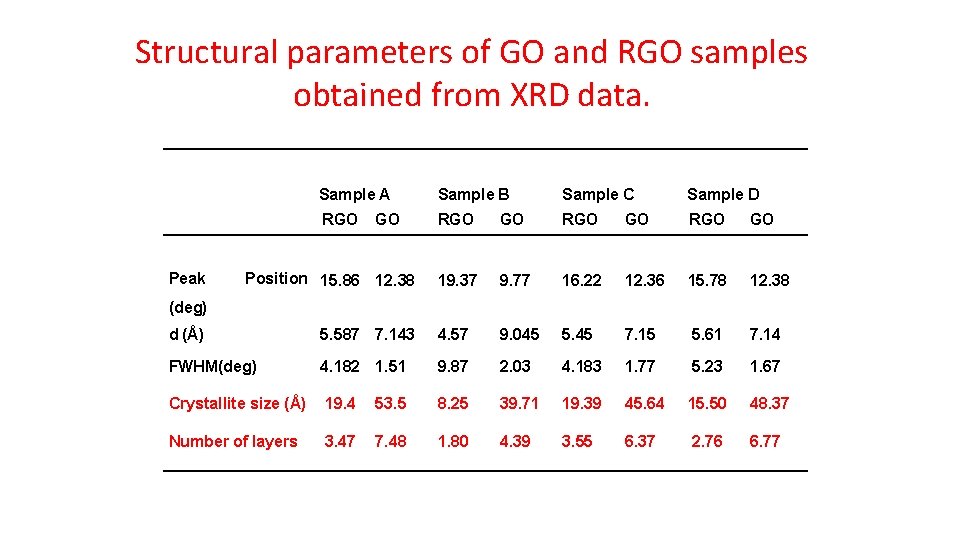
Structural parameters of GO and RGO samples obtained from XRD data. Peak Sample A Sample B Sample C Sample D RGO GO 19. 37 9. 77 16. 22 12. 36 15. 78 12. 38 GO Position 15. 86 12. 38 (deg) d (Å) 5. 587 7. 143 4. 57 9. 045 5. 45 7. 15 5. 61 7. 14 FWHM(deg) 4. 182 1. 51 9. 87 2. 03 4. 183 1. 77 5. 23 1. 67 Crystallite size (Å) 19. 4 53. 5 8. 25 39. 71 19. 39 45. 64 15. 50 48. 37 Number of layers 3. 47 7. 48 1. 80 4. 39 3. 55 6. 37 2. 76 6. 77
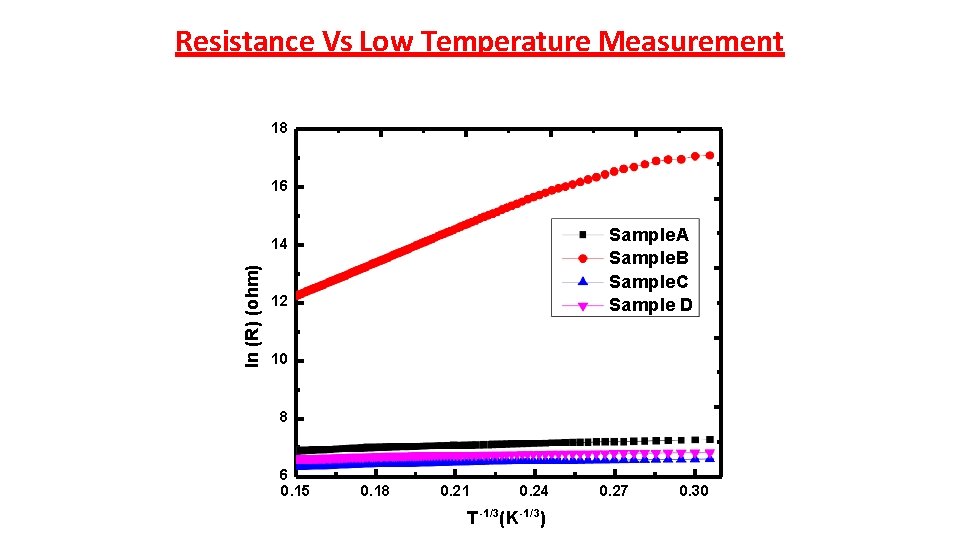
Resistance Vs Low Temperature Measurement 18 16 Sample. A Sample. B Sample. C Sample D ln (R) (ohm) 14 12 10 8 6 0. 15 0. 18 0. 21 0. 24 T -1/3(K -1/3) 0. 27 0. 30
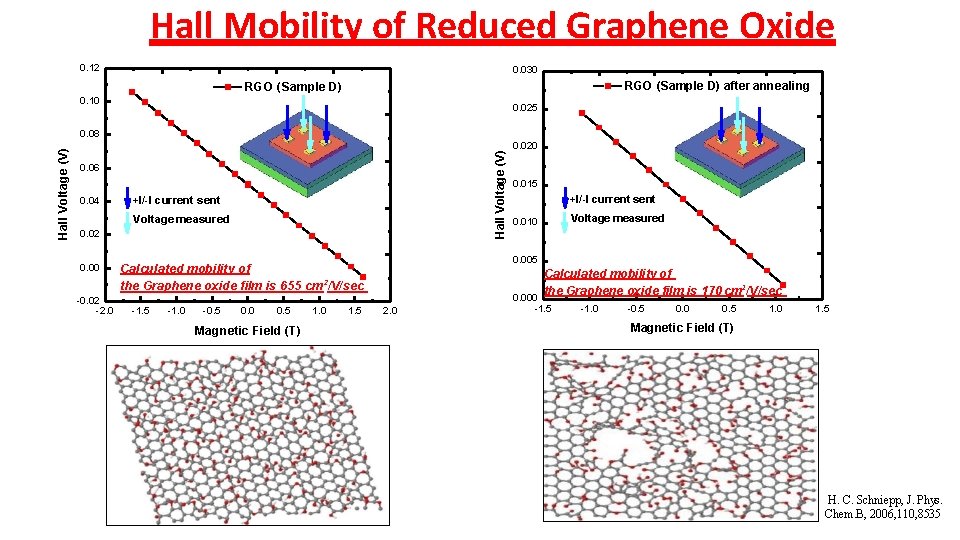
Hall Mobility of Reduced Graphene Oxide 0. 12 0. 030 RGO (Sample D) after annealing RGO (Sample D) 0. 10 0. 025 Hall Voltage (V) 0. 08 0. 06 0. 04 +I/-I current sent Voltage measured 0. 02 0. 00 -0. 02 -2. 0 -1. 0 -0. 5 0. 0 0. 5 Magnetic Field (T) 1. 0 1. 5 0. 015 +I/-I current sent Voltage measured 0. 010 0. 005 Calculated mobility of the Graphene oxide film is 655 cm 2/V/sec -1. 5 0. 020 Calculated mobility of the Graphene oxide film is 170 cm 2/V/sec 2. 0 0. 000 -1. 5 -1. 0 -0. 5 0. 0 0. 5 1. 0 1. 5 Magnetic Field (T) H. C. Schniepp, J. Phys. Chem. B, 2006, 110, 8535
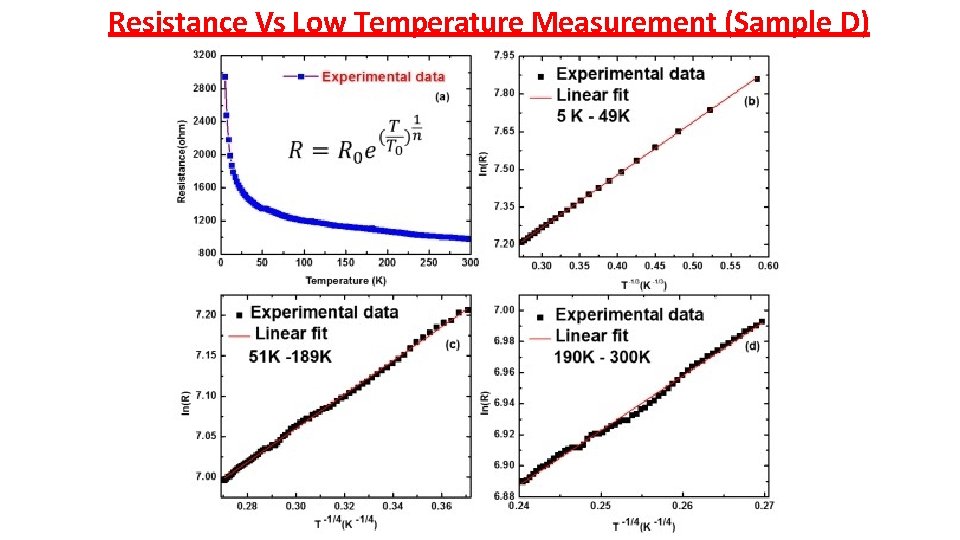
Resistance Vs Low Temperature Measurement (Sample D)
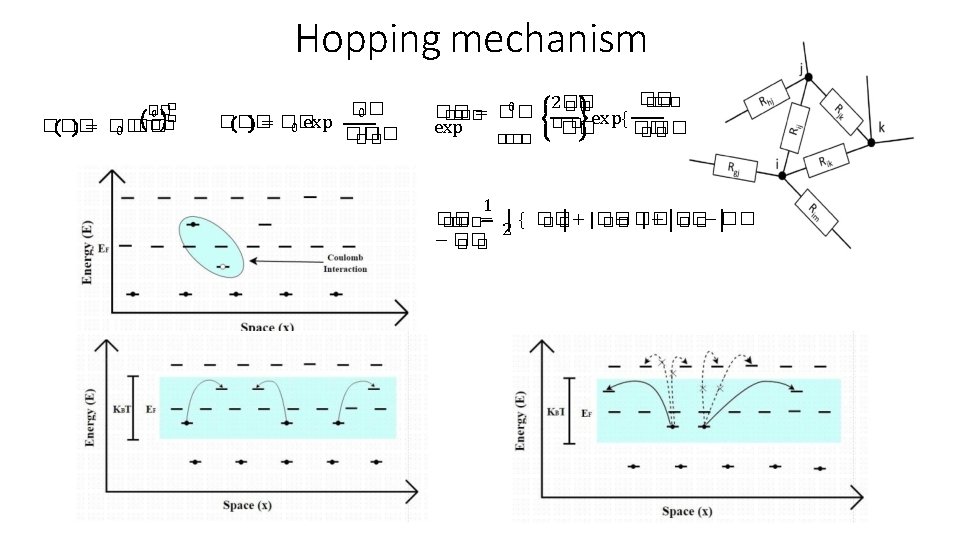
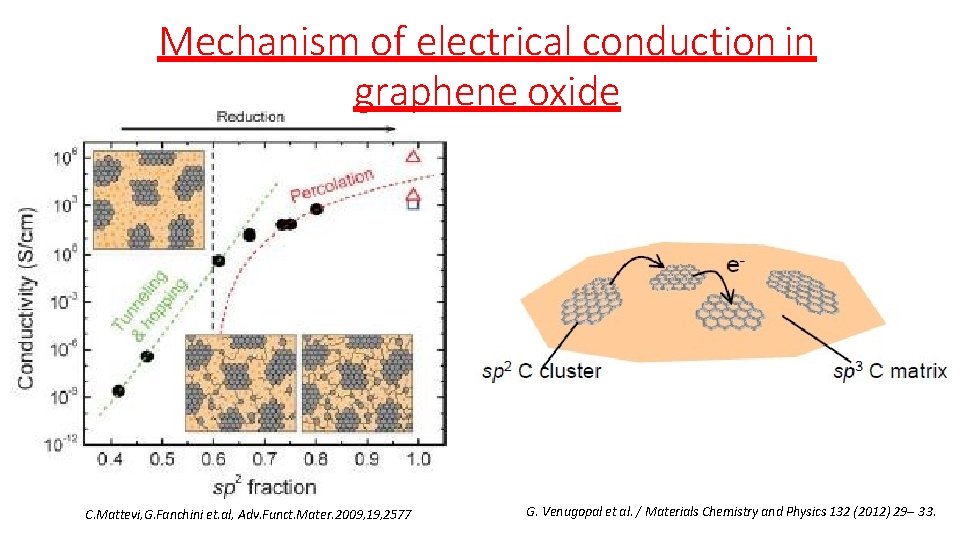
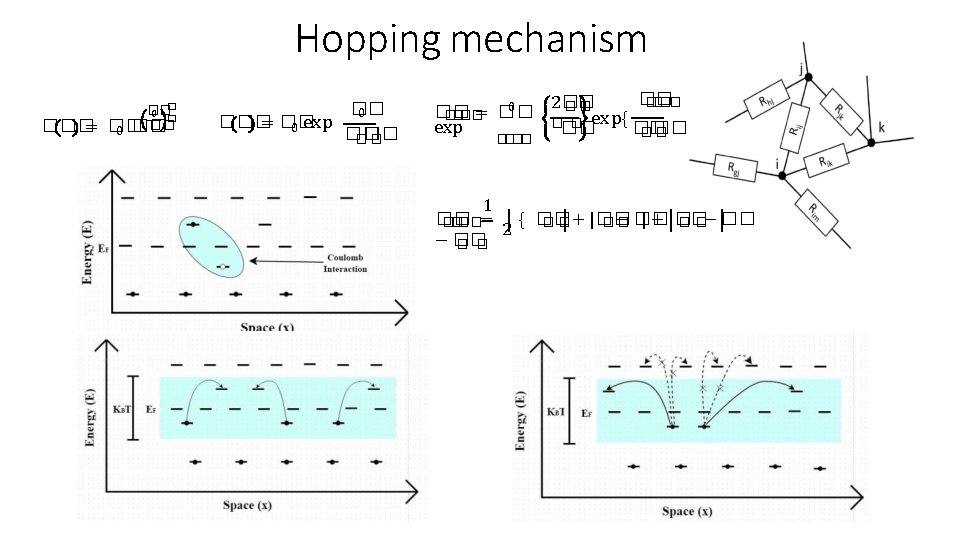
Mechanism of electrical conduction in graphene oxide C. Mattevi, G. Fanchini et. al, Adv. Funct. Mater. 2009, 19, 2577 G. Venugopal et al. / Materials Chemistry and Physics 132 (2012) 29– 33.
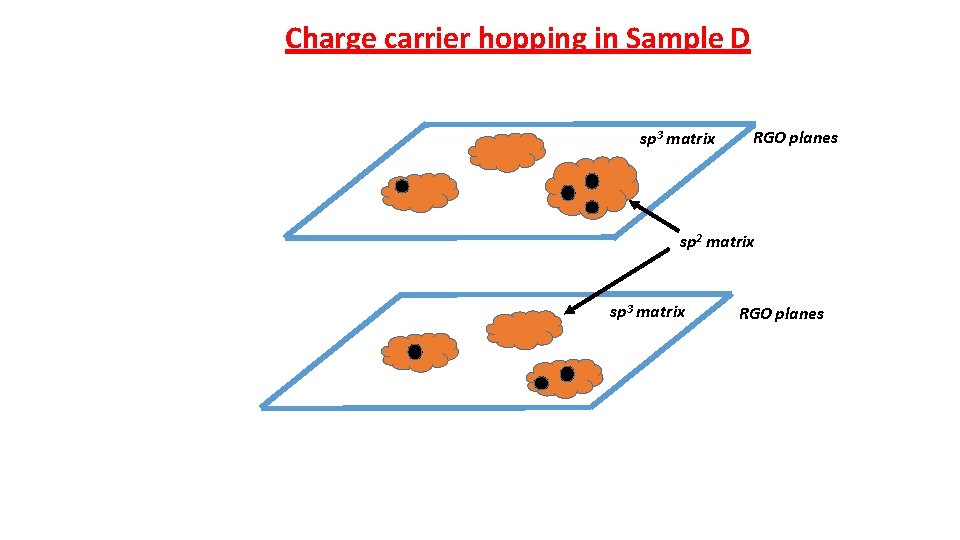
Charge carrier hopping in Sample D sp 3 matrix RGO planes sp 2 matrix sp 3 matrix RGO planes
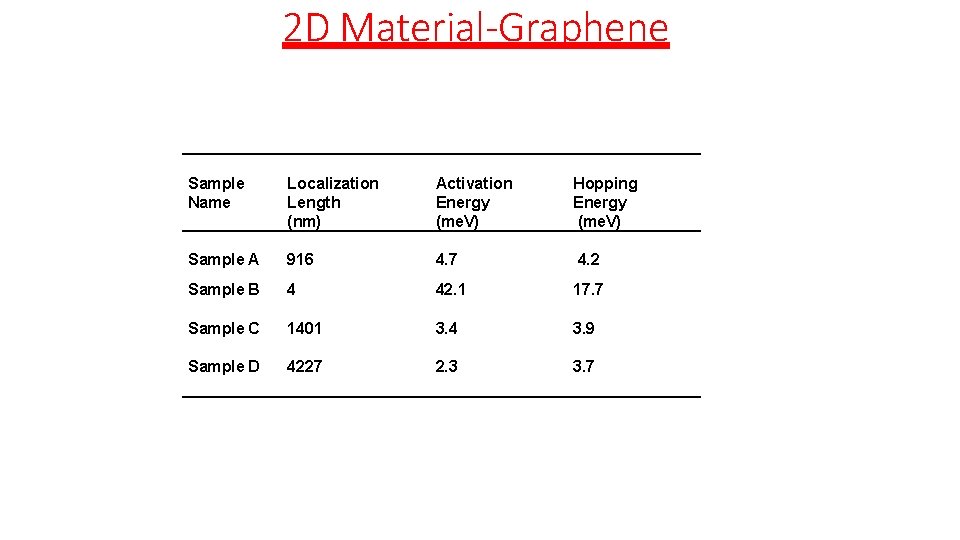
2 D Material-Graphene Sample Name Localization Length (nm) Activation Energy (me. V) Hopping Energy (me. V) Sample A 916 4. 7 4. 2 Sample B 4 42. 1 17. 7 Sample C 1401 3. 4 3. 9 Sample D 4227 2. 3 3. 7
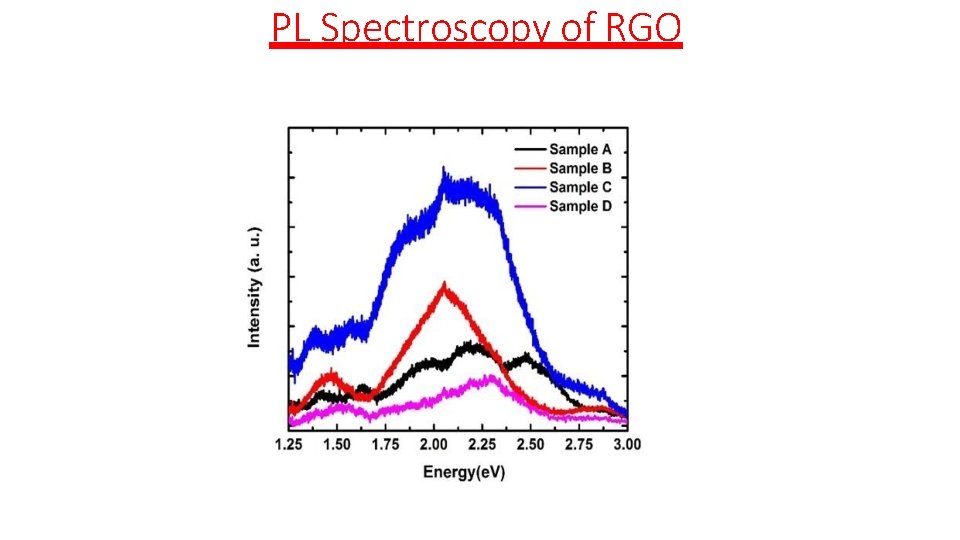
PL Spectroscopy of RGO
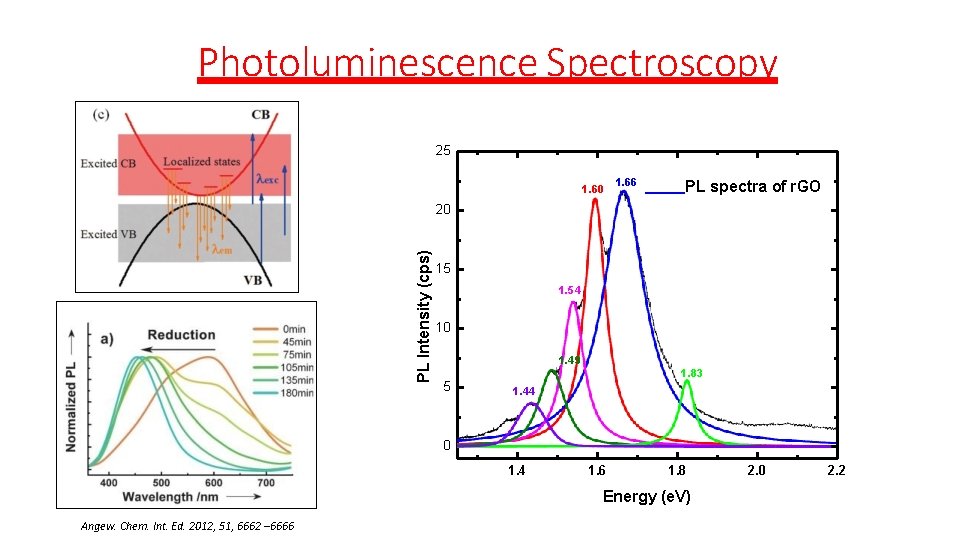
Photoluminescence Spectroscopy 25 1. 60 1. 66 PL spectra of r. GO PL Intensity (cps) 20 15 1. 54 10 1. 49 5 1. 83 1. 44 0 1. 4 1. 6 1. 8 Energy (e. V) Angew. Chem. Int. Ed. 2012, 51, 6662 – 6666 2. 0 2. 2
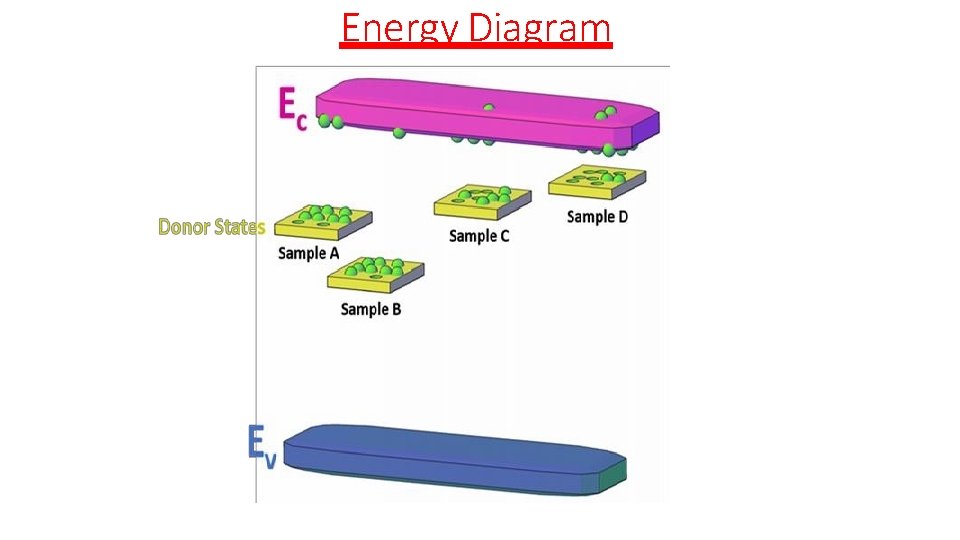
Energy Diagram
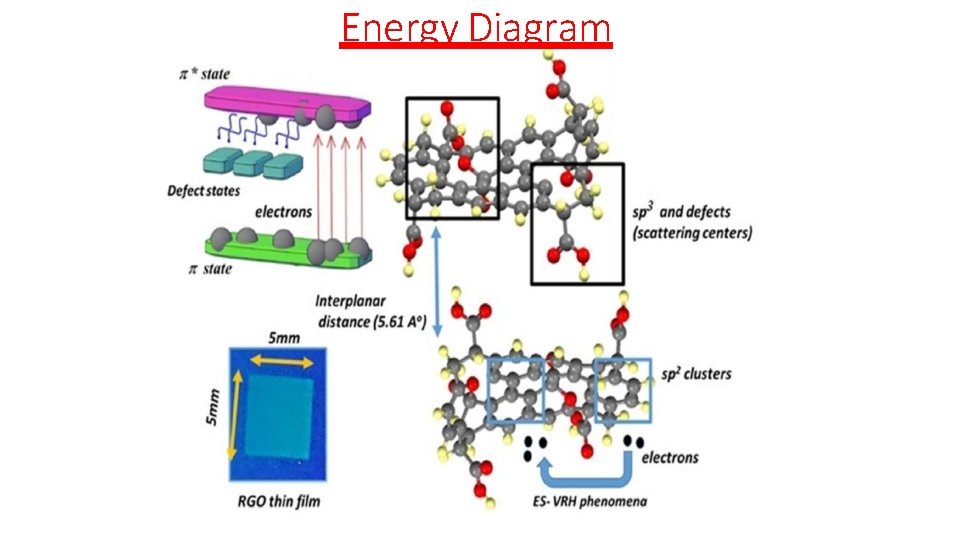
Energy Diagram
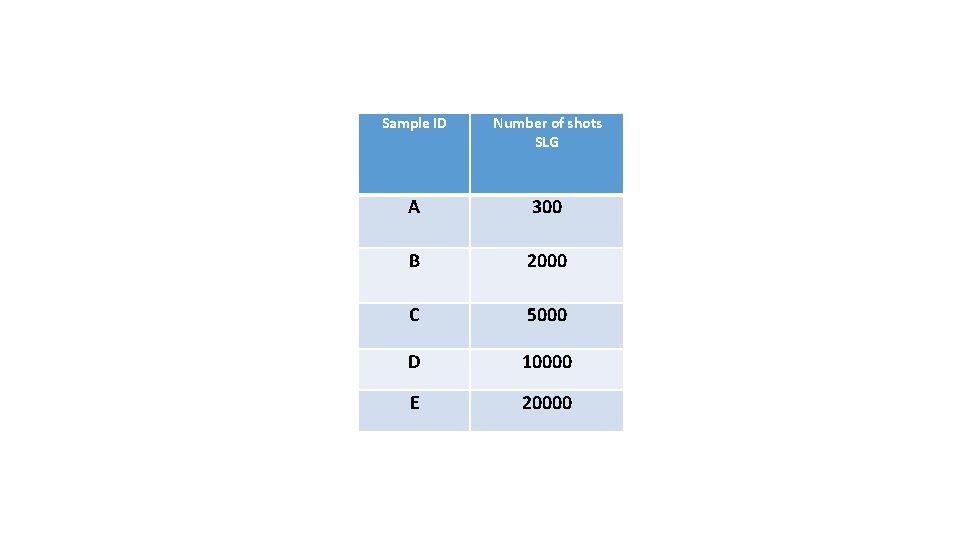
Sample ID Number of shots SLG A 300 B 2000 C 5000 D 10000 E 20000
Raman Spectroscopy �� �=�the wavelength in nm (532 nm) of the laser excitation.
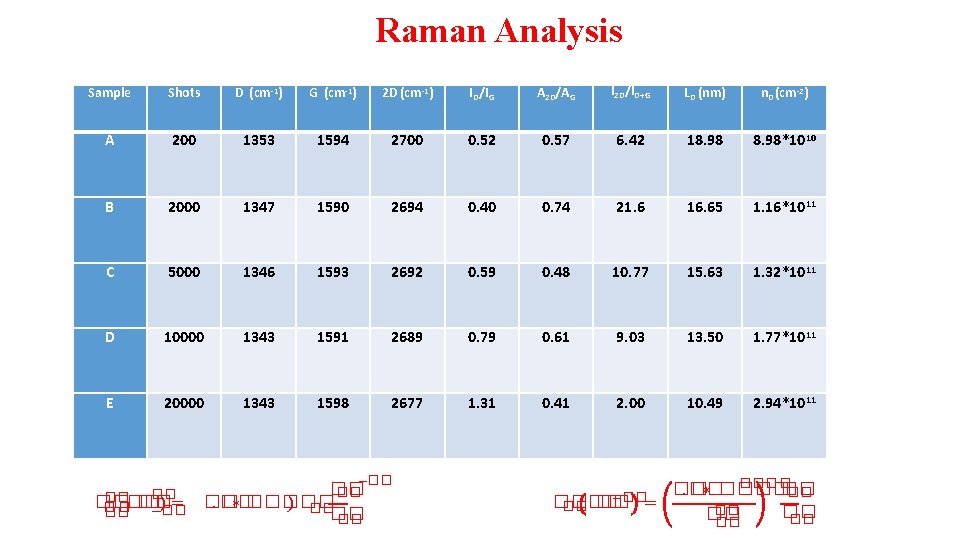
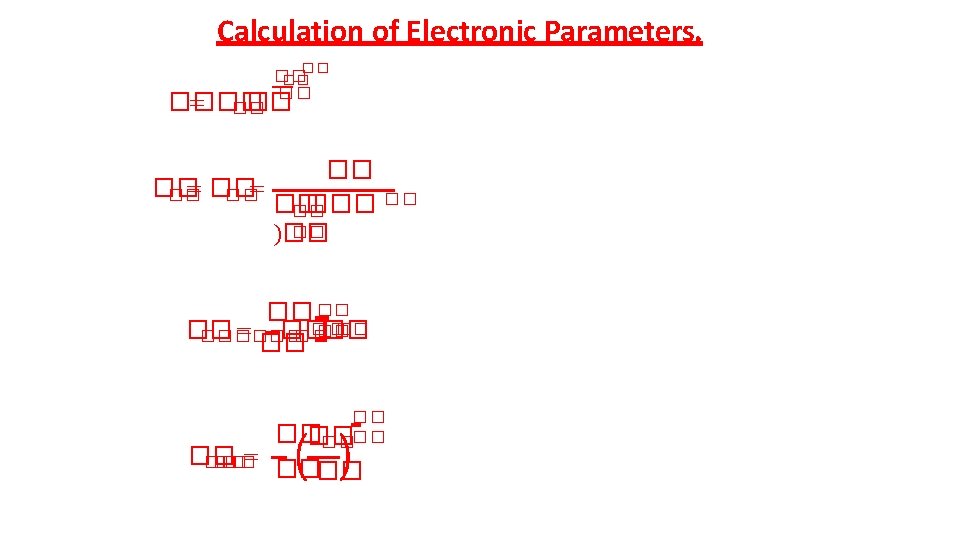
Raman Analysis Sample Shots D (cm-1) G (cm-1) 2 D (cm-1) ID/IG A 2 D/AG I 2 D/ID+G LD (nm) n. D (cm-2) A 200 1353 1594 2700 0. 52 0. 57 6. 42 18. 98*1010 B 2000 1347 1590 2694 0. 40 0. 74 21. 6 16. 65 1. 16*1011 C 5000 1346 1593 2692 0. 59 0. 48 10. 77 15. 63 1. 32*1011 D 10000 1343 1591 2689 0. 79 0. 61 9. 03 13. 50 1. 77*1011 E 20000 1343 1598 2677 1. 31 0. 41 2. 00 10. 49 2. 94*1011 −�� �� �� )= � � −�� �� ��. �� ∗ ���� ) �� �� −��= �� �� ���� ��. �� ∗ ���� ��
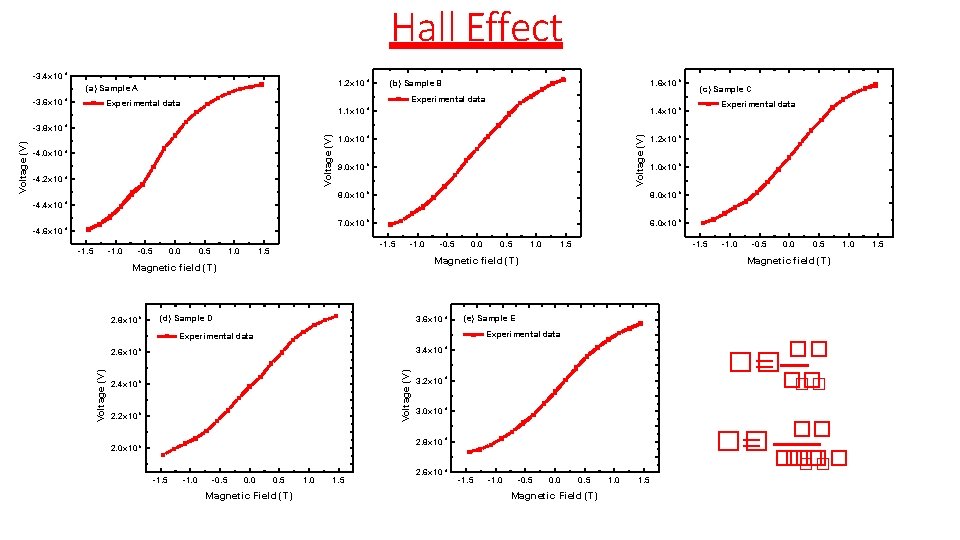
Hall Effect -3. 4 x 10 -4 1. 2 x 10 (a) Sample A -3. 6 x 10 -4 -4 1. 6 x 10 (b) Sample B -5 (c) Sample C Experimental data 1. 1 x 10 -4 1. 4 x 10 -5 1. 0 x 10 -4 1. 2 x 10 -5 Experimental data -4. 2 x 10 -4 -4. 4 x 10 -4 -4. 6 x 10 -4 -1. 5 -1. 0 -0. 5 0. 0 0. 5 1. 0 Voltage (V) -4. 0 x 10 -4 9. 0 x 10 -5 2. 8 x 10 -5 8. 0 x 10 -6 7. 0 x 10 -5 6. 0 x 10 -6 -1. 5 -1. 0 -0. 5 0. 0 (d) Sample D 3. 6 x 10 -4 Voltage (V) 2. 2 x 10 -5 -5 -1. 0 -0. 5 0. 0 1. 5 -1. 0 -0. 5 0. 0 0. 5 Magnetic Field (T) 1. 0 1. 5 3. 4 x 10 -4 3. 2 x 10 -4 3. 0 x 10 -4 2. 8 x 10 -4 2. 6 x 10 -4 0. 5 1. 0 Magnetic field (T) (e) Sample E Experimental data -5 2. 4 x 10 -5 2. 0 x 10 0. 5 Magnetic field (T) Experimental data 2. 6 x 10 1. 0 x 10 -5 8. 0 x 10 -5 Magnetic field (T) Voltage (V) -3. 8 x 10 -4 �� = �� �� -1. 5 -1. 0 -0. 5 0. 0 0. 5 Magnetic Field (T) 1. 0 1. 5
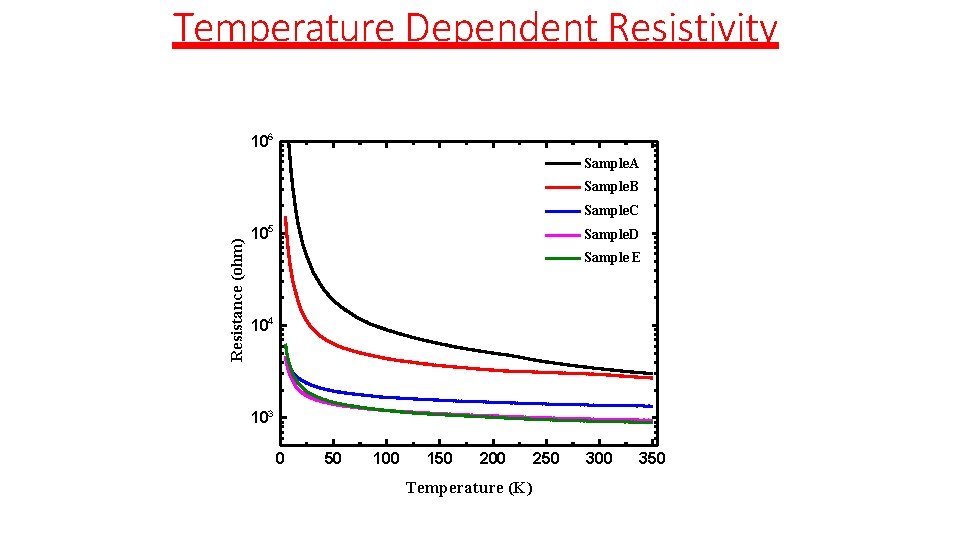
Temperature Dependent Resistivity 106 Sample. A Sample B Resistance (ohm) Sample. C 105 Sample. D Sample E 104 103 0 50 100 150 200 Temperature (K) 250 300 350
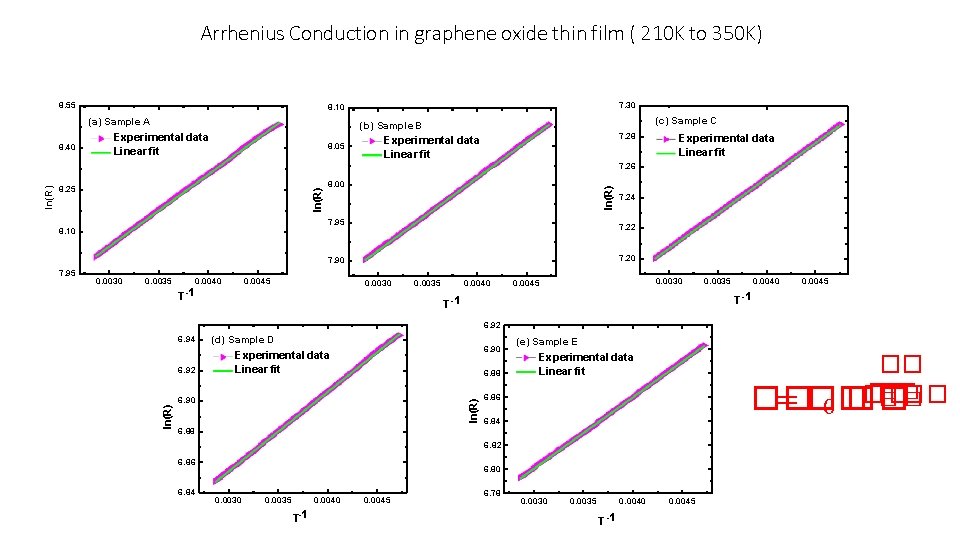
Arrhenius Conduction in graphene oxide thin film ( 210 K to 350 K) 8. 55 (a) Sample A 8. 40 7. 30 8. 10 (c) Sample C (b) Sample B Experimental data Linear fit 8. 05 7. 28 Experimental data Linear fit 8. 00 ln(R) 8. 25 7. 95 8. 10 7. 20 0. 0035 0. 0040 0. 0045 T -1 0. 0030 0. 0035 0. 0040 0. 0030 0. 0045 0. 0035 0. 0040 0. 0045 T -1 6. 92 6. 94 6. 92 (d) Sample D 6. 90 Experimental data Linear fit 6. 88 6. 90 ln(R) 7. 95 7. 24 7. 22 7. 90 ln(R) 7. 26 (e) Sample E Experimental data Linear fit �� �� � � �� = �� �� 0 6. 86 6. 84 6. 88 6. 82 6. 86 6. 84 6. 80 0. 0035 0. 0040 T-1 0. 0045 6. 78 0. 0030 0. 0035 0. 0040 T -1 0. 0045
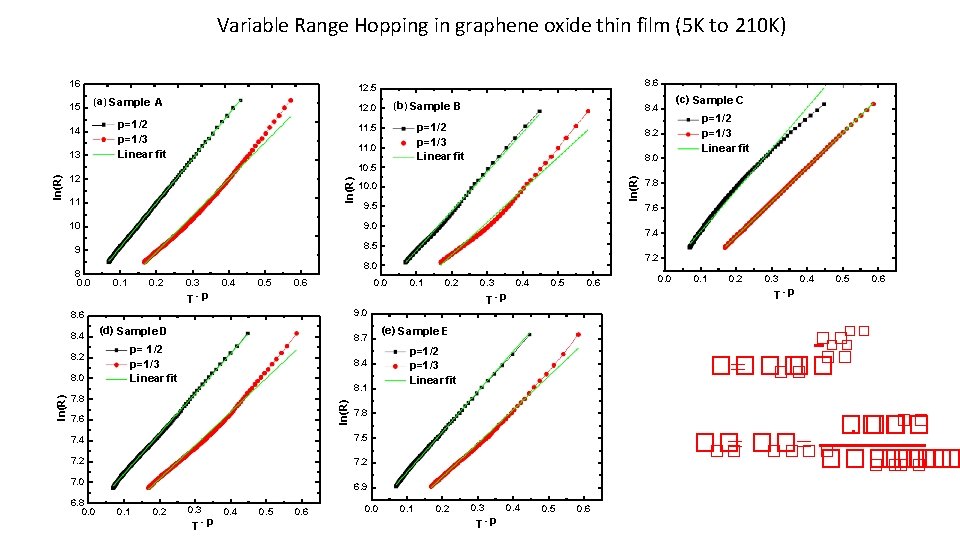
Variable Range Hopping in graphene oxide thin film (5 K to 210 K) 16 (a) Sample A 14 p=1/2 p=1/3 Linear fit 11. 0 10. 5 12 11 9 8. 5 0. 1 0. 2 0. 3 0. 4 0. 5 0. 6 7. 8 7. 2 0. 1 0. 2 0. 3 0. 4 0. 5 0. 6 0. 0 0. 1 0. 2 0. 3 0. 4 0. 5 0. 6 T -p 9. 0 (d) Sample D 8. 7 p= 1/2 p=1/3 Linear fit 8. 4 8. 1 ln(R) p=1/2 p=1/3 Linear fit 7. 4 T -p 7. 8 7. 6 7. 5 7. 2 7. 0 �� �� (e) Sample E p=1/2 p=1/3 Linear fit �� = �� �� �� 7. 8 7. 4 6. 8 0. 0 (c) Sample C 7. 6 0. 0 8. 6 8. 0 T -p 8. 2 9. 5 9. 0 8. 4 10. 0 10 8 0. 0 B p=1/2 p=1/3 Linear fit 11. 5 ln(R) 13 (b) Sample 12. 0 ln(R) 15 8. 6 12. 5 �� �� �� = �� ������ �� �� 6. 9 0. 1 0. 2 0. 3 T -p 0. 4 0. 5 0. 6 0. 0 0. 1 0. 2 0. 3 T -p 0. 4 0. 5 0. 6
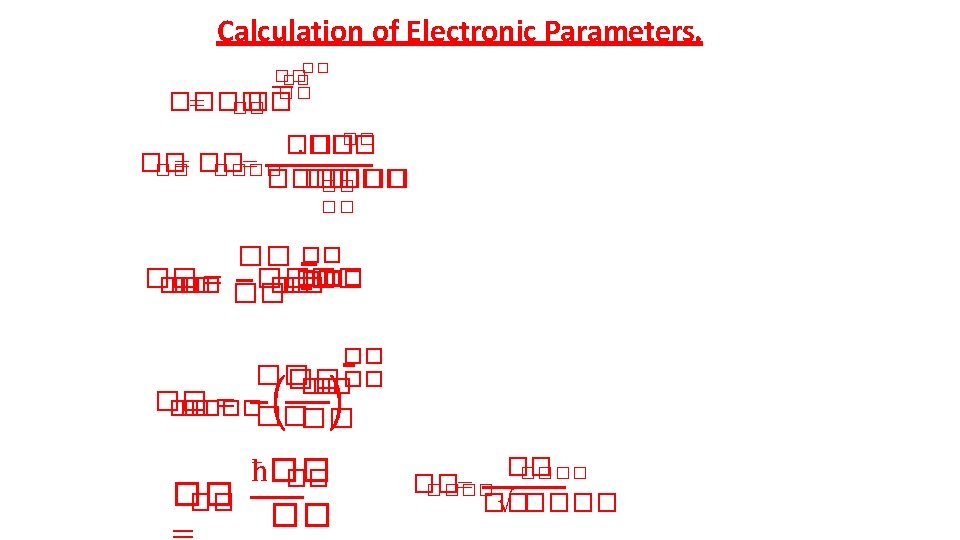
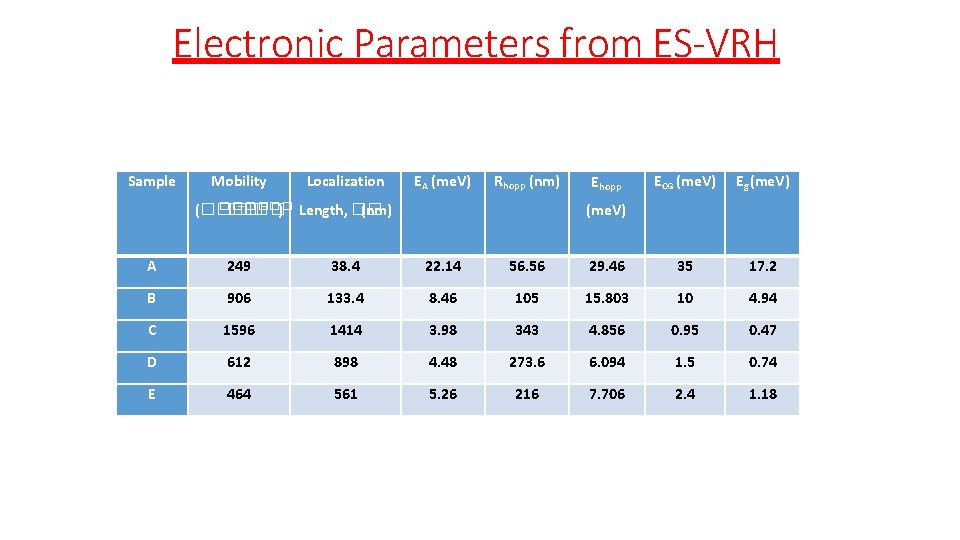
Electronic Parameters from ES-VRH Sample Mobility Localization EA (me. V) Rhopp (nm) ��� � −�� (nm) (���� �� ) Length, �� Ehopp ECG (me. V) Eg (me. V) A 249 38. 4 22. 14 56. 56 29. 46 35 17. 2 B 906 133. 4 8. 46 105 15. 803 10 4. 94 C 1596 1414 3. 98 343 4. 856 0. 95 0. 47 D 612 898 4. 48 273. 6 6. 094 1. 5 0. 74 E 464 561 5. 26 216 7. 706 2. 4 1. 18
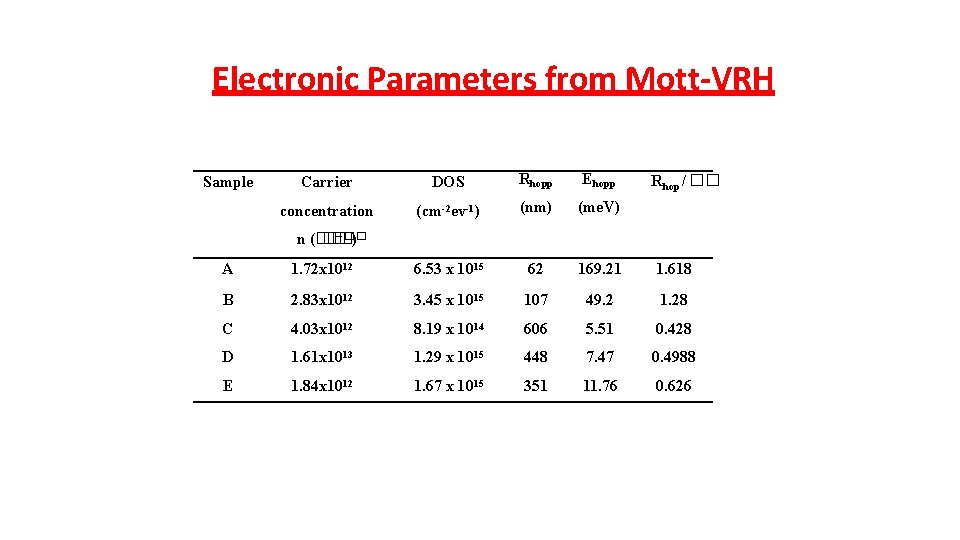
Electronic Parameters from Mott-VRH Sample Carrier DOS Rhopp Ehopp concentration (cm-2 ev-1) (nm) (me. V) Rhop / �� −�� n (�� �� ) A 1. 72 x 1012 6. 53 x 1015 62 169. 21 1. 618 B 2. 83 x 1012 3. 45 x 1015 107 49. 2 1. 28 C 4. 03 x 1012 8. 19 x 1014 606 5. 51 0. 428 D 1. 61 x 1013 1. 29 x 1015 448 7. 47 0. 4988 E 1. 84 x 1012 1. 67 x 1015 351 11. 76 0. 626
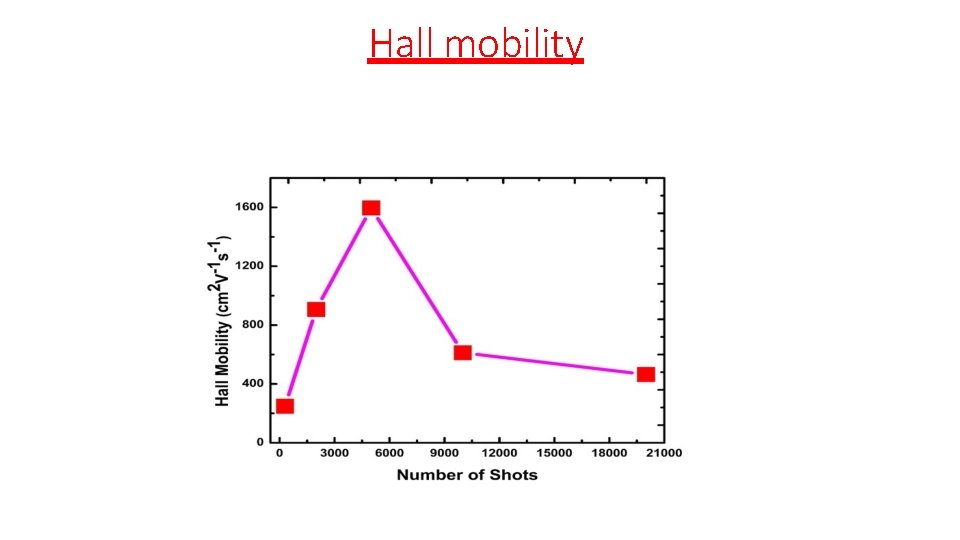
Hall mobility
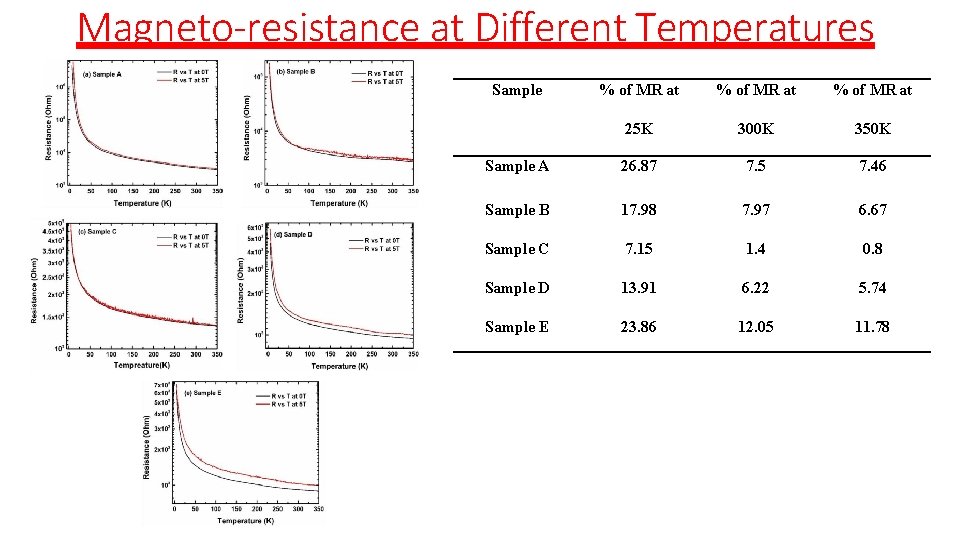
Magneto-resistance at Different Temperatures Sample % of MR at 25 K 300 K 350 K Sample A 26. 87 7. 5 7. 46 Sample B 17. 98 7. 97 6. 67 Sample C 7. 15 1. 4 0. 8 Sample D 13. 91 6. 22 5. 74 Sample E 23. 86 12. 05 11. 78
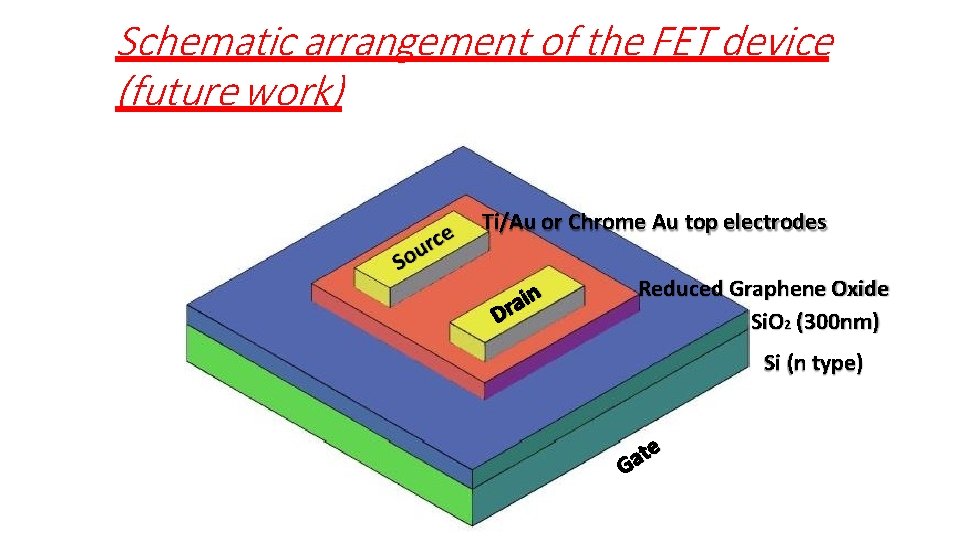
Schematic arrangement of the FET device (future work) Ti/Au or Chrome Au top electrodes Reduced Graphene Oxide Si. O 2 (300 nm) Si (n type)
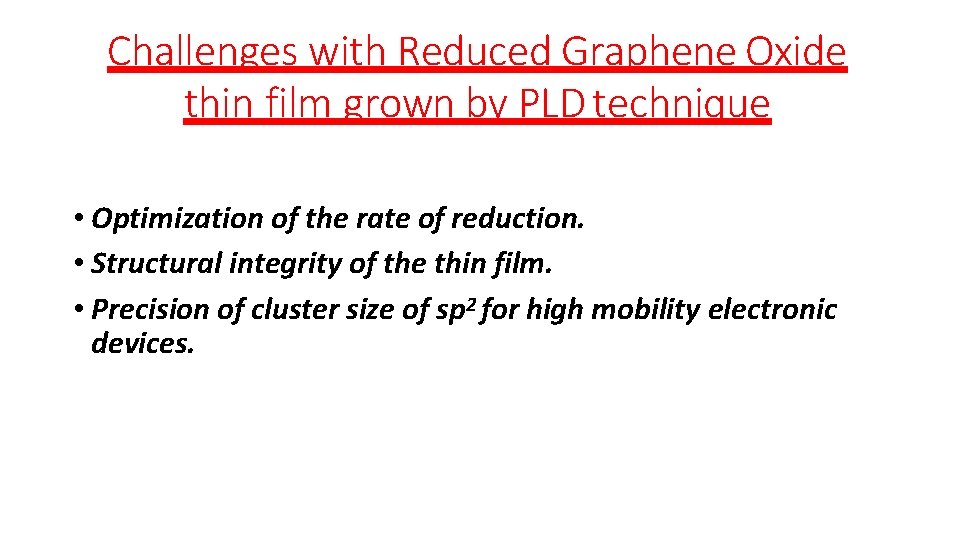
Challenges with Reduced Graphene Oxide thin film grown by PLD technique • Optimization of the rate of reduction. • Structural integrity of the thin film. • Precision of cluster size of sp 2 for high mobility electronic devices.
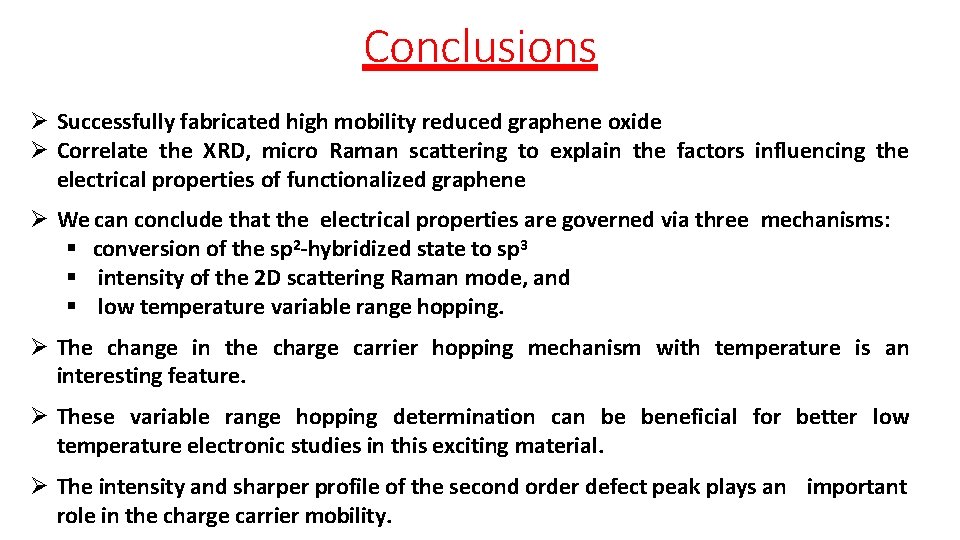
Conclusions Successfully fabricated high mobility reduced graphene oxide Correlate the XRD, micro Raman scattering to explain the factors influencing the electrical properties of functionalized graphene We can conclude that the electrical properties are governed via three mechanisms: conversion of the sp 2 -hybridized state to sp 3 intensity of the 2 D scattering Raman mode, and low temperature variable range hopping. The change in the charge carrier hopping mechanism with temperature is an interesting feature. These variable range hopping determination can be beneficial for better low temperature electronic studies in this exciting material. The intensity and sharper profile of the second order defect peak plays an important role in the charge carrier mobility.
Acknowledgement • • • Thank you Dr. Kartik Ghosh Dr. Dave Cornelison Anagh Bhaumik Garrett Beaver Ariful Haque Dan Jones Priyanka Karnati Austin Shearin Md. Taufique R. Rahaman R. Patel
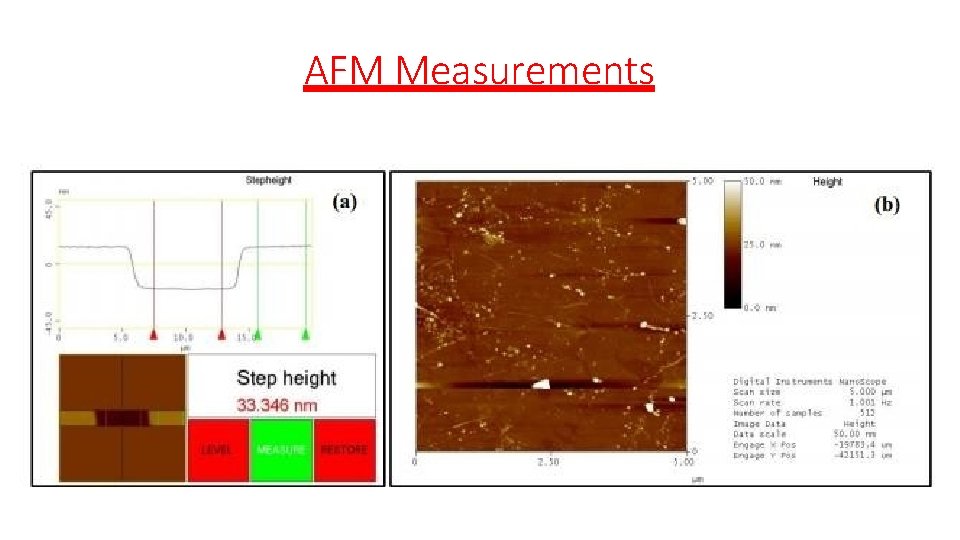
AFM Measurements
Raman vibrational modes in r. GO thin film
XRD of Reduced Graphene Oxide