
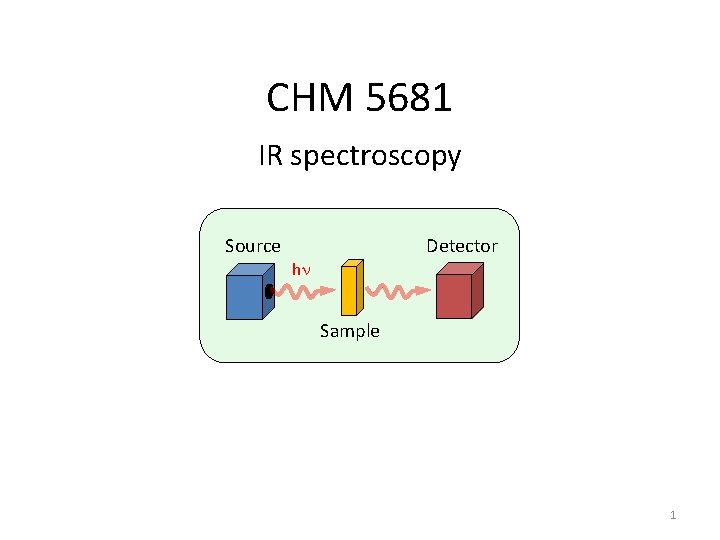
CHM 5681 IR spectroscopy Detector Source hn Sample

- Slides: 106
CHM 5681 IR spectroscopy Detector Source hn Sample 1
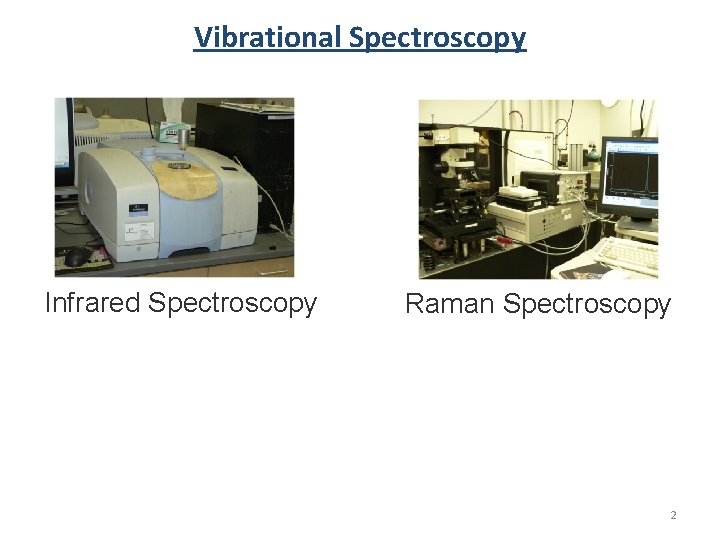
Vibrational Spectroscopy Infrared Spectroscopy Raman Spectroscopy 2
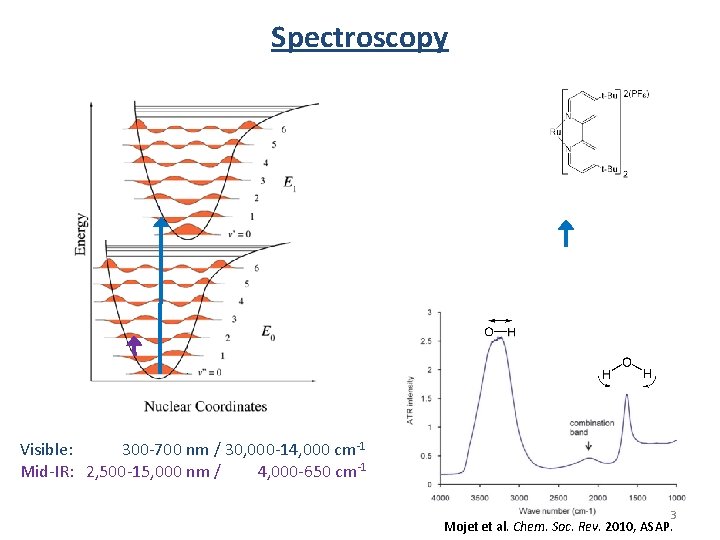
Spectroscopy Visible: 300 -700 nm / 30, 000 -14, 000 cm-1 Mid-IR: 2, 500 -15, 000 nm / 4, 000 -650 cm-1 3 Mojet et al. Chem. Soc. Rev. 2010, ASAP.
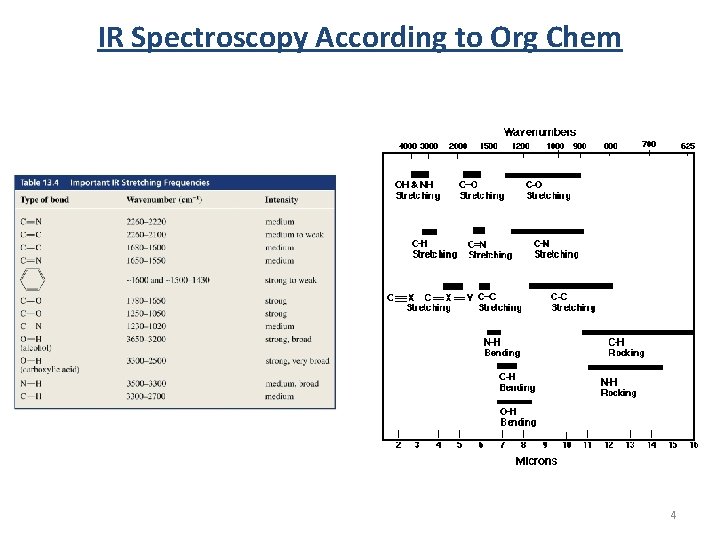
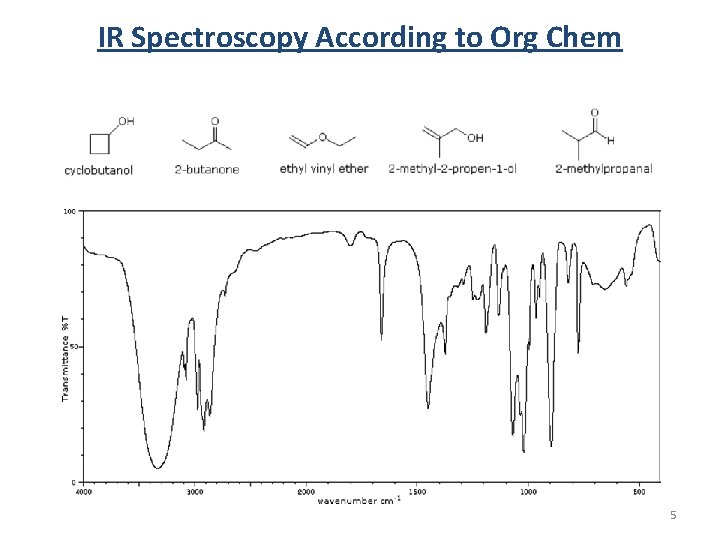
IR Spectroscopy According to Org Chem 4
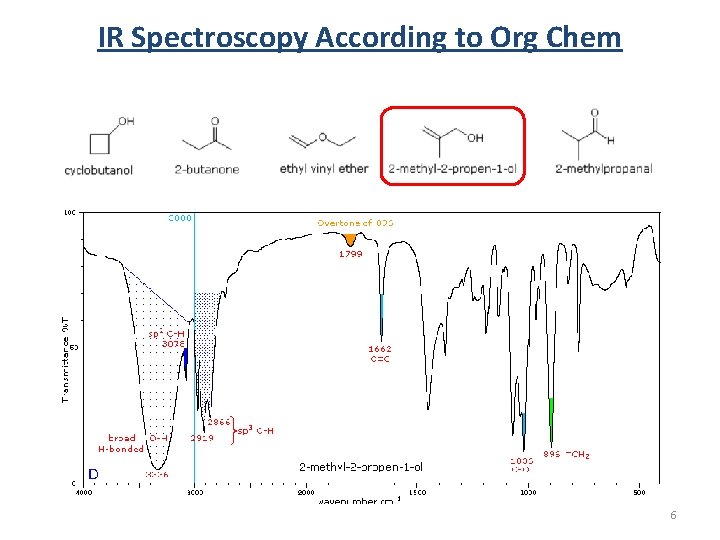
IR Spectroscopy According to Org Chem 5
IR Spectroscopy According to Org Chem 6
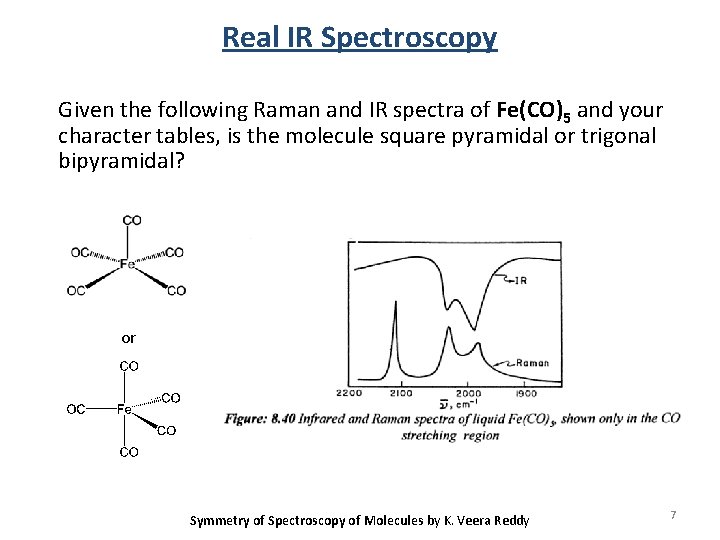
Real IR Spectroscopy Given the following Raman and IR spectra of Fe(CO)5 and your character tables, is the molecule square pyramidal or trigonal bipyramidal? or Symmetry of Spectroscopy of Molecules by K. Veera Reddy 7
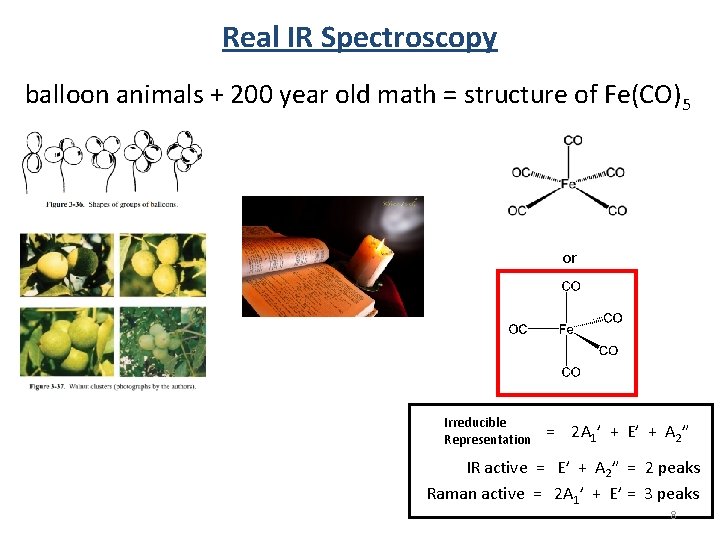
Real IR Spectroscopy balloon animals + 200 year old math = structure of Fe(CO)5 or Irreducible Representation = 2 A 1’ + E’ + A 2” IR active = E’ + A 2” = 2 peaks Raman active = 2 A 1’ + E’ = 3 peaks 8
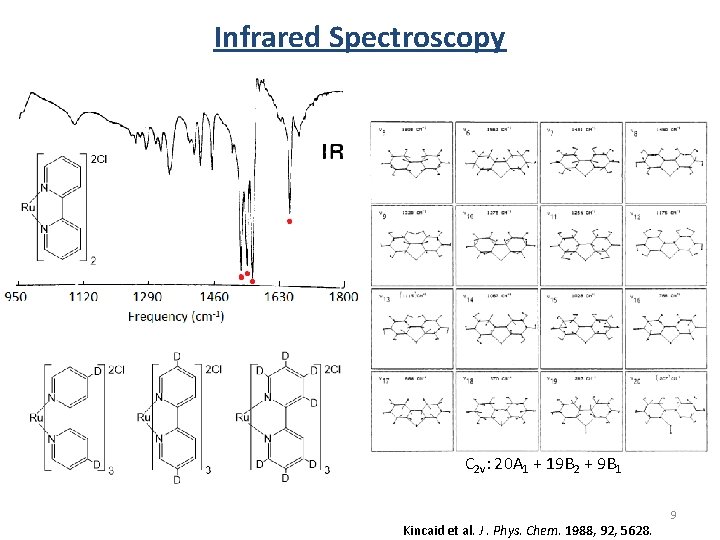
Infrared Spectroscopy C 2 v: 20 A 1 + 19 B 2 + 9 B 1 Kincaid et al. J. Phys. Chem. 1988, 92, 5628. 9
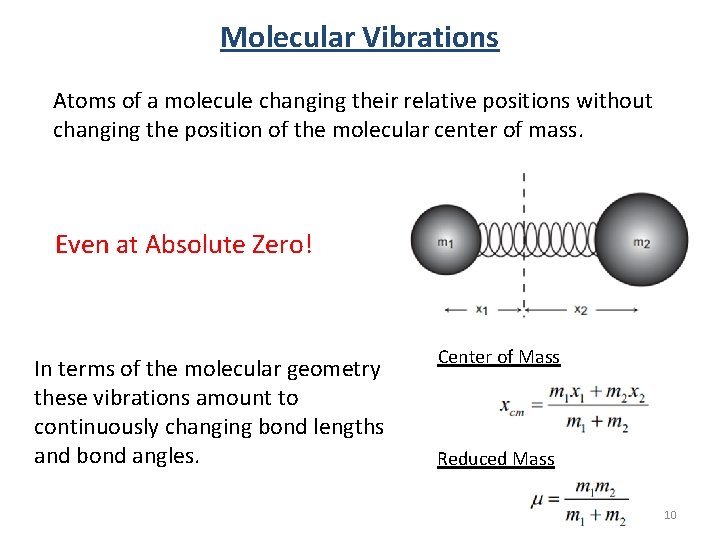
Molecular Vibrations Atoms of a molecule changing their relative positions without changing the position of the molecular center of mass. Even at Absolute Zero! In terms of the molecular geometry these vibrations amount to continuously changing bond lengths and bond angles. Center of Mass Reduced Mass 10
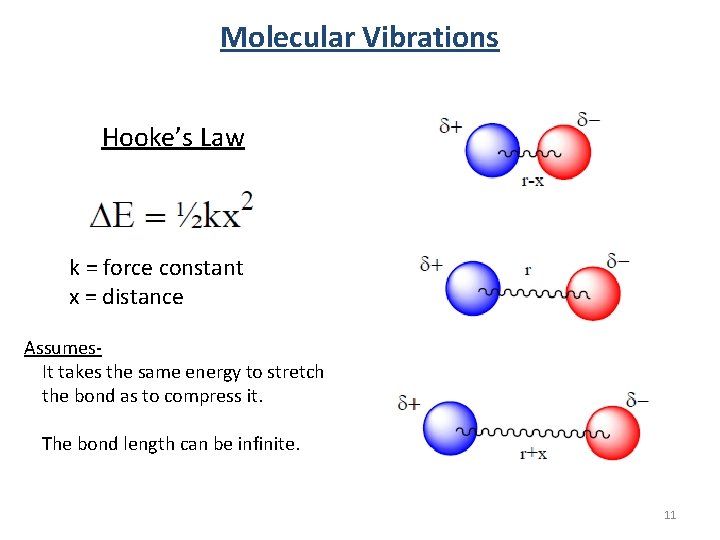
Molecular Vibrations Hooke’s Law k = force constant x = distance Assumes. It takes the same energy to stretch the bond as to compress it. The bond length can be infinite. 11
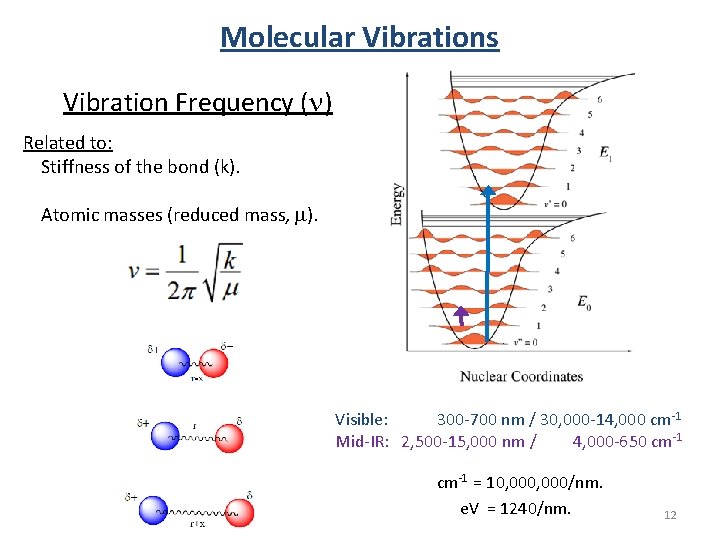
Molecular Vibrations Vibration Frequency (n) Related to: Stiffness of the bond (k). Atomic masses (reduced mass, m). Visible: 300 -700 nm / 30, 000 -14, 000 cm-1 Mid-IR: 2, 500 -15, 000 nm / 4, 000 -650 cm-1 = 10, 000/nm. e. V = 1240/nm. 12
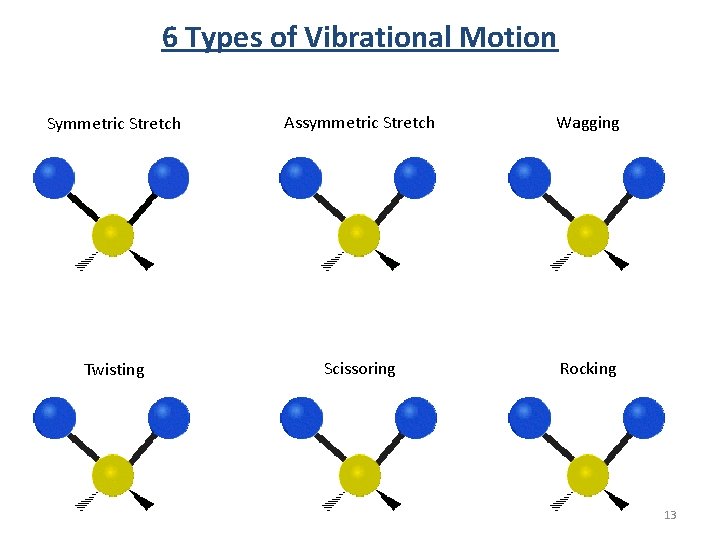
6 Types of Vibrational Motion Symmetric Stretch Assymmetric Stretch Wagging Twisting Scissoring Rocking 13
The following is a preview for group theory. 14
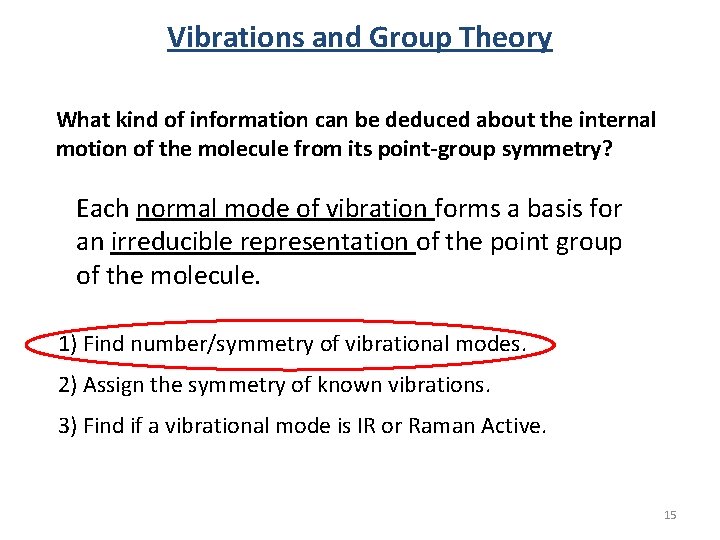
Vibrations and Group Theory What kind of information can be deduced about the internal motion of the molecule from its point-group symmetry? Each normal mode of vibration forms a basis for an irreducible representation of the point group of the molecule. 1) Find number/symmetry of vibrational modes. 2) Assign the symmetry of known vibrations. 3) Find if a vibrational mode is IR or Raman Active. 15
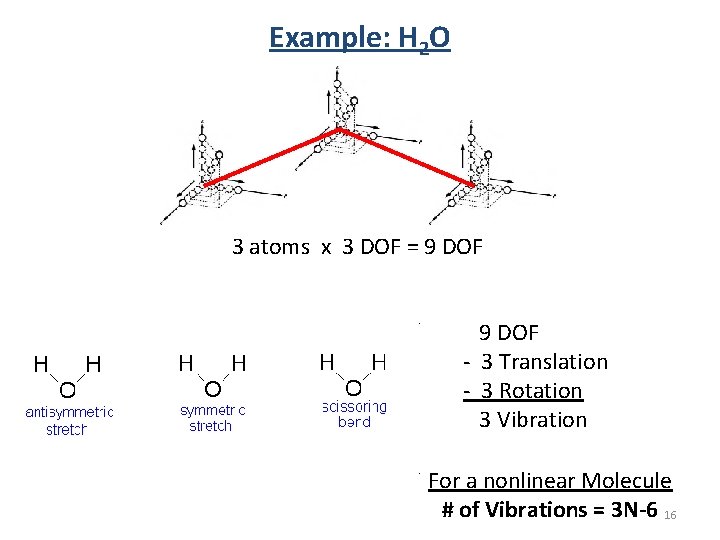
Example: H 2 O 3 atoms x 3 DOF = 9 DOF - 3 Translation - 3 Rotation 3 Vibration For a nonlinear Molecule # of Vibrations = 3 N-6 16
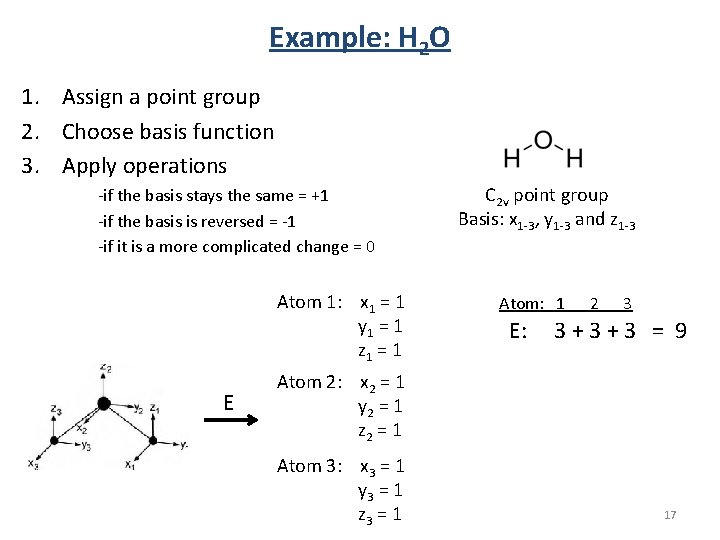
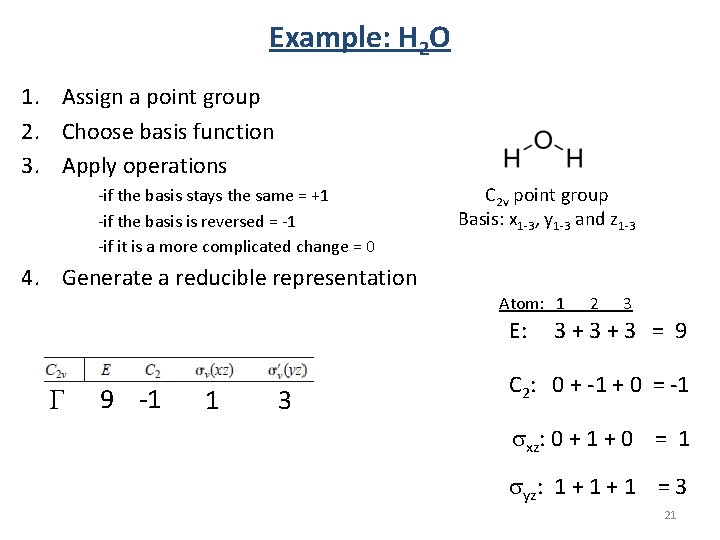
Example: H 2 O 1. Assign a point group 2. Choose basis function 3. Apply operations -if the basis stays the same = +1 -if the basis is reversed = -1 -if it is a more complicated change = 0 Atom 1: x 1 = 1 y 1 = 1 z 1 = 1 E C 2 v point group Basis: x 1 -3, y 1 -3 and z 1 -3 Atom: 1 E: 2 3 3+3+3 = 9 Atom 2: x 2 = 1 y 2 = 1 z 2 = 1 Atom 3: x 3 = 1 y 3 = 1 z 3 = 1 17
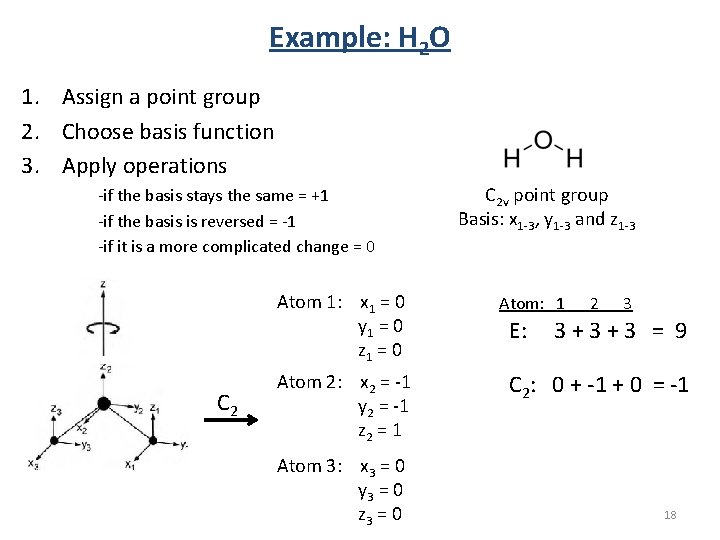
Example: H 2 O 1. Assign a point group 2. Choose basis function 3. Apply operations -if the basis stays the same = +1 -if the basis is reversed = -1 -if it is a more complicated change = 0 Atom 1: x 1 = 0 y 1 = 0 z 1 = 0 C 2 Atom 2: x 2 = -1 y 2 = -1 z 2 = 1 Atom 3: x 3 = 0 y 3 = 0 z 3 = 0 C 2 v point group Basis: x 1 -3, y 1 -3 and z 1 -3 Atom: 1 E: 2 3 3+3+3 = 9 C 2: 0 + -1 + 0 = -1 18
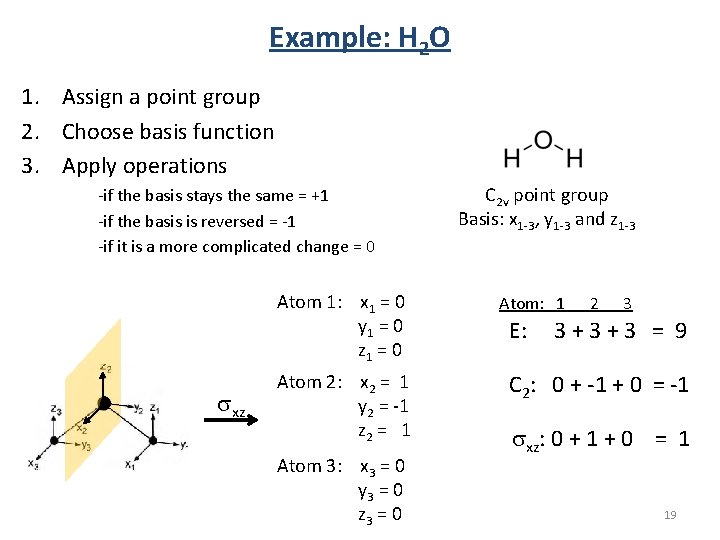
Example: H 2 O 1. Assign a point group 2. Choose basis function 3. Apply operations -if the basis stays the same = +1 -if the basis is reversed = -1 -if it is a more complicated change = 0 Atom 1: x 1 = 0 y 1 = 0 z 1 = 0 sxz Atom 2: x 2 = 1 y 2 = -1 z 2 = 1 Atom 3: x 3 = 0 y 3 = 0 z 3 = 0 C 2 v point group Basis: x 1 -3, y 1 -3 and z 1 -3 Atom: 1 E: 2 3 3+3+3 = 9 C 2: 0 + -1 + 0 = -1 sxz: 0 + 1 + 0 = 1 19
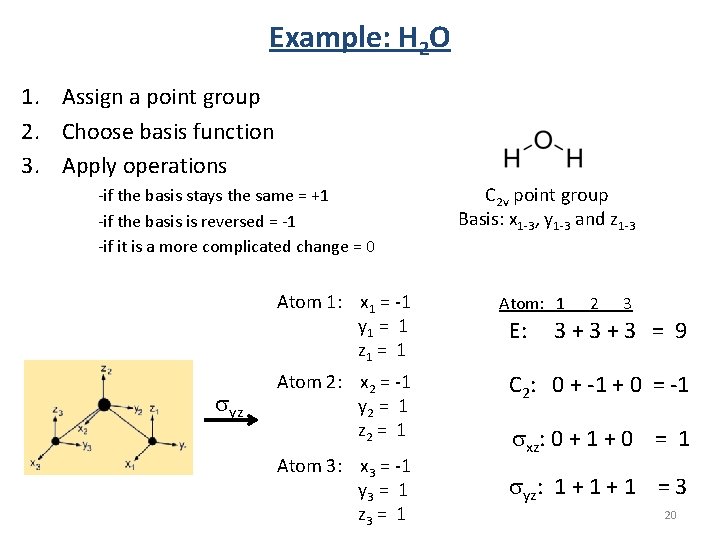
Example: H 2 O 1. Assign a point group 2. Choose basis function 3. Apply operations -if the basis stays the same = +1 -if the basis is reversed = -1 -if it is a more complicated change = 0 Atom 1: x 1 = -1 y 1 = 1 z 1 = 1 syz Atom 2: x 2 = -1 y 2 = 1 z 2 = 1 Atom 3: x 3 = -1 y 3 = 1 z 3 = 1 C 2 v point group Basis: x 1 -3, y 1 -3 and z 1 -3 Atom: 1 E: 2 3 3+3+3 = 9 C 2: 0 + -1 + 0 = -1 sxz: 0 + 1 + 0 = 1 syz: 1 + 1 = 3 20
Example: H 2 O 1. Assign a point group 2. Choose basis function 3. Apply operations -if the basis stays the same = +1 -if the basis is reversed = -1 -if it is a more complicated change = 0 C 2 v point group Basis: x 1 -3, y 1 -3 and z 1 -3 4. Generate a reducible representation Atom: 1 E: G 9 -1 1 3 2 3 3+3+3 = 9 C 2: 0 + -1 + 0 = -1 sxz: 0 + 1 + 0 = 1 syz: 1 + 1 = 3 21
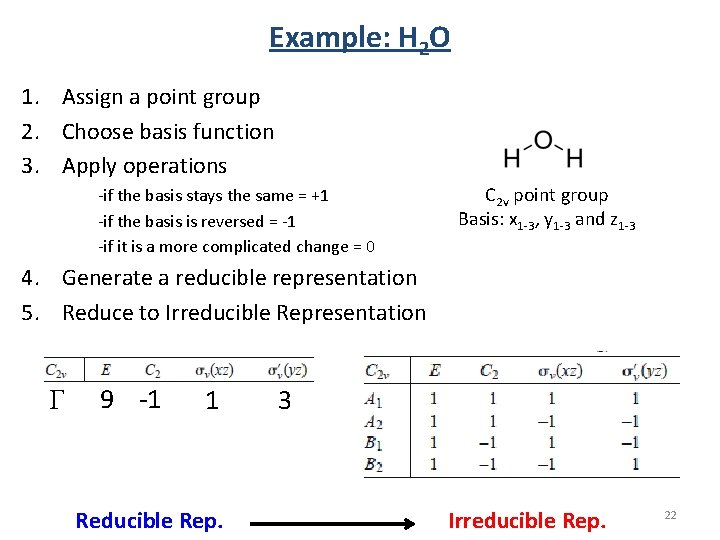
Example: H 2 O 1. Assign a point group 2. Choose basis function 3. Apply operations -if the basis stays the same = +1 -if the basis is reversed = -1 -if it is a more complicated change = 0 C 2 v point group Basis: x 1 -3, y 1 -3 and z 1 -3 4. Generate a reducible representation 5. Reduce to Irreducible Representation G 9 -1 1 Reducible Rep. 3 Irreducible Rep. 22
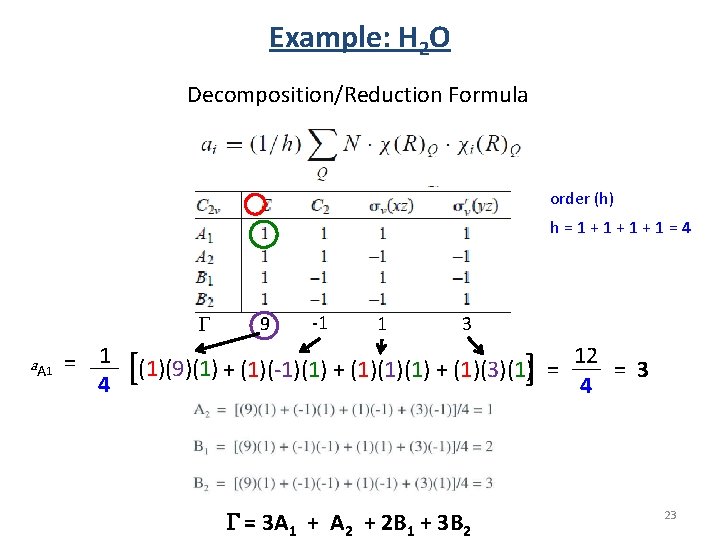
Example: H 2 O Decomposition/Reduction Formula order (h) h=1+1+1+1=4 G a A 1 = 1 4 9 -1 1 3 [ ] (1)(9)(1) + (1)(-1)(1) + (1)(3)(1) = G = 3 A 1 + A 2 + 2 B 1 + 3 B 2 12 = 3 4 23
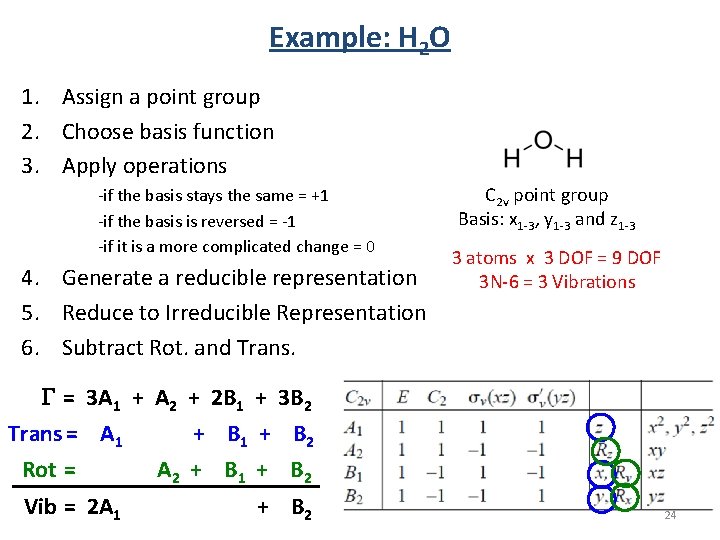
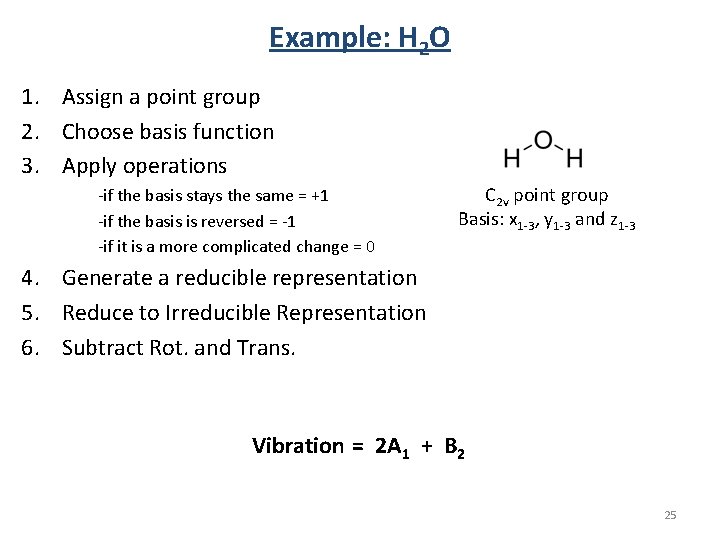
Example: H 2 O 1. Assign a point group 2. Choose basis function 3. Apply operations -if the basis stays the same = +1 -if the basis is reversed = -1 -if it is a more complicated change = 0 4. Generate a reducible representation 5. Reduce to Irreducible Representation 6. Subtract Rot. and Trans. C 2 v point group Basis: x 1 -3, y 1 -3 and z 1 -3 3 atoms x 3 DOF = 9 DOF 3 N-6 = 3 Vibrations G = 3 A 1 + A 2 + 2 B 1 + 3 B 2 Trans = A 1 + B 2 Rot = A 2 + B 1 + B 2 Vib = 2 A 1 + B 2 24
Example: H 2 O 1. Assign a point group 2. Choose basis function 3. Apply operations -if the basis stays the same = +1 -if the basis is reversed = -1 -if it is a more complicated change = 0 C 2 v point group Basis: x 1 -3, y 1 -3 and z 1 -3 4. Generate a reducible representation 5. Reduce to Irreducible Representation 6. Subtract Rot. and Trans. Vibration = 2 A 1 + B 2 25
Vibrations and Group Theory 1) Find number/symmetry of vibrational modes. 2) Assign the symmetry of known vibrations. 3) Find if a vibrational mode is IR or Raman Active. 26
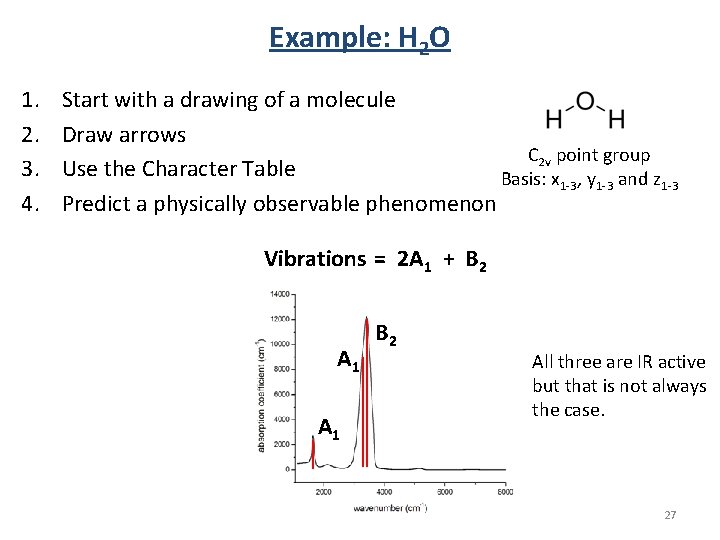
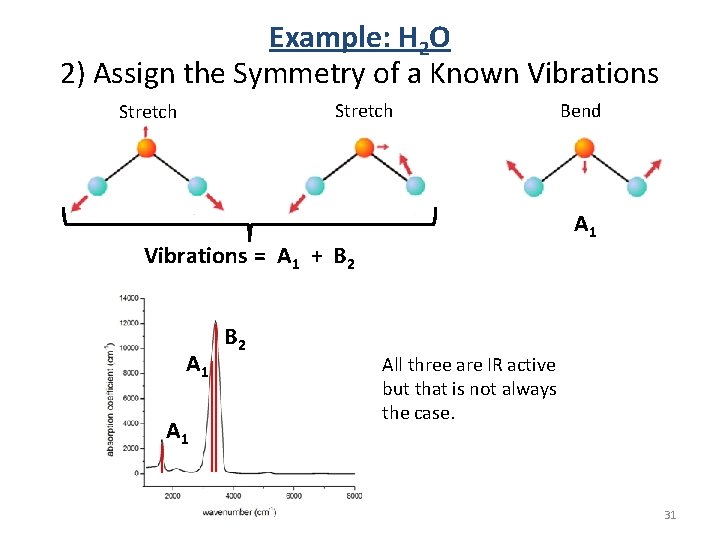
Example: H 2 O 1. 2. 3. 4. Start with a drawing of a molecule Draw arrows C 2 v point group Use the Character Table Basis: x 1 -3, y 1 -3 and z 1 -3 Predict a physically observable phenomenon Vibrations = 2 A 1 + B 2 A 1 B 2 All three are IR active but that is not always the case. 27
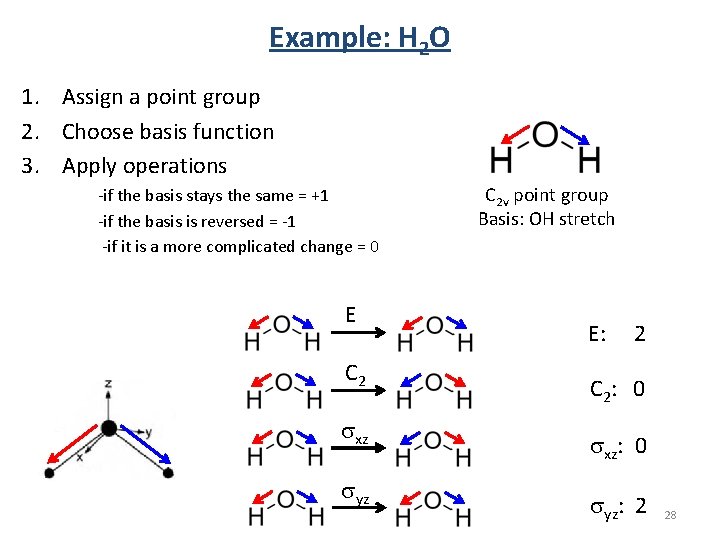
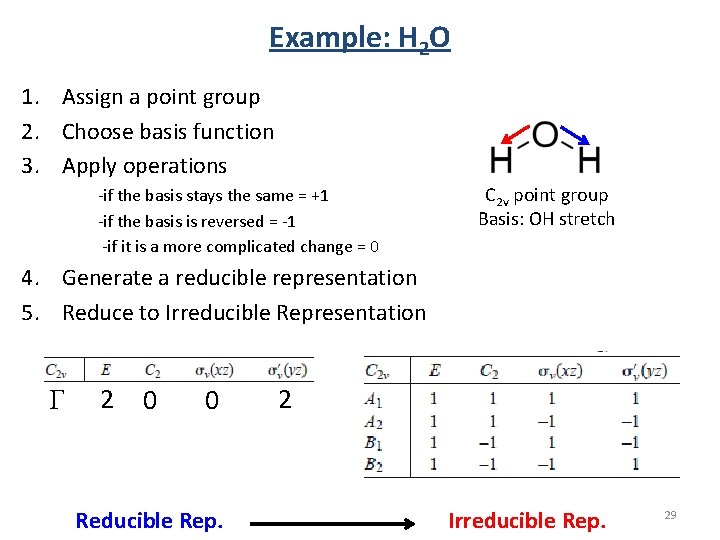
Example: H 2 O 1. Assign a point group 2. Choose basis function 3. Apply operations -if the basis stays the same = +1 -if the basis is reversed = -1 -if it is a more complicated change = 0 E C 2 sxz syz C 2 v point group Basis: OH stretch E: 2 C 2 : 0 sxz: 0 syz: 2 28
Example: H 2 O 1. Assign a point group 2. Choose basis function 3. Apply operations -if the basis stays the same = +1 -if the basis is reversed = -1 -if it is a more complicated change = 0 C 2 v point group Basis: OH stretch 4. Generate a reducible representation 5. Reduce to Irreducible Representation G 2 0 0 Reducible Rep. 2 Irreducible Rep. 29
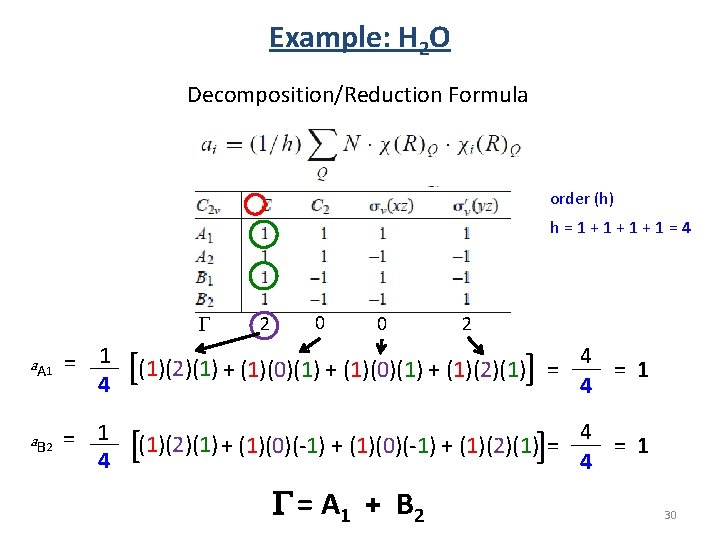
Example: H 2 O Decomposition/Reduction Formula order (h) h=1+1+1+1=4 G a A 1 = 1 4 [ a. B 2 = 1 [ 4 2 0 0 2 ] (1)(2)(1) + (1)(0)(1) + (1)(2)(1) = ] (1)(2)(1) + (1)(0)(-1) + (1)(2)(1) = G = A 1 + B 2 4 = 1 4 30
Example: H 2 O 2) Assign the Symmetry of a Known Vibrations Stretch A 1 Vibrations = A 1 + B 2 A 1 B 2 Bend All three are IR active but that is not always the case. 31
Vibrations and Group Theory 1) Find number/symmetry of vibrational modes. 2) Assign the symmetry of known vibrations. 3) Find if a vibrational mode is IR or Raman Active. 32
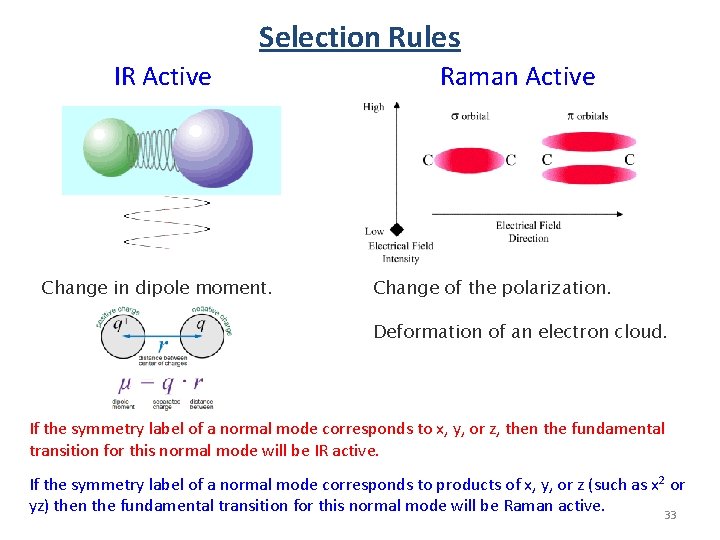
Selection Rules IR Active Change in dipole moment. Raman Active Change of the polarization. Deformation of an electron cloud. If the symmetry label of a normal mode corresponds to x, y, or z, then the fundamental transition for this normal mode will be IR active. If the symmetry label of a normal mode corresponds to products of x, y, or z (such as x 2 or yz) then the fundamental transition for this normal mode will be Raman active. 33
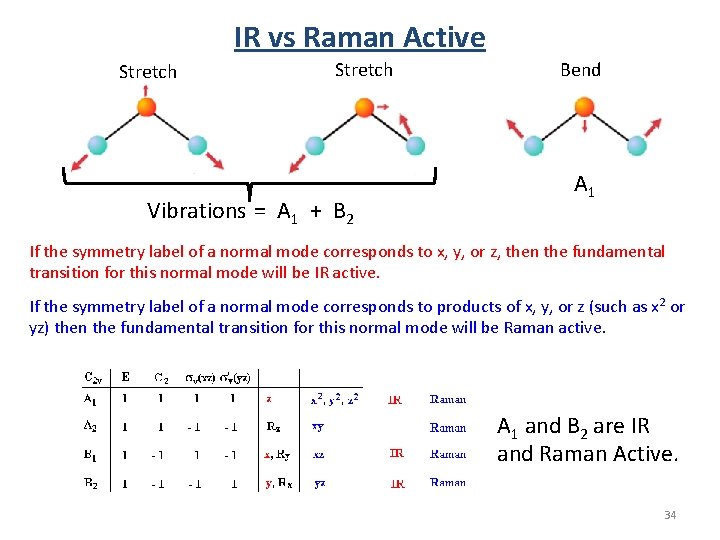
IR vs Raman Active Stretch Vibrations = A 1 + B 2 Bend A 1 If the symmetry label of a normal mode corresponds to x, y, or z, then the fundamental transition for this normal mode will be IR active. If the symmetry label of a normal mode corresponds to products of x, y, or z (such as x 2 or yz) then the fundamental transition for this normal mode will be Raman active. A 1 and B 2 are IR and Raman Active. 34
Vibrations of C 60 1) Find number/symmetry of vibrational modes. 2) Assign the symmetry of known vibrations. 3) Find if a vibrational mode is IR or Raman Active. 35
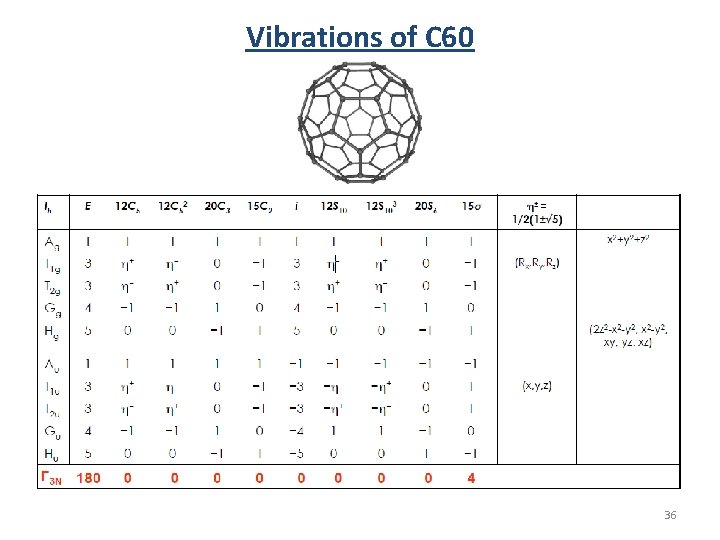
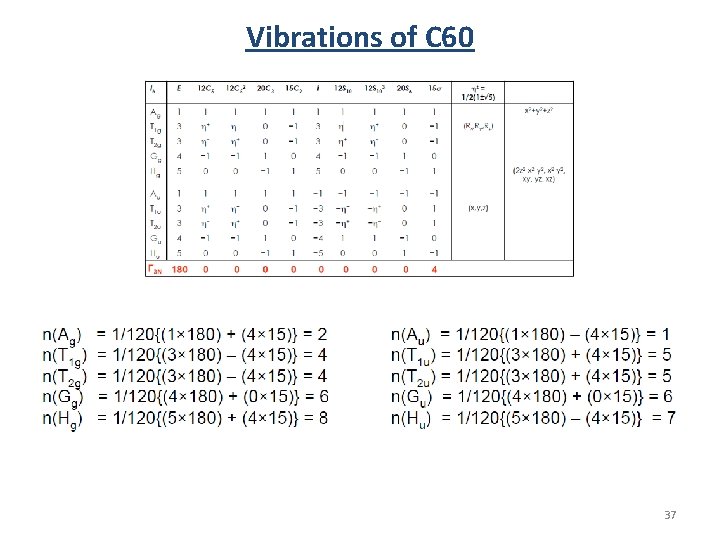
Vibrations of C 60 36
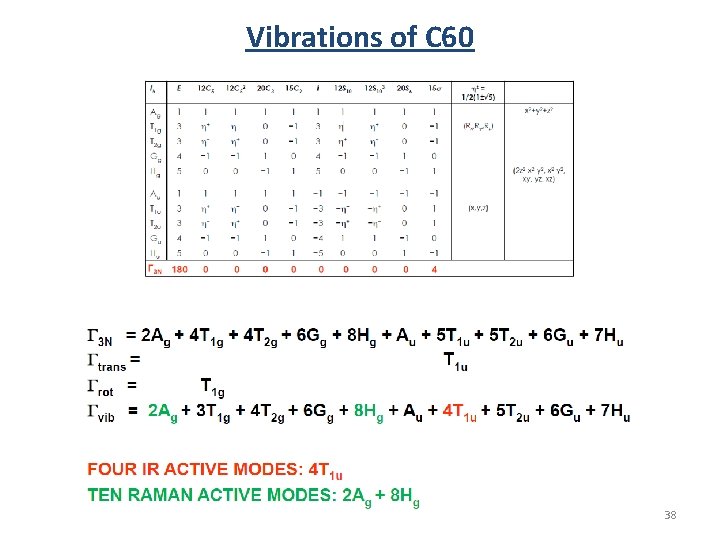
Vibrations of C 60 37
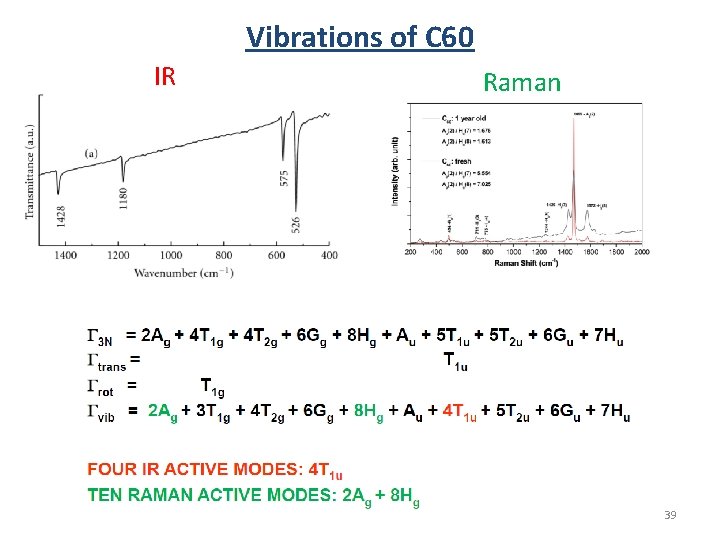
Vibrations of C 60 38
Vibrations of C 60 IR Raman 39
End of preview. 40
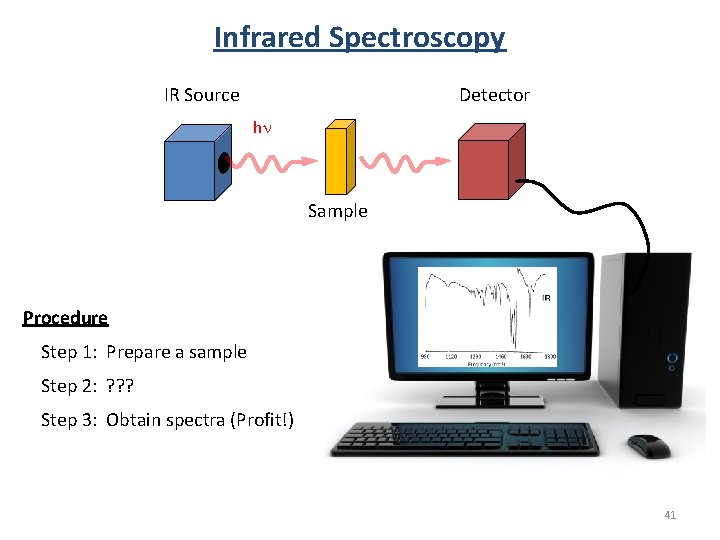
Infrared Spectroscopy Detector IR Source hn Sample Procedure Step 1: Prepare a sample Step 2: ? ? ? Step 3: Obtain spectra (Profit!) 41
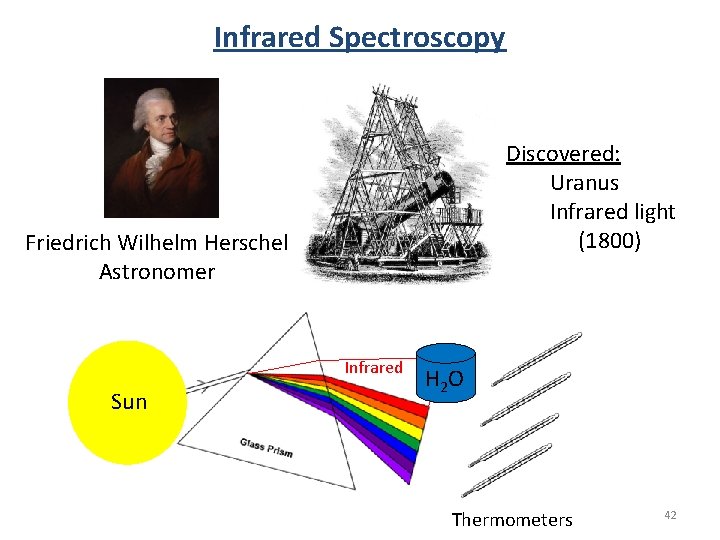
Infrared Spectroscopy Discovered: Uranus Infrared light (1800) Friedrich Wilhelm Herschel Astronomer Infrared Sun H 2 O Thermometers 42
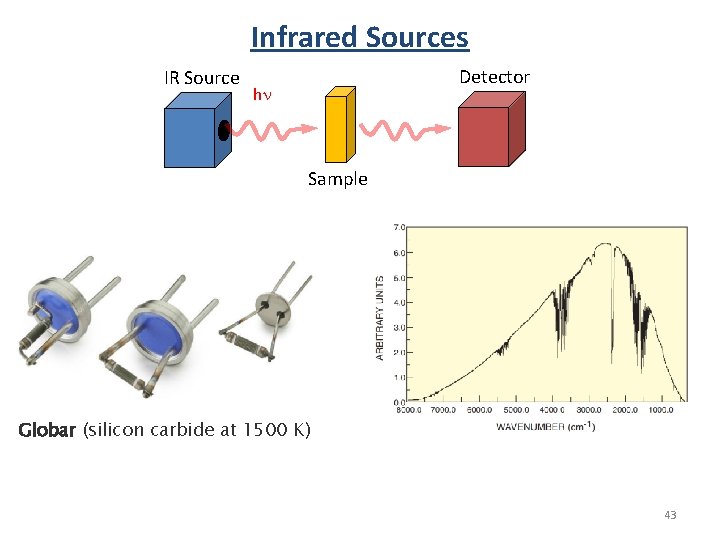
Infrared Sources IR Source Detector hn Sample Globar (silicon carbide at 1500 K) 43
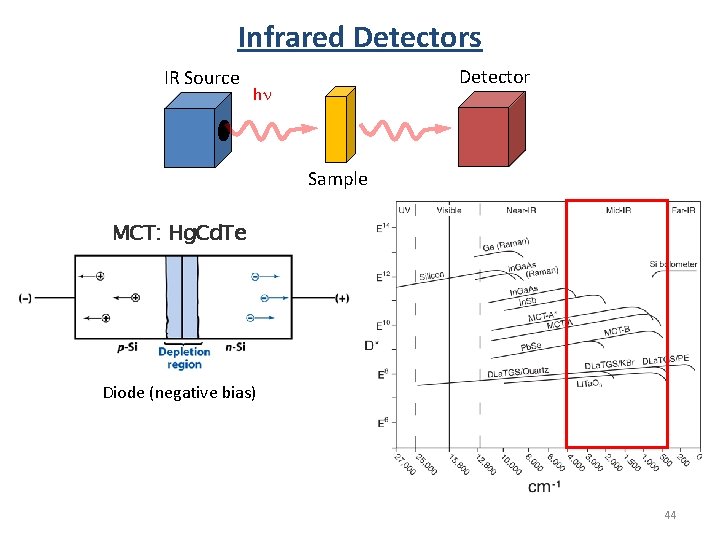
Infrared Detectors IR Source Detector hn Sample MCT: Hg. Cd. Te Diode (negative bias) 44
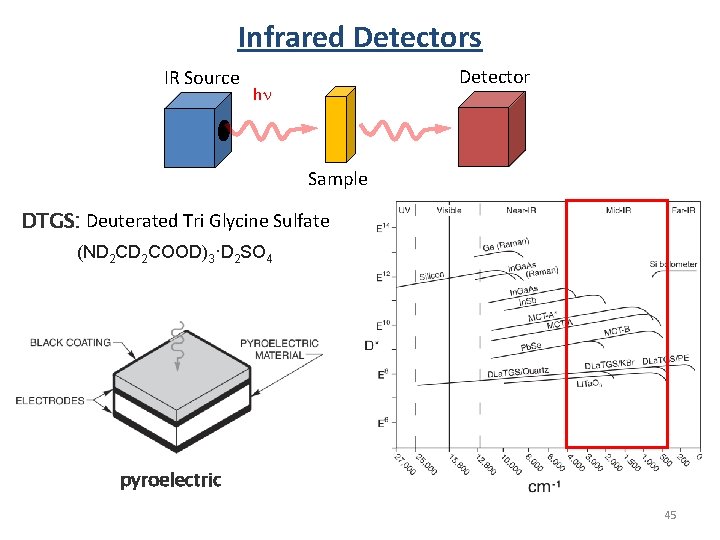
Infrared Detectors IR Source Detector hn Sample DTGS: Deuterated Tri Glycine Sulfate (ND 2 COOD)3·D 2 SO 4 pyroelectric 45
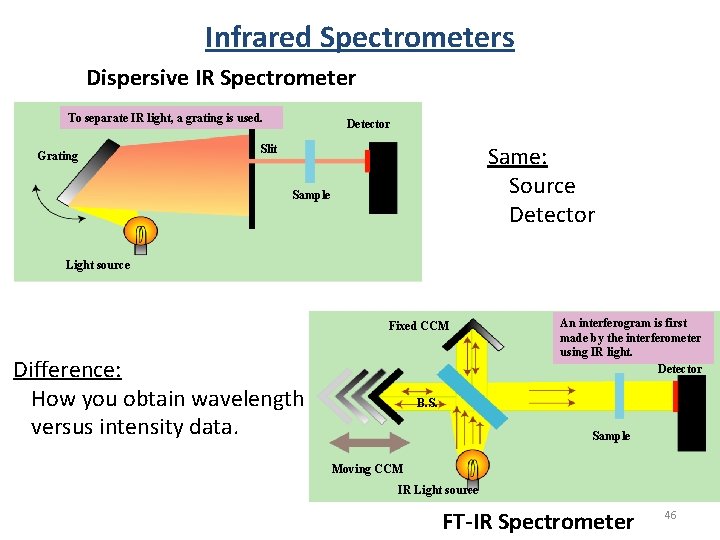
Infrared Spectrometers Dispersive IR Spectrometer To separate IR light, a grating is used. Grating Detector Same: Source Detector Slit Sample Light source Fixed CCM Difference: How you obtain wavelength versus intensity data. An interferogram is first made by the interferometer using IR light. Detector B. S. Sample Moving CCM IR Light source FT-IR Spectrometer 46
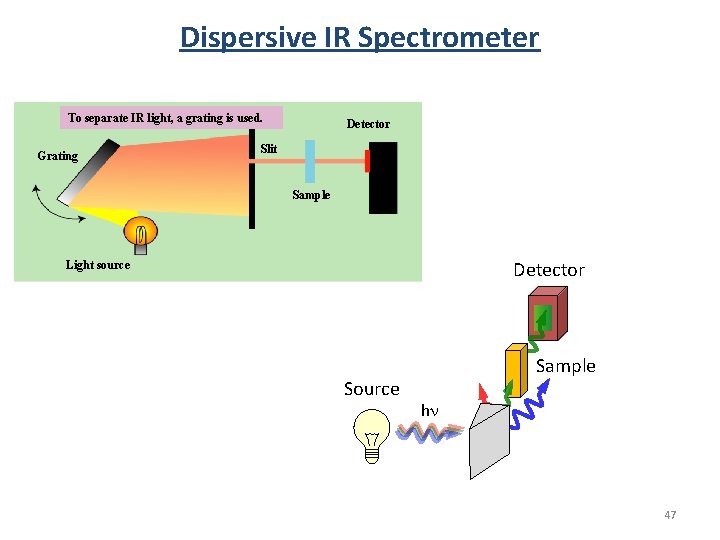
Dispersive IR Spectrometer To separate IR light, a grating is used. Grating Detector Slit Sample Detector Light source Sample hn 47
Dispersive IR Spectrometer 48
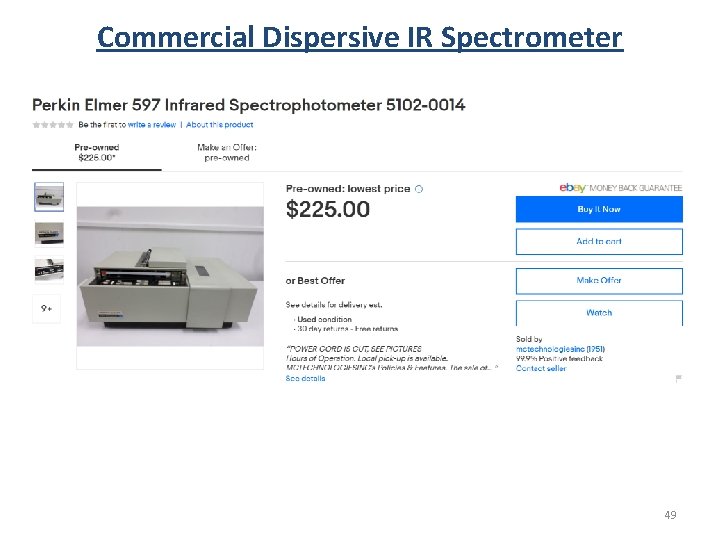
Commercial Dispersive IR Spectrometer 49
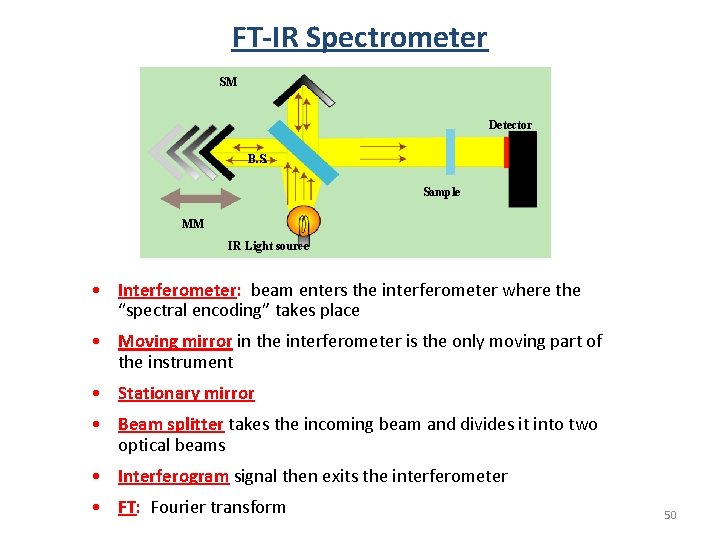
FT-IR Spectrometer SM Detector B. S. Sample MM IR Light source • Interferometer: beam enters the interferometer where the “spectral encoding” takes place • Moving mirror in the interferometer is the only moving part of the instrument • Stationary mirror • Beam splitter takes the incoming beam and divides it into two optical beams • Interferogram signal then exits the interferometer • FT: Fourier transform 50
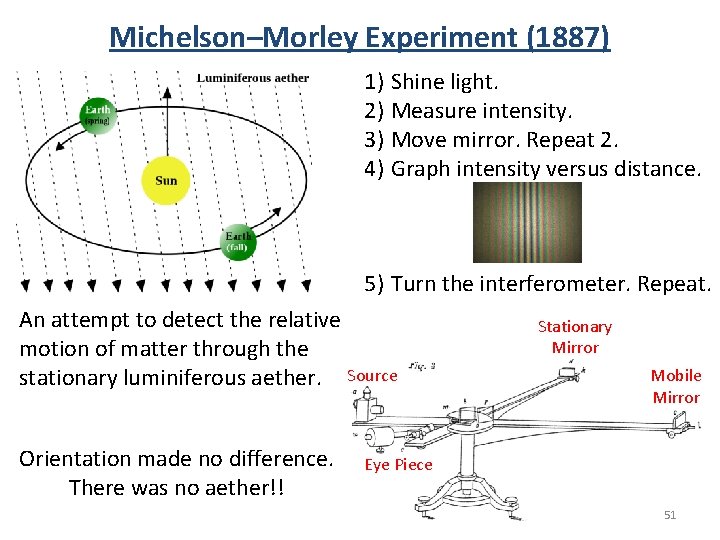
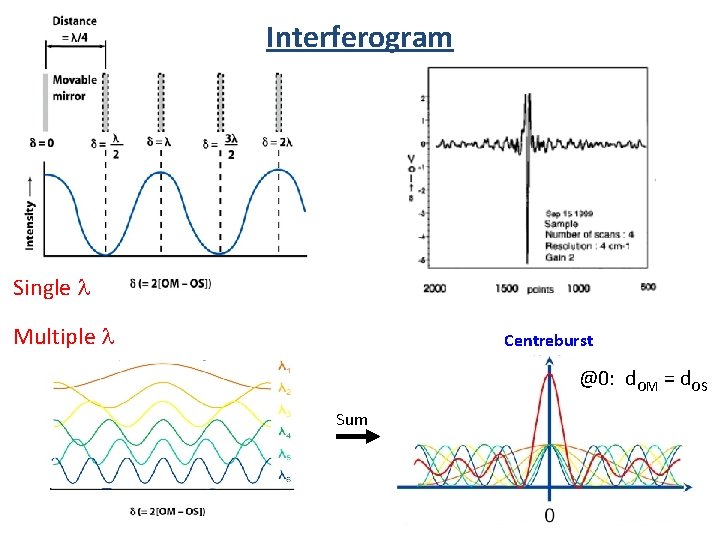
Michelson–Morley Experiment (1887) 1) Shine light. 2) Measure intensity. 3) Move mirror. Repeat 2. 4) Graph intensity versus distance. 5) Turn the interferometer. Repeat. An attempt to detect the relative motion of matter through the stationary luminiferous aether. Source Orientation made no difference. There was no aether!! Stationary Mirror Mobile Mirror Eye Piece 51
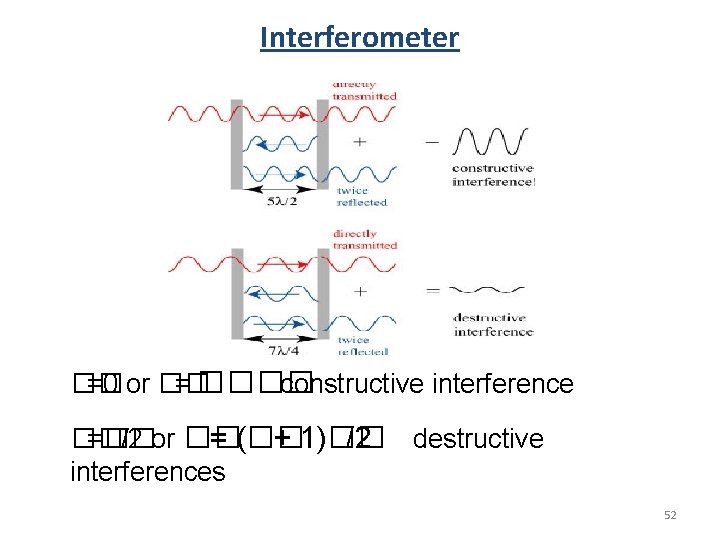
Interferometer �� =0 or �� = ���� constructive interference �� =�� /2 or �� = (�� + 1)�� /2 destructive interferences 52
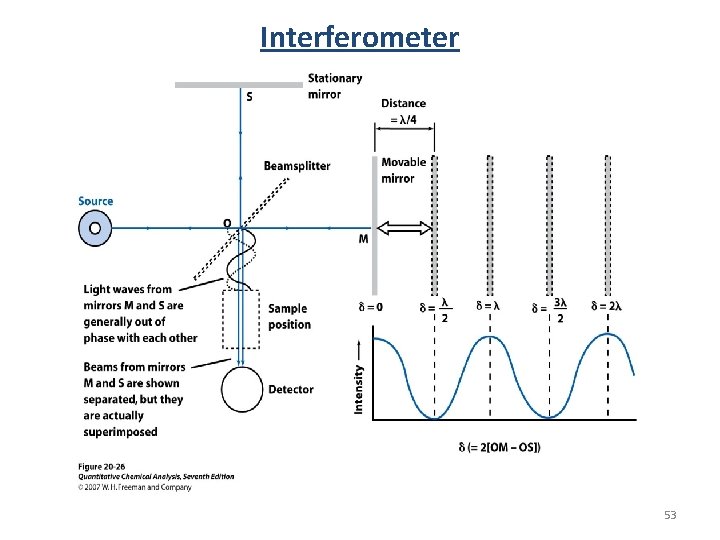
Interferometer 53
Interferogram Single l Multiple l Centreburst @0: d. OM = d. OS Sum 54
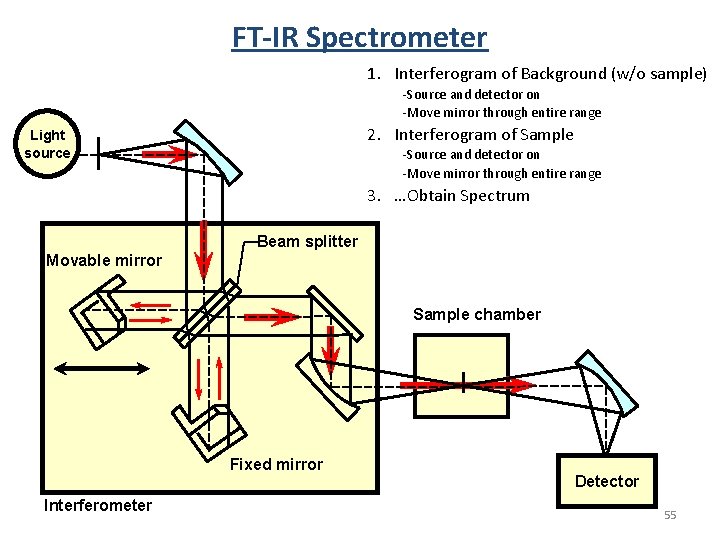
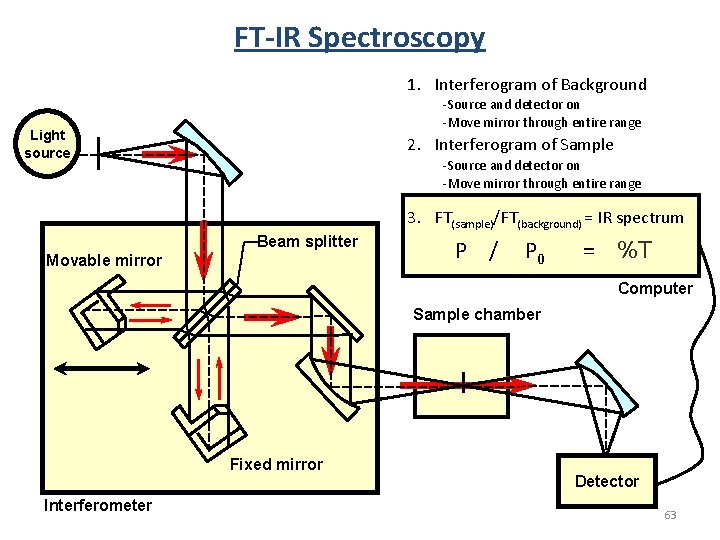
FT-IR Spectrometer 1. Interferogram of Background (w/o sample) -Source and detector on -Move mirror through entire range 2. Interferogram of Sample Light source -Source and detector on -Move mirror through entire range 3. …Obtain Spectrum Beam splitter Movable mirror Sample chamber Fixed mirror Interferometer Detector 55
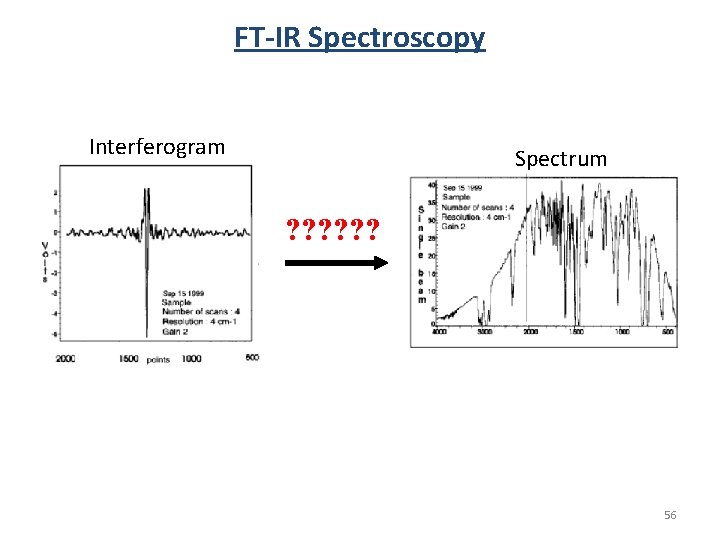
FT-IR Spectroscopy Interferogram Spectrum ? ? ? 56
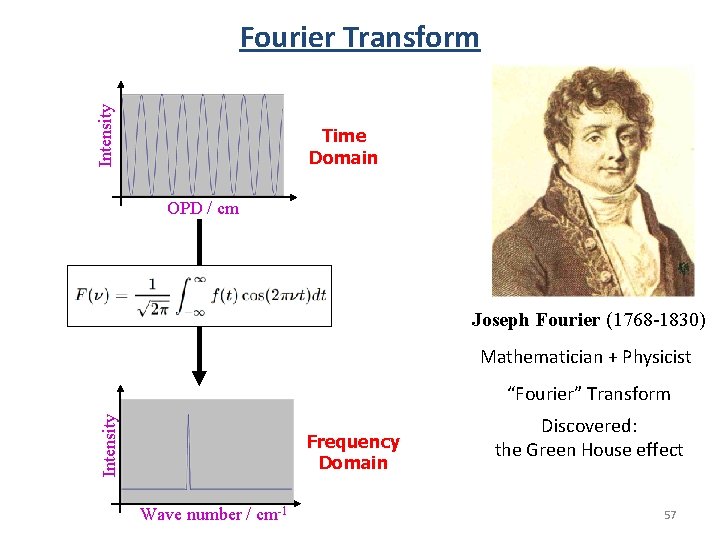
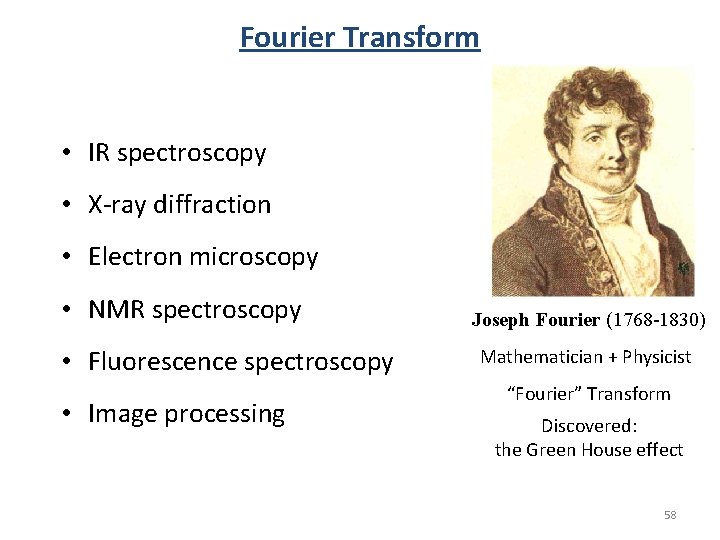
Intensity Fourier Transform Time Domain OPD / cm Joseph Fourier (1768 -1830) Mathematician + Physicist Intensity “Fourier” Transform Frequency Domain Wave number / cm-1 Discovered: the Green House effect 57
Fourier Transform • IR spectroscopy • X-ray diffraction • Electron microscopy • NMR spectroscopy • Fluorescence spectroscopy • Image processing Joseph Fourier (1768 -1830) Mathematician + Physicist “Fourier” Transform Discovered: the Green House effect 58
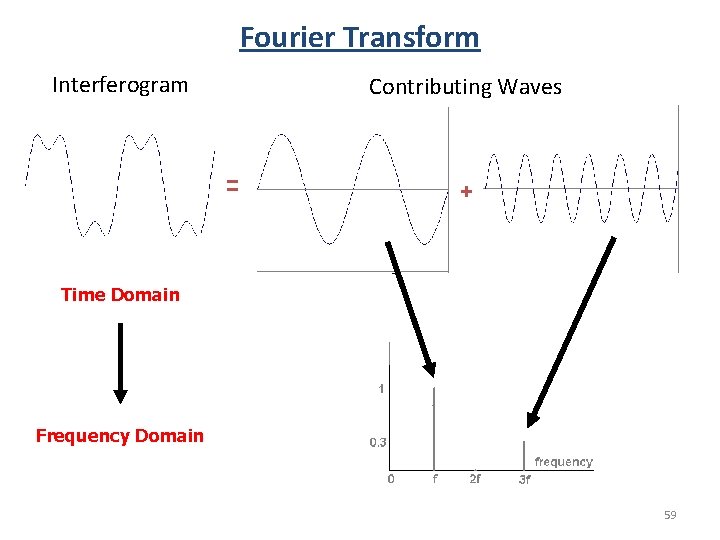
Fourier Transform Interferogram Contributing Waves = + Time Domain Frequency Domain 59
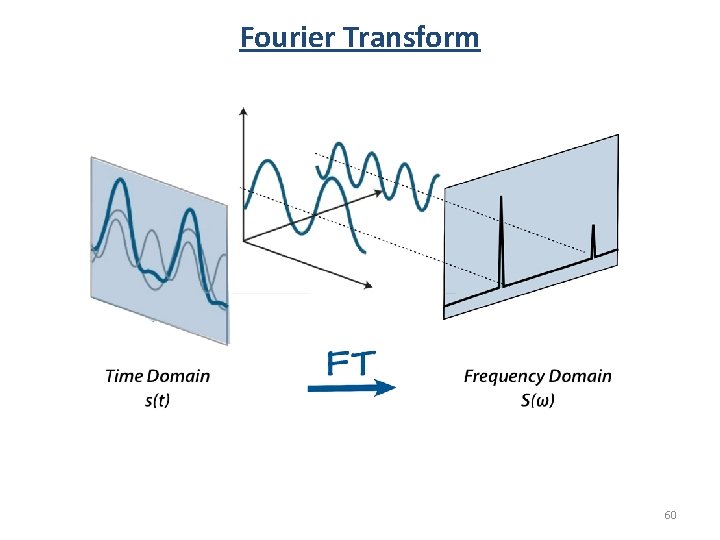
Fourier Transform 60
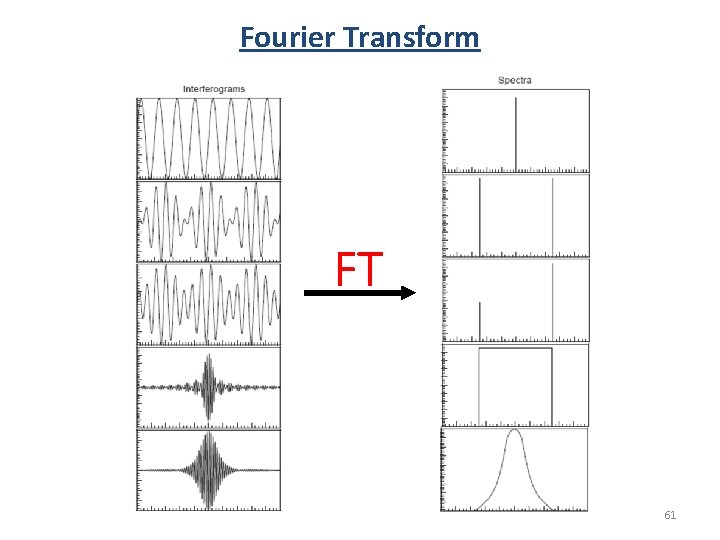
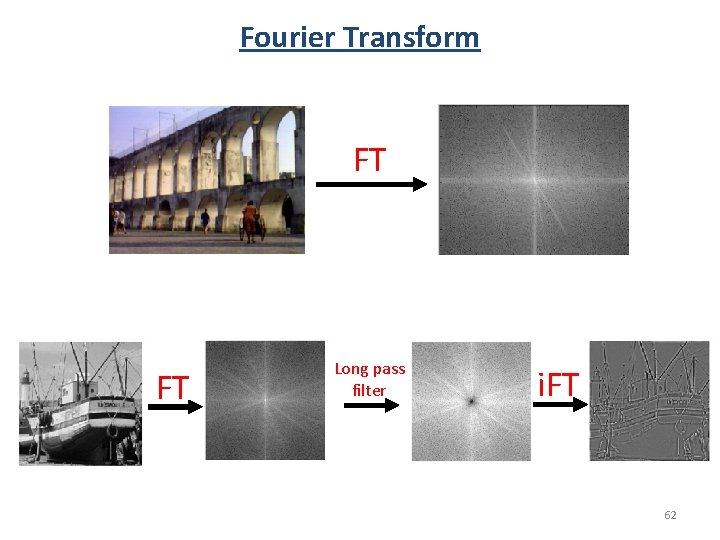
Fourier Transform FT 61
Fourier Transform FT FT Long pass filter i. FT 62
FT-IR Spectroscopy 1. Interferogram of Background -Source and detector on -Move mirror through entire range Light source 2. Interferogram of Sample -Source and detector on -Move mirror through entire range 3. FT(sample)/FT(background) = IR spectrum Beam splitter Movable mirror P / P 0 = %T Computer Sample chamber Fixed mirror Interferometer Detector 63
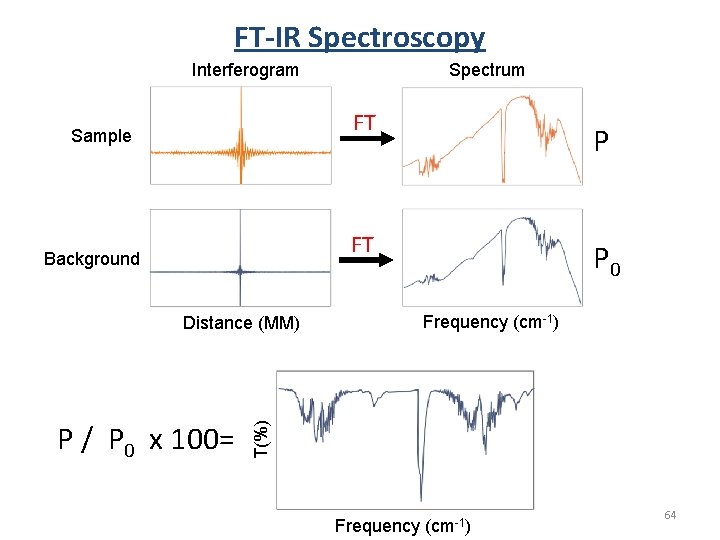
FT-IR Spectroscopy Spectrum Interferogram FT Sample P FT Background Frequency (cm-1) T(%) Distance (MM) P / P 0 x 100= P 0 Frequency (cm-1) 64
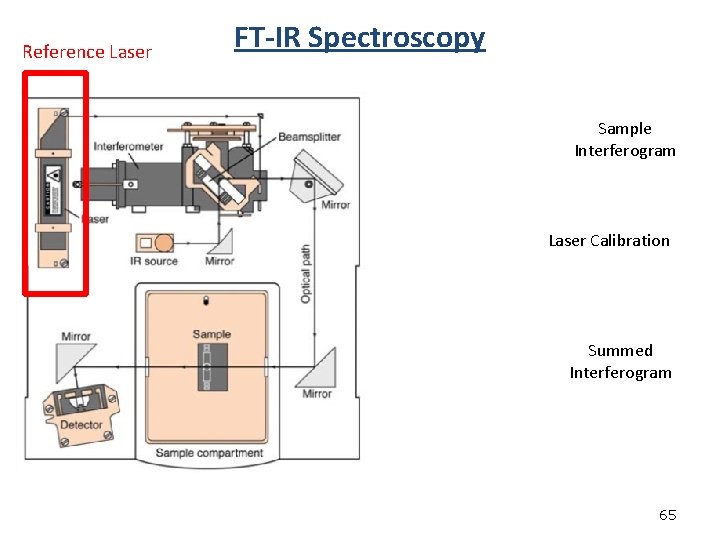
Reference Laser FT-IR Spectroscopy Sample Interferogram Laser Calibration Summed Interferogram 65
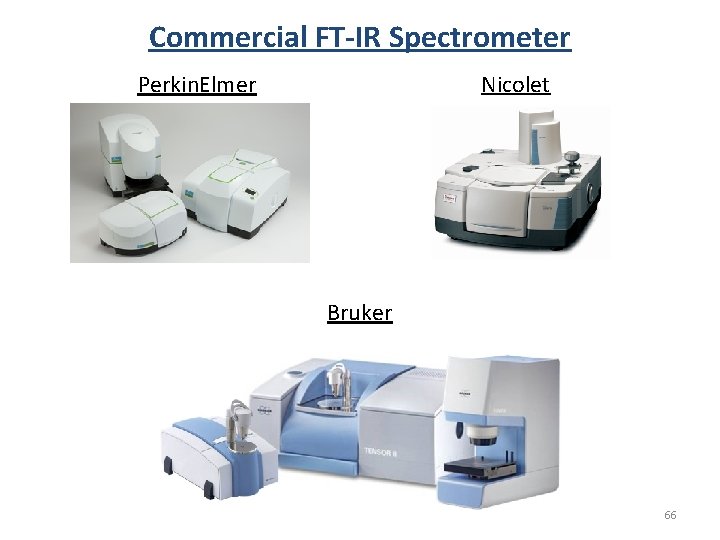
Commercial FT-IR Spectrometer Nicolet Perkin. Elmer Bruker 66
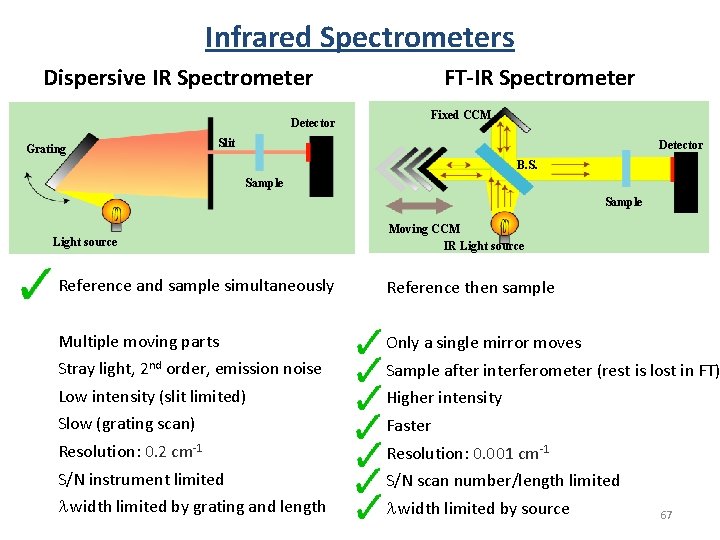
Infrared Spectrometers FT-IR Spectrometer Dispersive IR Spectrometer Detector Grating Fixed CCM Slit Detector B. S. Sample Light source Moving CCM IR Light source Reference and sample simultaneously Reference then sample Multiple moving parts Only a single mirror moves Stray light, 2 nd order, emission noise Sample after interferometer (rest is lost in FT) Low intensity (slit limited) Higher intensity Slow (grating scan) Faster Resolution: 0. 2 cm-1 Resolution: 0. 001 cm-1 S/N instrument limited S/N scan number/length limited l width limited by grating and length l width limited by source 67
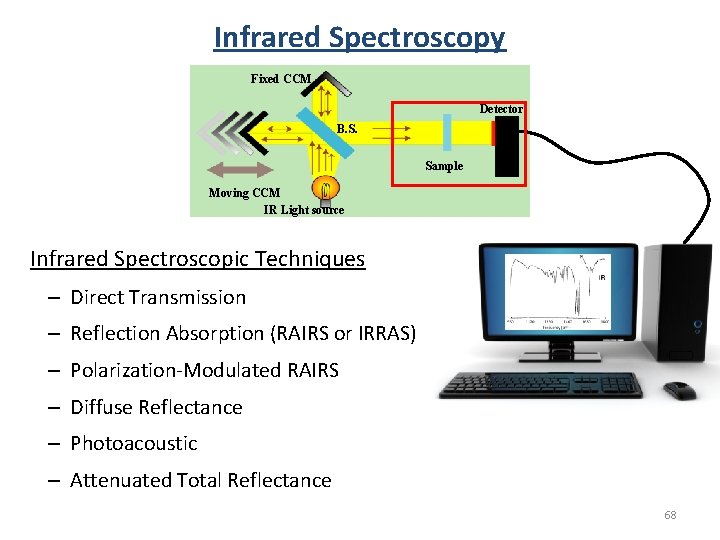
Infrared Spectroscopy Fixed CCM Detector B. S. Sample Moving CCM IR Light source Infrared Spectroscopic Techniques – Direct Transmission – Reflection Absorption (RAIRS or IRRAS) – Polarization-Modulated RAIRS – Diffuse Reflectance – Photoacoustic – Attenuated Total Reflectance 68
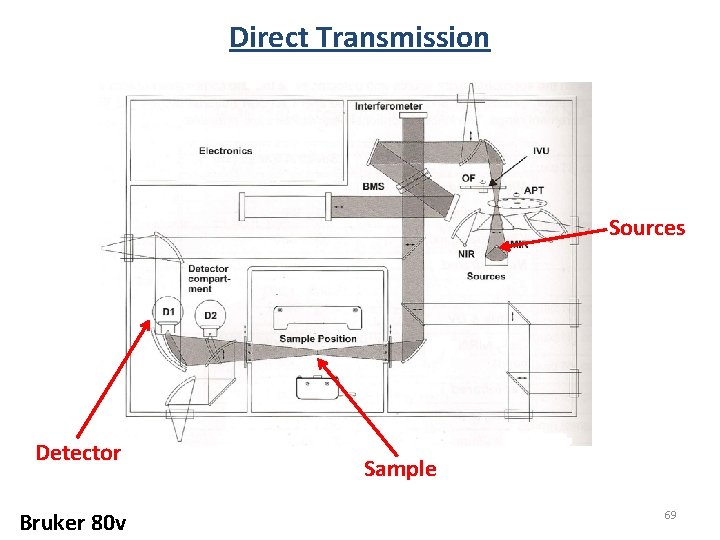
Direct Transmission Sources Detector Bruker 80 v Sample 69
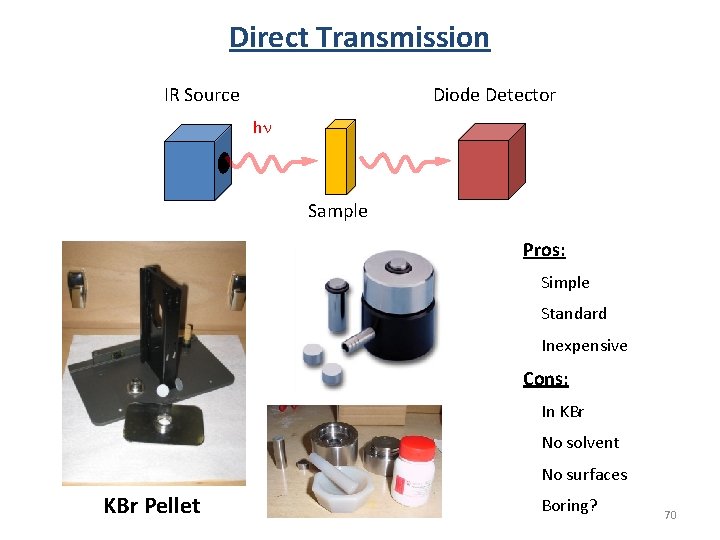
Direct Transmission Diode Detector IR Source hn Sample Pros: Simple Standard Inexpensive Cons: In KBr No solvent No surfaces KBr Pellet Boring? 70
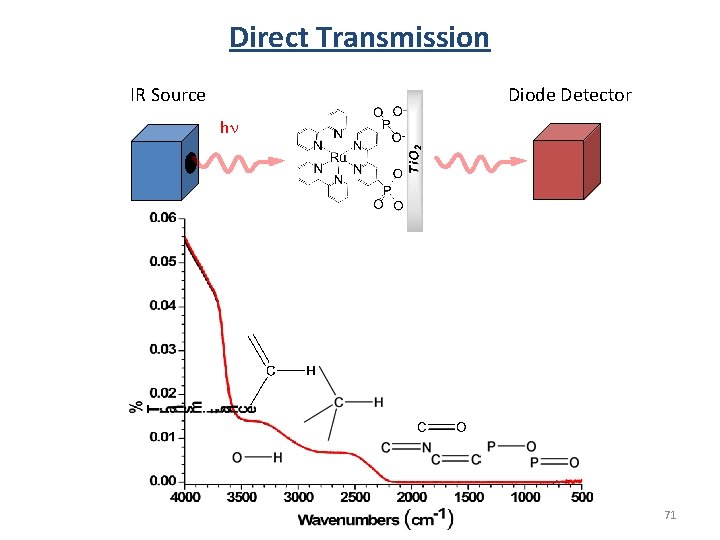
Direct Transmission Diode Detector IR Source hn 71
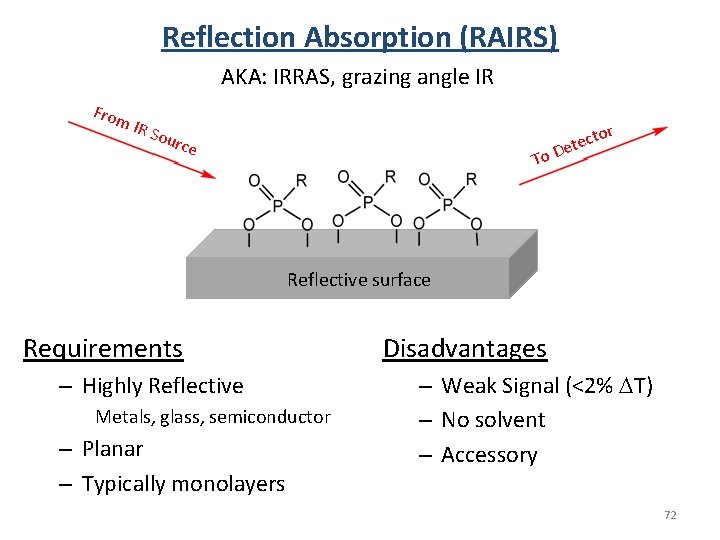
Reflection Absorption (RAIRS) AKA: IRRAS, grazing angle IR From IR S o r urce To ecto t e D Reflective surface Requirements – Highly Reflective Metals, glass, semiconductor – Planar – Typically monolayers Disadvantages – Weak Signal (<2% DT) – No solvent – Accessory 72
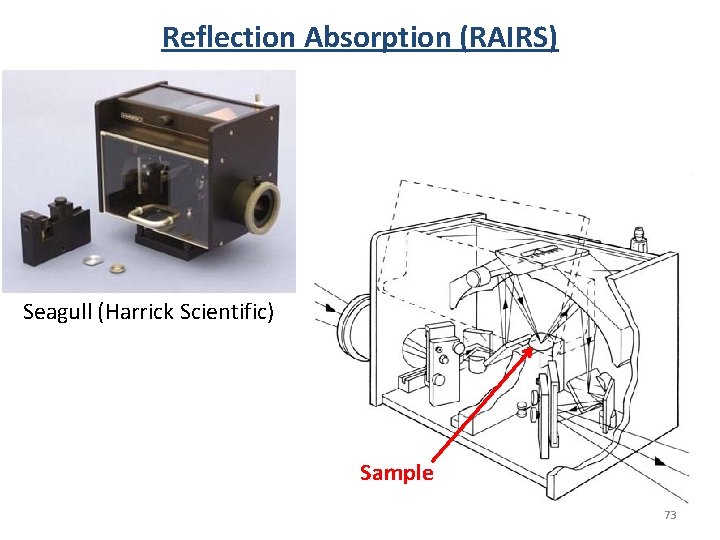
Reflection Absorption (RAIRS) Seagull (Harrick Scientific) Sample 73
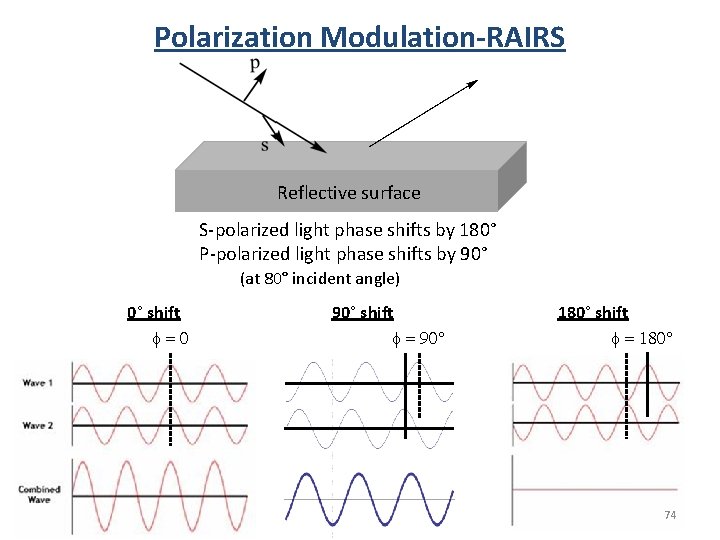
Polarization Modulation-RAIRS Reflective surface S-polarized light phase shifts by 180° P-polarized light phase shifts by 90° (at 80° incident angle) 0° shift f=0 90° shift f = 90° 180° shift f = 180° 74
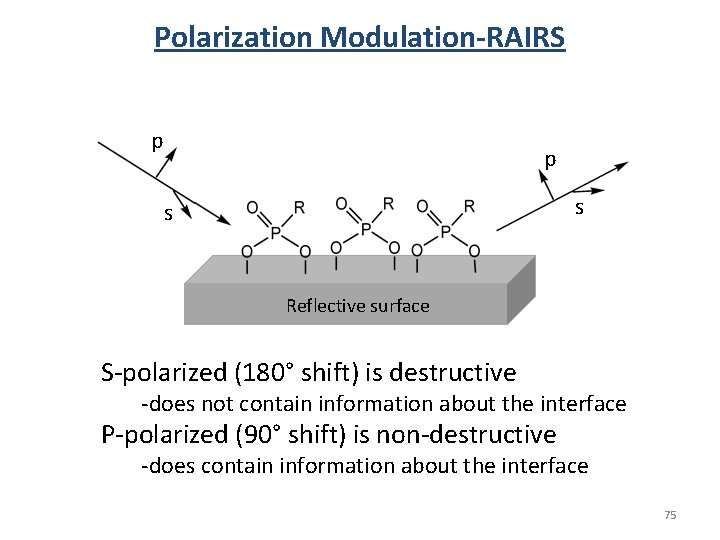
Polarization Modulation-RAIRS p p s s Reflective surface S-polarized (180° shift) is destructive -does not contain information about the interface P-polarized (90° shift) is non-destructive -does contain information about the interface 75
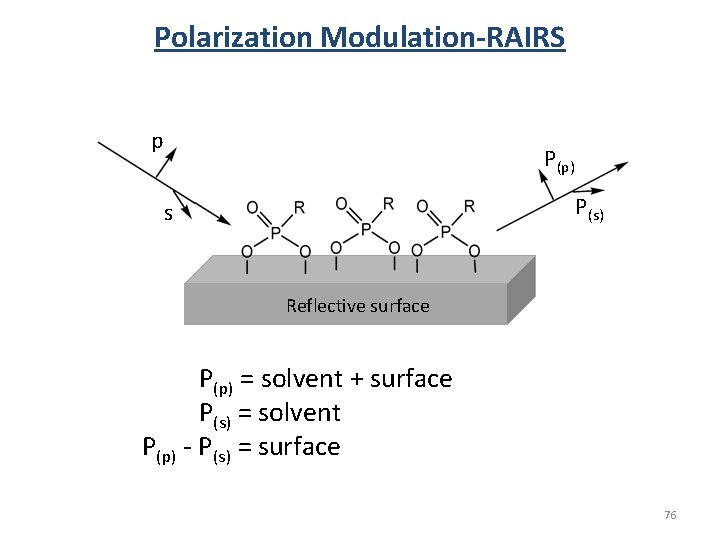
Polarization Modulation-RAIRS p P(p) P(s) s Reflective surface P(p) = solvent + surface P(s) = solvent P(p) - P(s) = surface 76
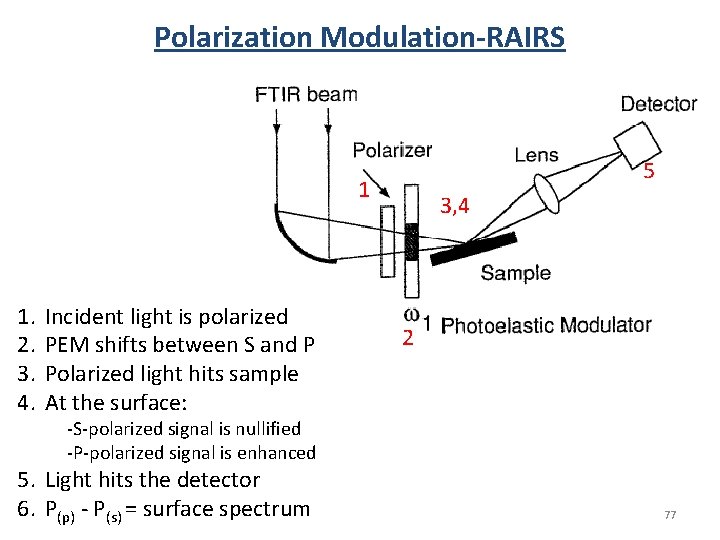
Polarization Modulation-RAIRS 5 1 1. 2. 3. 4. Incident light is polarized PEM shifts between S and P Polarized light hits sample At the surface: 3, 4 2 -S-polarized signal is nullified -P-polarized signal is enhanced 5. Light hits the detector 6. P(p) - P(s) = surface spectrum 77
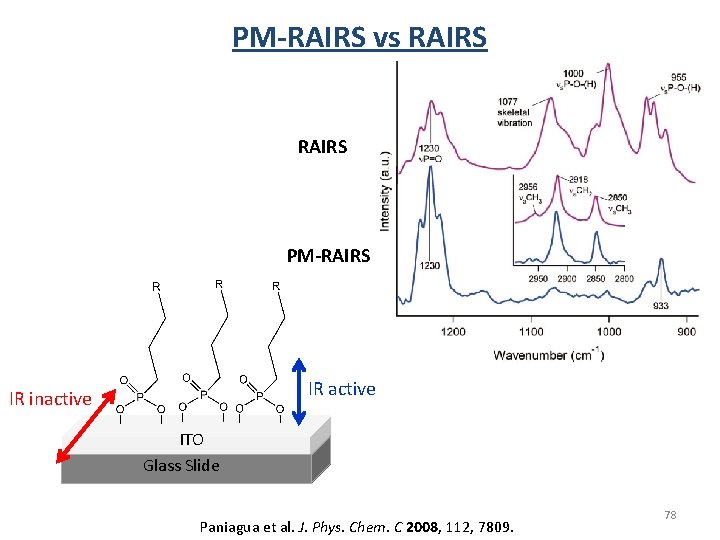
PM-RAIRS vs RAIRS PM-RAIRS IR active IR inactive ITO Glass Slide Paniagua et al. J. Phys. Chem. C 2008, 112, 7809. 78
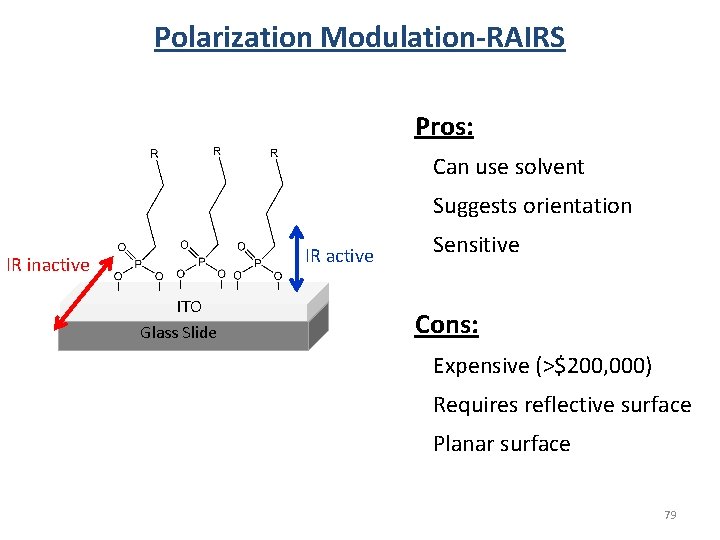
Polarization Modulation-RAIRS Pros: Can use solvent Suggests orientation IR active IR inactive ITO Glass Slide Sensitive Cons: Expensive (>$200, 000) Requires reflective surface Planar surface 79
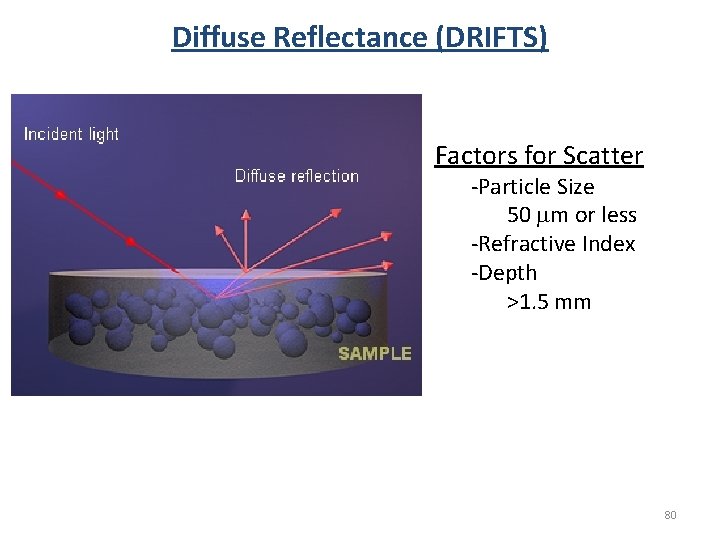
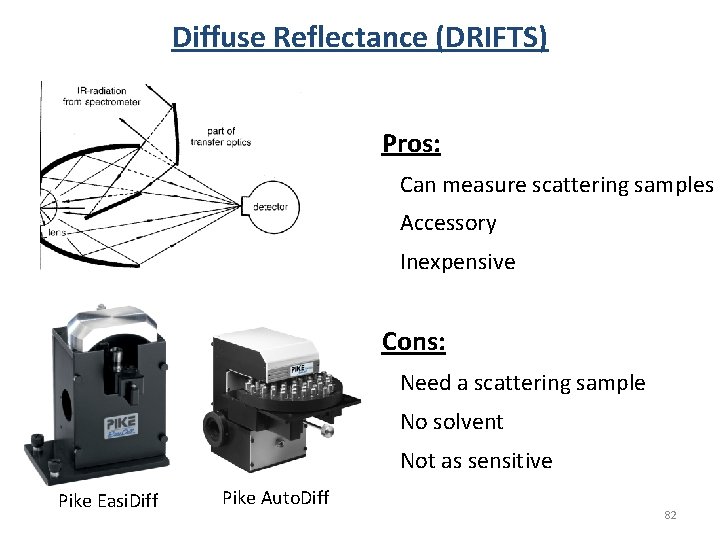
Diffuse Reflectance (DRIFTS) Factors for Scatter -Particle Size 50 mm or less -Refractive Index -Depth >1. 5 mm 80
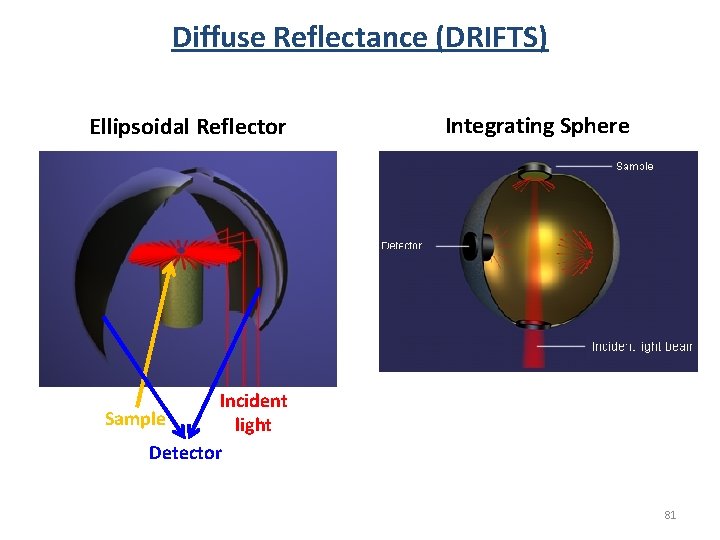
Diffuse Reflectance (DRIFTS) Ellipsoidal Reflector Integrating Sphere Incident Sample light Detector 81
Diffuse Reflectance (DRIFTS) Pros: Can measure scattering samples Accessory Inexpensive Cons: Need a scattering sample No solvent Not as sensitive Pike Easi. Diff Pike Auto. Diff 82
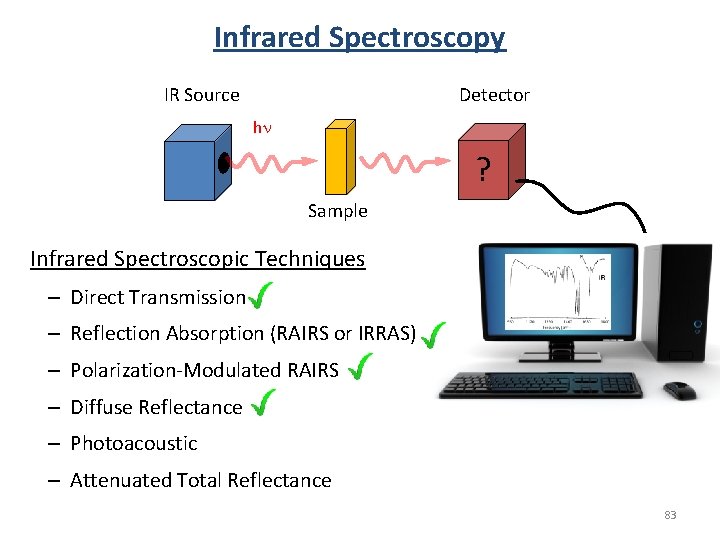
Infrared Spectroscopy Detector IR Source hn ? Sample Infrared Spectroscopic Techniques – Direct Transmission – Reflection Absorption (RAIRS or IRRAS) – Polarization-Modulated RAIRS – Diffuse Reflectance – Photoacoustic – Attenuated Total Reflectance 83
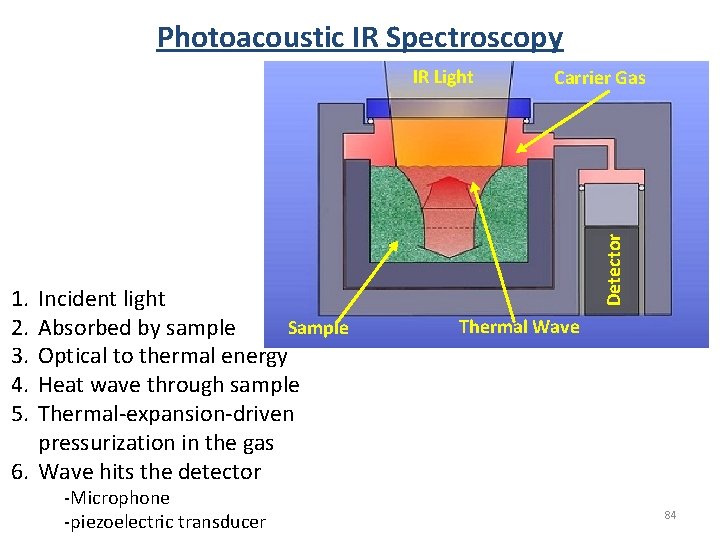
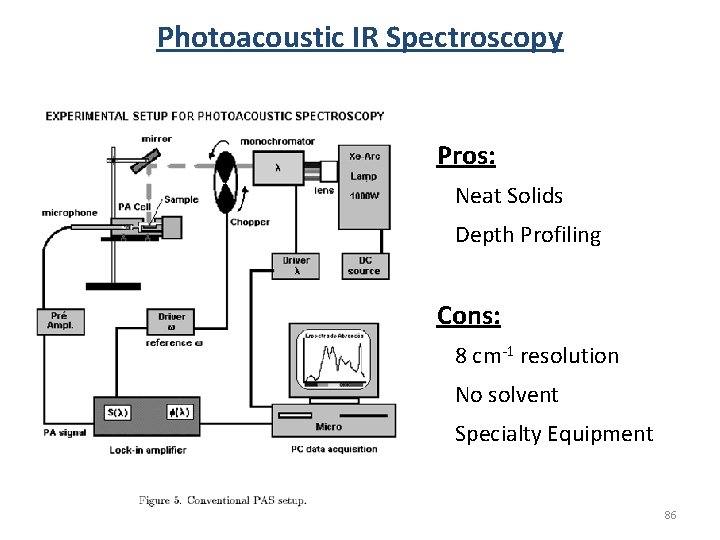
Photoacoustic IR Spectroscopy 1. 2. 3. 4. 5. Incident light Sample Absorbed by sample Optical to thermal energy Heat wave through sample Thermal-expansion-driven pressurization in the gas 6. Wave hits the detector -Microphone -piezoelectric transducer Carrier Gas Detector IR Light Thermal Wave 84
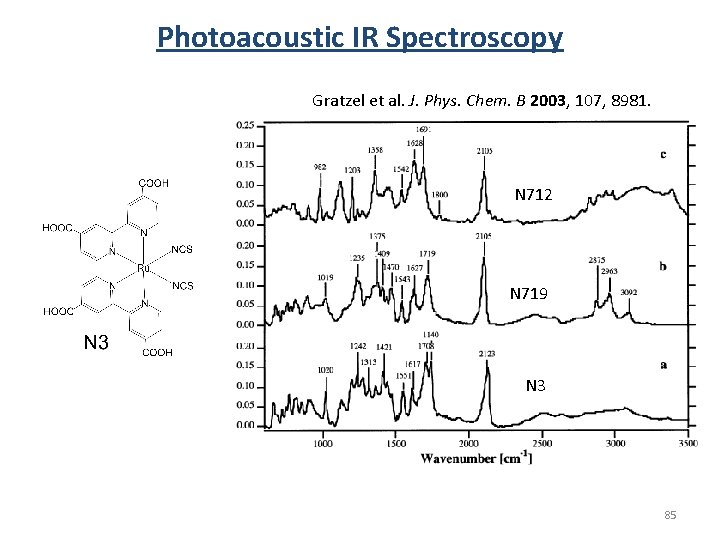
Photoacoustic IR Spectroscopy Gratzel et al. J. Phys. Chem. B 2003, 107, 8981. N 712 N 719 N 3 85
Photoacoustic IR Spectroscopy Pros: Neat Solids Depth Profiling Cons: 8 cm-1 resolution No solvent Specialty Equipment 86
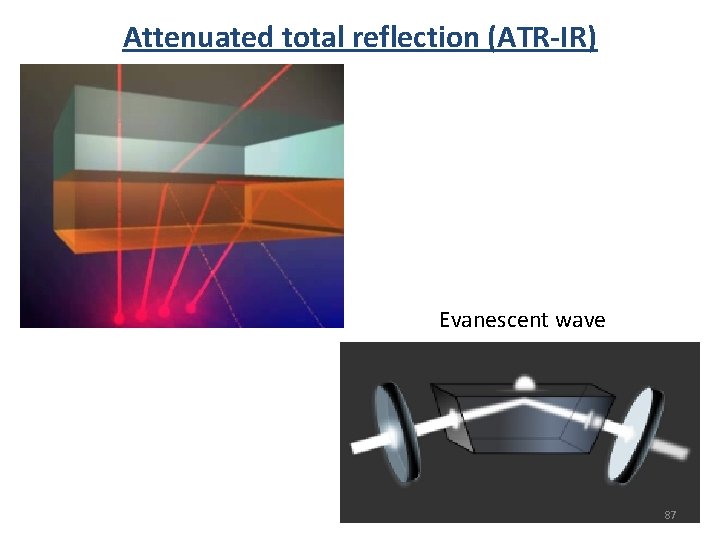
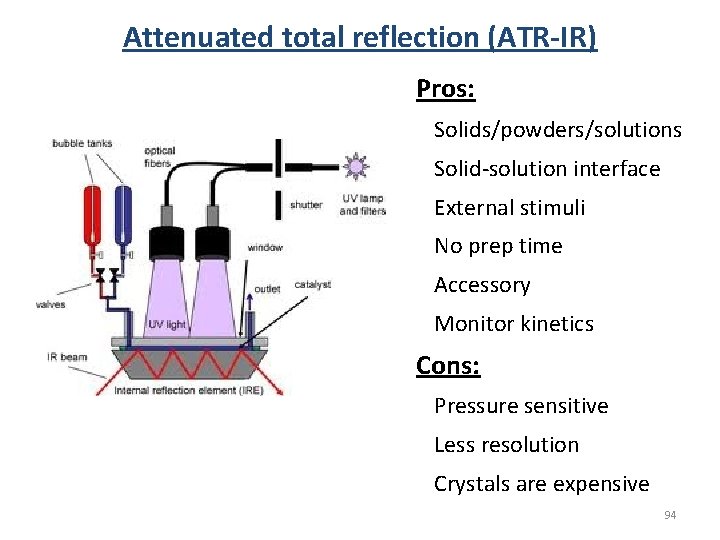
Attenuated total reflection (ATR-IR) Evanescent wave 87
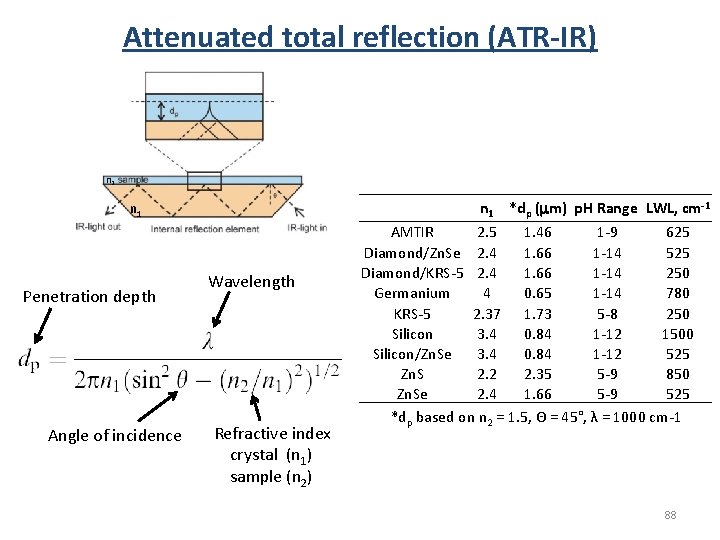
Attenuated total reflection (ATR-IR) n 2 n 1 Penetration depth Angle of incidence Wavelength Refractive index crystal (n 1) sample (n 2) n 1 *dp (mm) p. H Range LWL, cm-1 AMTIR 2. 5 1. 46 1 -9 625 Diamond/Zn. Se 2. 4 1. 66 1 -14 525 Diamond/KRS-5 2. 4 1. 66 1 -14 250 Germanium 4 0. 65 1 -14 780 KRS-5 2. 37 1. 73 5 -8 250 Silicon 3. 4 0. 84 1 -12 1500 Silicon/Zn. Se 3. 4 0. 84 1 -12 525 Zn. S 2. 2 2. 35 5 -9 850 Zn. Se 2. 4 1. 66 5 -9 525 *dp based on n 2 = 1. 5, Θ = 45°, λ = 1000 cm-1 88
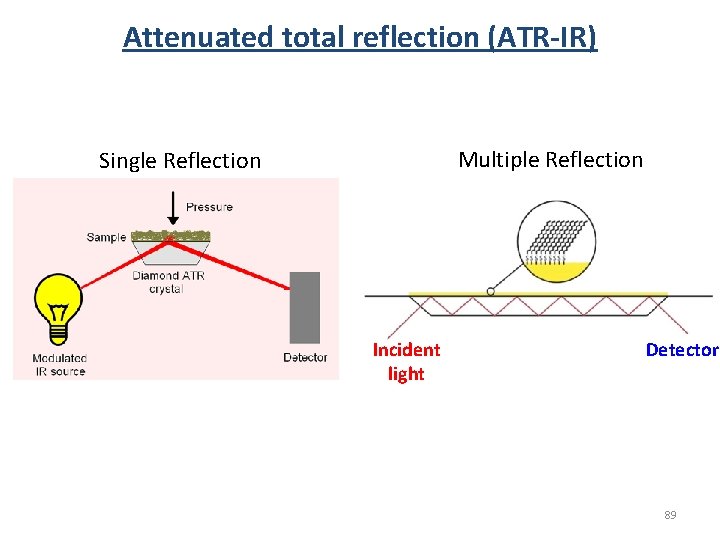
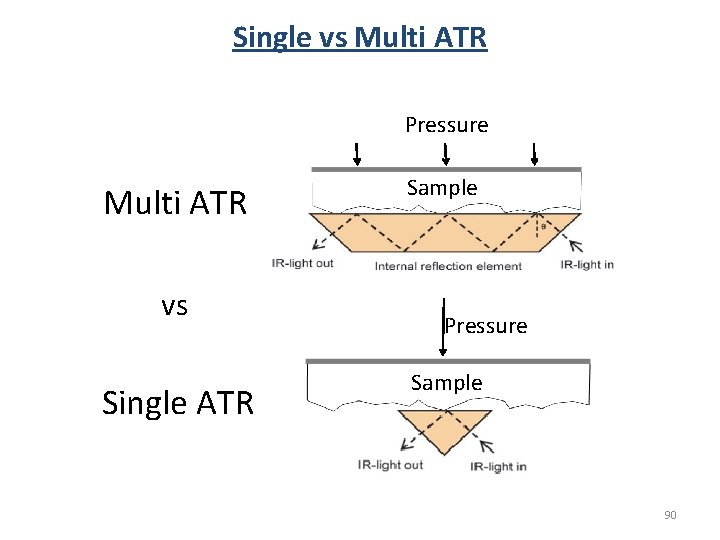
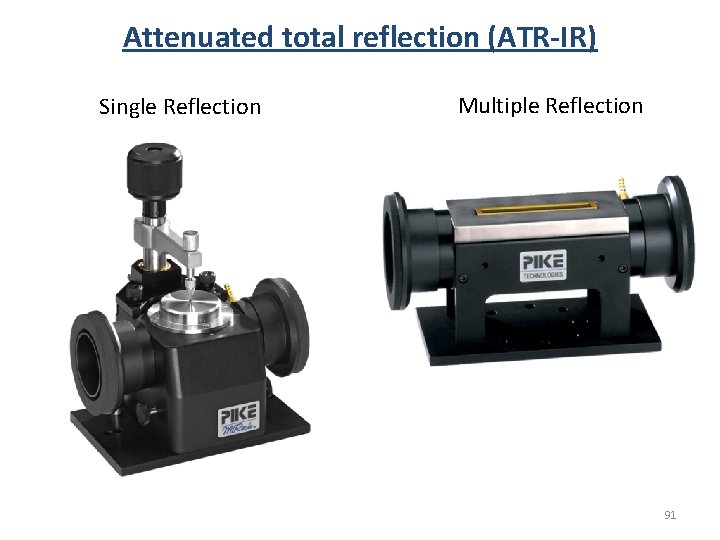
Attenuated total reflection (ATR-IR) Multiple Reflection Single Reflection Incident light Detector 89
Single vs Multi ATR Pressure Multi ATR vs Single ATR Sample Pressure Sample 90
Attenuated total reflection (ATR-IR) Single Reflection Multiple Reflection 91
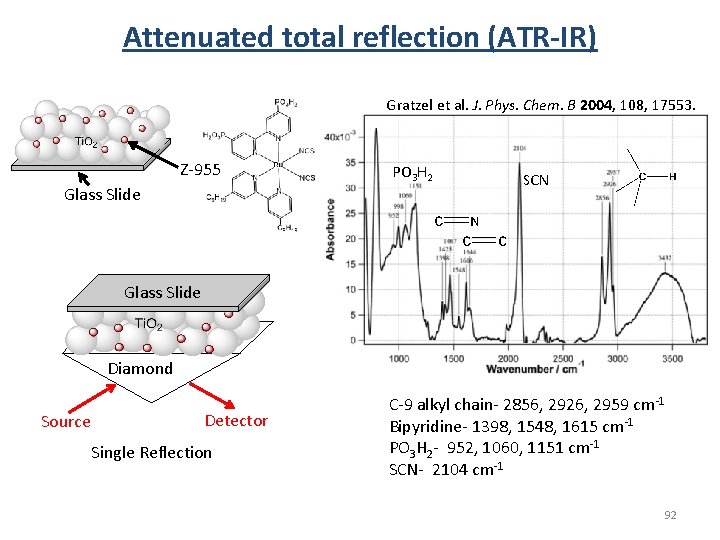
Attenuated total reflection (ATR-IR) Gratzel et al. J. Phys. Chem. B 2004, 108, 17553. Z-955 Glass Slide PO 3 H 2 SCN Glass Slide Diamond Source Detector Single Reflection C-9 alkyl chain- 2856, 2926, 2959 cm-1 Bipyridine- 1398, 1548, 1615 cm-1 PO 3 H 2 - 952, 1060, 1151 cm-1 SCN- 2104 cm-1 92
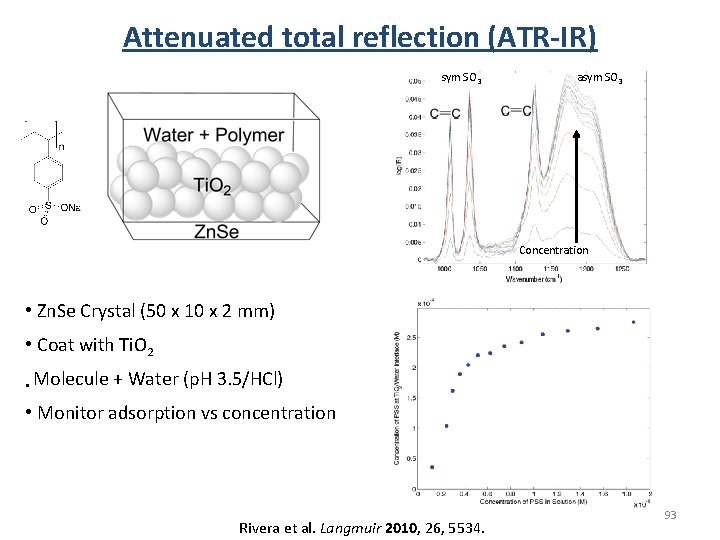
Attenuated total reflection (ATR-IR) sym SO 3 asym SO 3 Concentration • Zn. Se Crystal (50 x 10 x 2 mm) • Coat with Ti. O 2 • Molecule + Water (p. H 3. 5/HCl) • Monitor adsorption vs concentration Rivera et al. Langmuir 2010, 26, 5534. 93
Attenuated total reflection (ATR-IR) Pros: Solids/powders/solutions Solid-solution interface External stimuli No prep time Accessory Monitor kinetics Cons: Pressure sensitive Less resolution Crystals are expensive 94
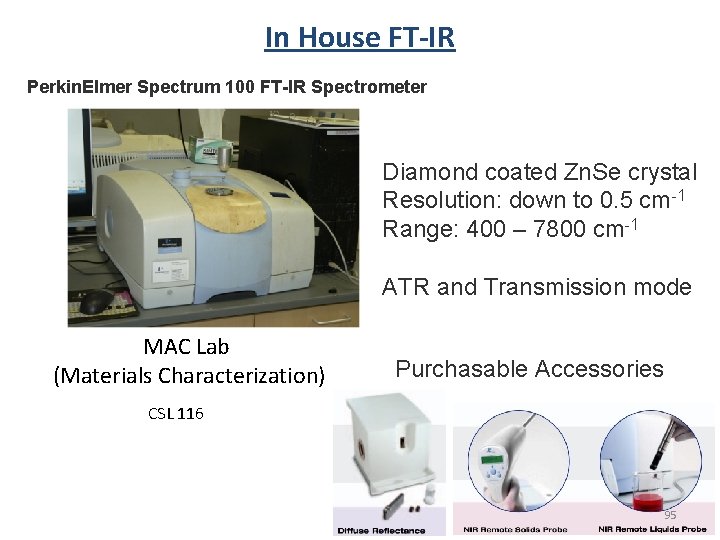
In House FT-IR Perkin. Elmer Spectrum 100 FT-IR Spectrometer Diamond coated Zn. Se crystal Resolution: down to 0. 5 cm-1 Range: 400 – 7800 cm-1 ATR and Transmission mode MAC Lab (Materials Characterization) Purchasable Accessories CSL 116 95
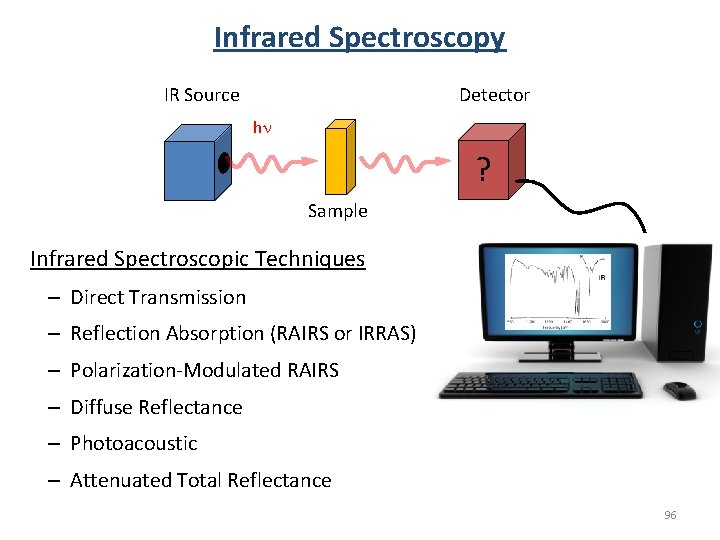
Infrared Spectroscopy Detector IR Source hn ? Sample Infrared Spectroscopic Techniques – Direct Transmission – Reflection Absorption (RAIRS or IRRAS) – Polarization-Modulated RAIRS – Diffuse Reflectance – Photoacoustic – Attenuated Total Reflectance 96
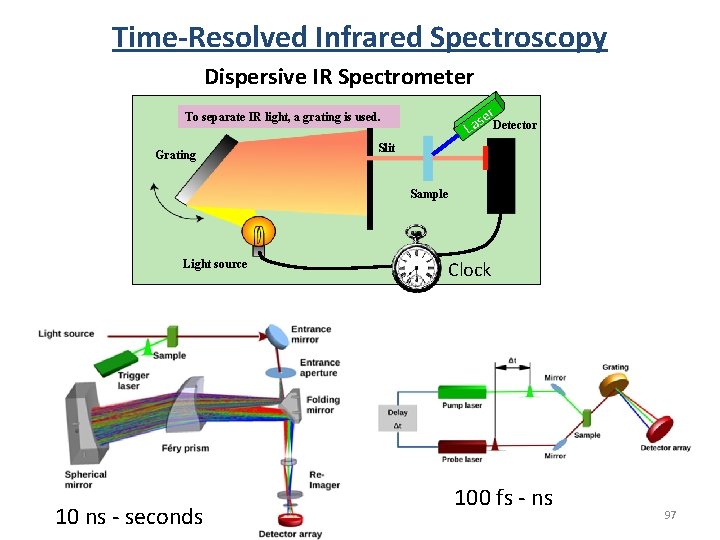
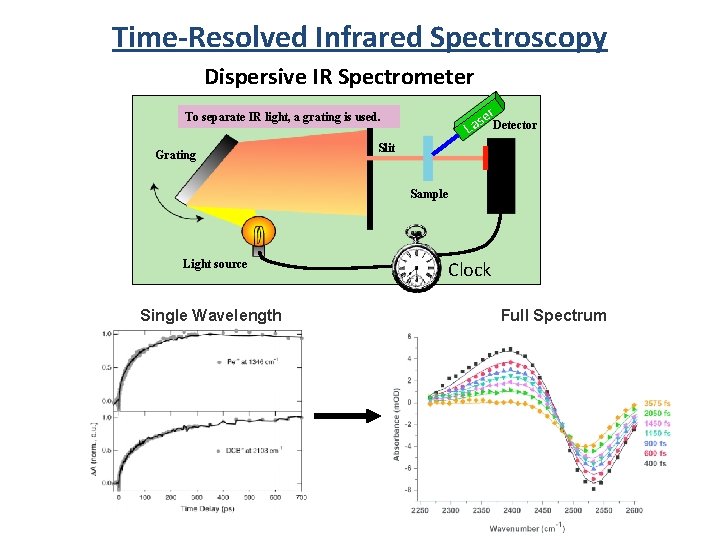
Time-Resolved Infrared Spectroscopy Dispersive IR Spectrometer er. Detector To separate IR light, a grating is used. Grating s La Slit Sample Light source 10 ns - seconds Clock 100 fs - ns 97
Time-Resolved Infrared Spectroscopy Dispersive IR Spectrometer er. Detector To separate IR light, a grating is used. Grating s La Slit Sample Light source Single Wavelength Clock Full Spectrum 98
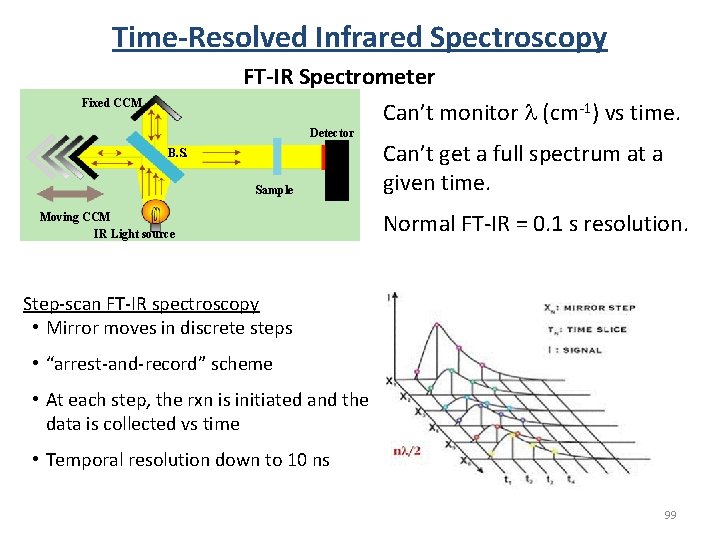
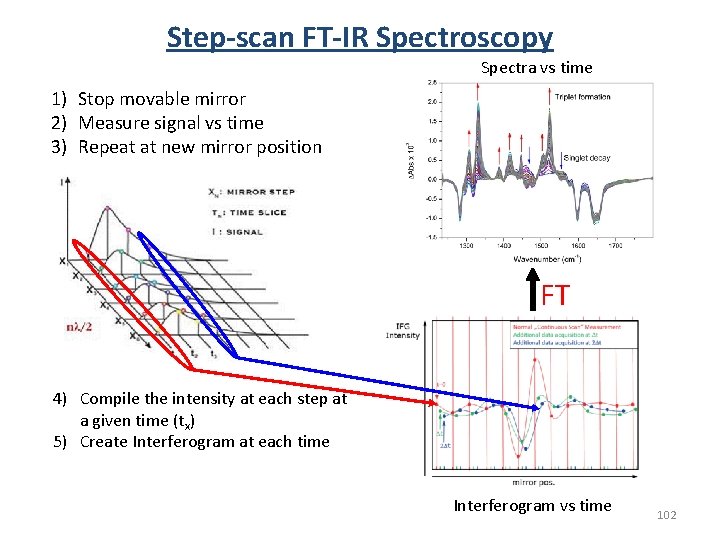
Time-Resolved Infrared Spectroscopy FT-IR Spectrometer Fixed CCM Detector B. S. Sample Moving CCM IR Light source Can’t monitor l (cm-1) vs time. Can’t get a full spectrum at a given time. Normal FT-IR = 0. 1 s resolution. Step-scan FT-IR spectroscopy • Mirror moves in discrete steps • “arrest-and-record” scheme • At each step, the rxn is initiated and the data is collected vs time • Temporal resolution down to 10 ns 99
Commercial Dispersive Time-resolved IR Spectrometer 100
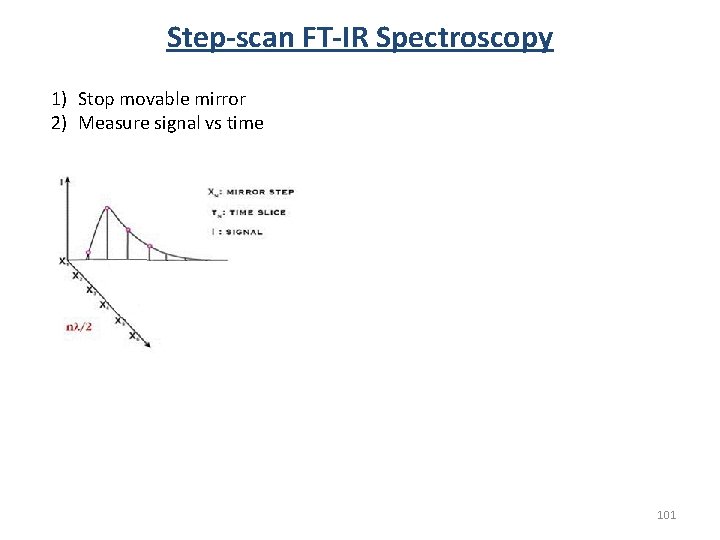
Step-scan FT-IR Spectroscopy 1) Stop movable mirror 2) Measure signal vs time 101
Step-scan FT-IR Spectroscopy Spectra vs time 1) Stop movable mirror 2) Measure signal vs time 3) Repeat at new mirror position FT 4) Compile the intensity at each step at a given time (tx) 5) Create Interferogram at each time Interferogram vs time 102
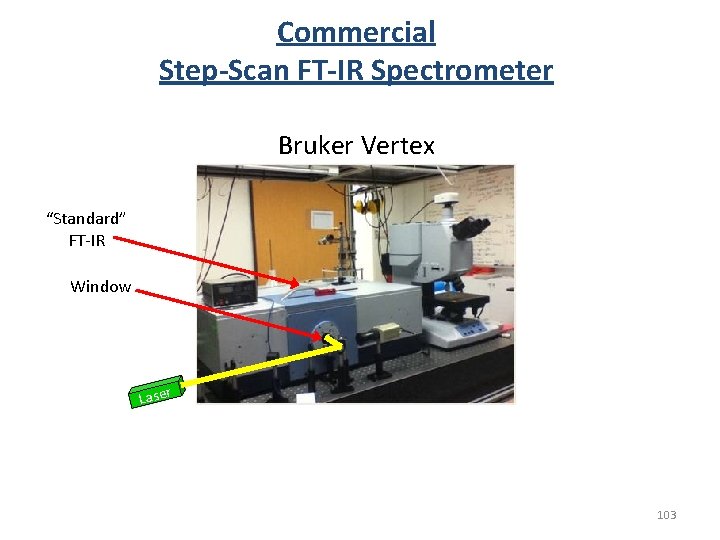
Commercial Step-Scan FT-IR Spectrometer Bruker Vertex “Standard” FT-IR Window Laser 103
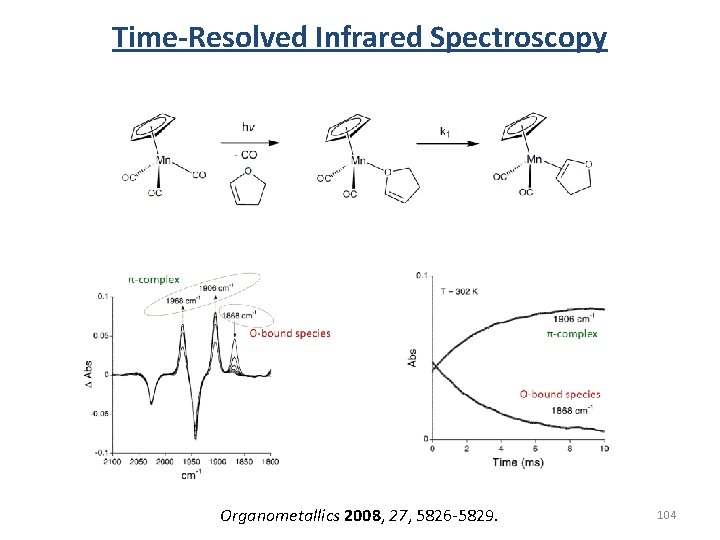
Time-Resolved Infrared Spectroscopy Organometallics 2008, 27, 5826 -5829. 104
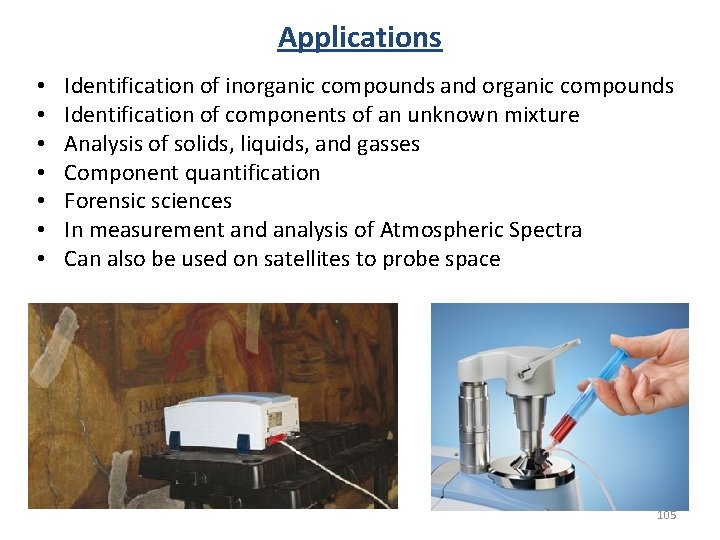
Applications • • Identification of inorganic compounds and organic compounds Identification of components of an unknown mixture Analysis of solids, liquids, and gasses Component quantification Forensic sciences In measurement and analysis of Atmospheric Spectra Can also be used on satellites to probe space 105
IR Spectroscopy End Any Questions? 106