ATOMIC EMISSION SPECTROSCOPY BASIC PRINCIPLES SUMMARY This project


ATOMIC EMISSION SPECTROSCOPY BASIC PRINCIPLES SUMMARY ___________________________________________________ This project has been funded with support from the European Commission. This publication reflects the views only of the authors, and the Commission cannot be held responsible for any use which may be made of the information contained therein.
 is a method of chemical analysis that uses")
• Atomic emission spectroscopy (AES) is a method of chemical analysis that uses the intensity of light emitted from a flame, plasma, arc, or spark at a particular wavelength to determine the quantity of an element in a sample. • The wavelength of the atomic spectral linegives the identity of the element while the intensity of the emitted light is proportional to the number of atoms of the element.

· BASED ON EMISSION SPECTRA OF ATOMS An analyte in an excited state possesses an energy, E 2, that is greater than its energy when it is in a lower energy state, E 1. When the analyte returns to its lower energy state — a process we call relaxation — the excess energy, ΔE = E 2 − E 1 is released Electron configurations for (a) a singlet ground state; (b) a singlet excited state; and (c) a triplet excited state.

The amount of time the analyte spends in the excited state — its lifetime — is short, typically 10– 5– 10– 9 s for electronic excited states and 10– 15 s for vibrational excited states. Relaxation of an analyte’s excited-state, A*, occurs through several mechanisms, including collisions with other species in the sample, by photochemical reactions, and by the emission of photons. In the first process, which is called vibrational relaxation, or nonradiative relaxation, the excess energy is released as heat. A*→ A + heat

Relaxation by a photochemical reaction may involve a decomposition reaction • A*→ X + Y or a reaction between A* and another species A*+ Z→ X + Y In both cases the excess energy is used up in the chemical reaction or released as heat. In the third mechanism, the excess energy is released as a photon of electromagnetic radiation. A*→ A +hν

The release of a photon following thermal excitation is called emission and that following the absorption of a photon is called photoluminescence. In chemiluminescence and bioluminescence, excitation results from a chemical or biochemical reaction, respectively.

• Atomic emission spectroscopy has a long history. Qualitative applications based on the color of flames were used in the smelting of ores as early as 1550 and were more fully developed around 1830 with the observation of atomic spectra generated by flame emission and spark emission. • Quantitative applications based on the atomic emission from electric sparks were developed by Lockyer in the early 1870 and quantitative applications based on flame emission were pioneered by Lundegardh in 1930. • Atomic emission based on emission from a plasma was introduced in 1964.

ATOMIC EMISSION SPECTRA • Atomic emission occurs when a valence electron in a higher energy atomic orbital returns to a lower energy atomic orbital. In the figure below it is shown the energy level diagram for sodium, which consists of a series of discrete lines at wavelengths corresponding to the difference in energy between two atomic orbitals.

• The intensity of an atomic emission line, Ie, is proportional to the number of atoms, N*, populating the excited state, Ie = k. N * • where k is a constant accounting for the efficiency of the transition. If a system of atoms is in thermal equilibrium, the population of excited state I is related to the total concentration of atoms, N, by the Boltzmann distribution. For many elements at temperatures of less than 5000 K the Boltzmann distribution is approximated as

where gi and g 0 are statistical factors that account for the number of equivalent energy levels for the excited state and the ground state, Ei is the energy of the excited state relative to a ground state energy, E 0, of 0, k is Boltzmann’s constant (1. 3807 × 10– 23 J/K), and T is the temperature in kelvin. From equation above, we expect that excited states with lower energies have larger populations and more intense emission lines. We also expect emission intensity to increase with temperature.

ATOMIC EMISSION · Two types of emission spectra: – Continuum – Line spectra · Examples: · - FP Flame photometry – ICP-OES (inductively-coupled plasma optical emission spectroscopy), also known as ICPAES – LIBS (laser-induced breakdown spectroscopy)

• The number of spectral lines in atomic emission spectroscopy is dependent on two main factors: • 1 -the energy of excitation source • 2 - nature of the element. The higher the excitation energy of the source the larger the number of the excited electronic levels populated by the electrons, resulting in greater number of spectral lines.

FLAME PHOTOMETRY

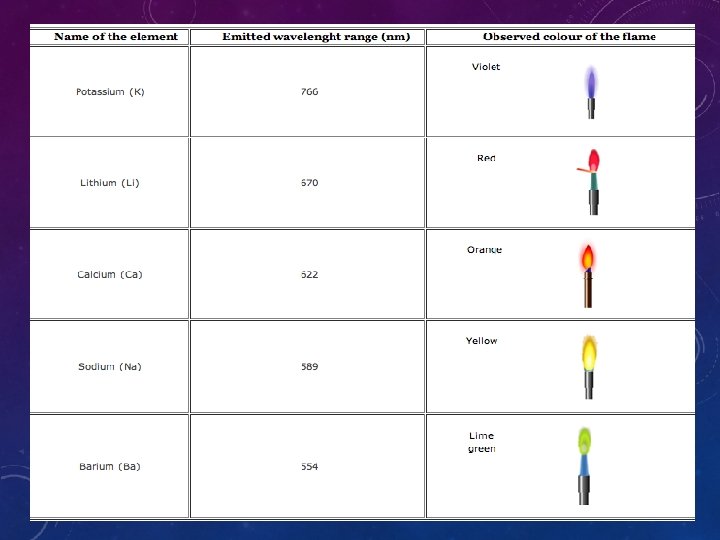
INTRODUCTION • 1 -flame photometry, a branch of atomic spectroscopy is used for determining the concentration of certain metal ions such as sodium, potassium, lithium, calcium, Cesium, etc. • 2 -The basis of flame photometric working is that, the types of metals are dissociated due to thermal energy provided by the flame source. Due to this thermal excitation, some of the atoms are excited to a higher energy level where they are not stable. • 3 -The subsequent loss of energy will result in the movement of excited atoms to the low energy ground state with emission of some radiations as a wavelengths. The emitted wavelengths are specific for specific elements
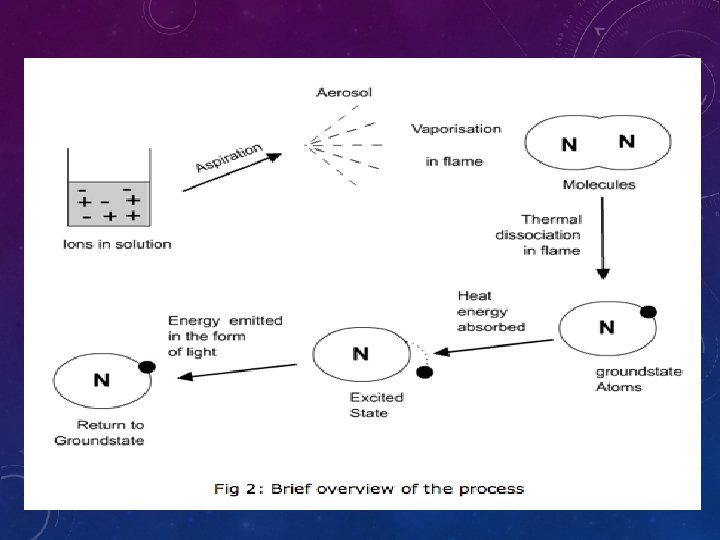

• 1. The solution containing metal to be measure is first aspirated into the burner. • 2. The solvent then evaporated leaving fine divided solid particles. • 3. This solid particles move towards the flame, where the gaseous atoms and ions are produced.

• 4. The ions absorb the energy from the flame and excited to high energy levels. • 5. When the atoms return to the ground state radiation of the characteristic element is emitted. • 6. The intensity of emitted light is related to the concentration of the element.

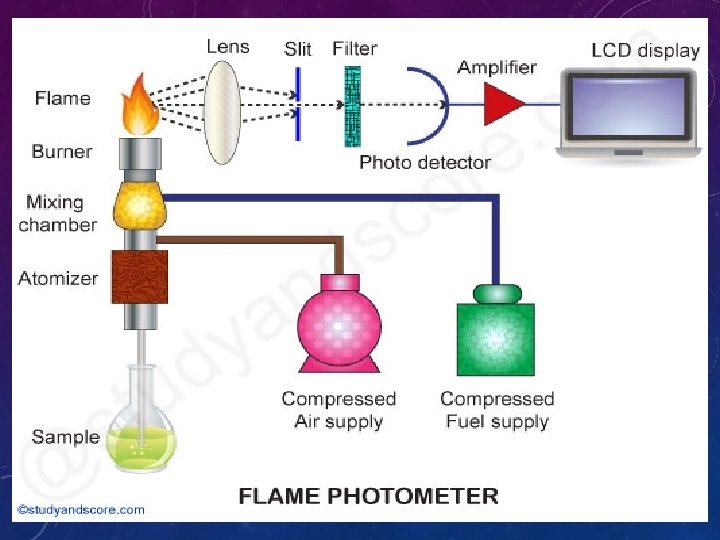
FP COMPONENTS • 1 - Flame : A burner that provides flame and can be maintained in a constant form and at a constant temperature. • 2 - Nebuliser and mixing chamber: Helps to transport the homogeneous solution of the substance into the flame at a steady rate. • 3 - Monochromator : helps in isolating the wavelength to be measured from that of any other extraneous emissions.

• 4. Photo detector: • Detect the emitted light and measure the intensity of radiation emitted by the flame. That is, the emitted radiation is converted to an electrical signal with the help of photo detector. The produced electrical signals are directly proportional to the intensity of light.
 v Burner used in FP should have the following properties: - The")
Flame (burner) v Burner used in FP should have the following properties: - The flame should have ability to evaporate the solvent to give a residue(deposit) - It should convert this residue to gases state atom and finally into individual atoms

v The effect of flame depend on the temperature of flame and this temperature can be monitored by following method: - Fuel to air ratio - Type of solvent for preparing sample solution - Amount of solvent which is entering to flame - Type of burner used in FP
 • Flame photometry employs a variety of fuels mainly air, oxygen or")
FLAME (BURNER) • Flame photometry employs a variety of fuels mainly air, oxygen or nitrous oxide (N 2 O) as oxidant. • Burners are of two types: Total Consumption Burner and Premix or Laminar flow Burner.

The various processes in the flame are discussed below: • Desolvation: The liquid solvent is evaporated, and the metal particles are dehydrated by the flame • Vapourisation: The sample vaporises to a gas. • Atomization: Reduction of metal ions in the solvent to metal atoms by the flame heat.

• Excitation: The electrostatic force of attraction between the electrons and nucleus of the atom helps them to absorb a particular amount of energy. The atoms then jump to the exited energy state. • Emission process: Since the higher energy state is unstable the atoms jump back to the stable low energy state with the emission of energy in the form of radiation of characteristic wavelength, which is measured by the photo detector.

TYPES OF FP • 1 - Direct type: Standard solution of Na & K are atomised or aspirated into flame to provide a series of meter readings in which our unknown is going to compared with.

DIRECT TYPE DISADVANTAGES • 1 - Any minor fluctuations in air, gas pressure might change response of instrument and then cause errors. • 2 - Separate analyses and sometimes separate solutions must be made for Na and K.
 is added to all")
• 2 - Internal standard method: Another element (Li) is added to all standards, blanks and unknowns in equal concentration. This element has a criteria of : • high emission intensity. • Is absent from biological fluid.

APPLICATIONS • 1 - Determine the availability of alkali and alkaline earth metals which are critical for soil cultivation. • 2 - In agriculture, the fertilizer requirement of the soil is analyzed by flame test analysis of the soil.

• 3 - In clinical field, Na+ and K+ ions in body fluids, muscles and heart can be determined by diluting the blood serum and aspiration into the flame. • 4 - Analysis of soft drinks, fruit juices and alcoholic beverages can also be analyzed by using flame photometry.

Advantages: 1. Simple quantitative analytical test based on the flame analysis. 2. Inexpensive. 3. The determination of elements such as alkali and alkaline earth metals is performed easily with most reliable and convenient methods. 4. Quite quick, convenient, and selective and sensitive to even parts per million (ppm) to parts per billion (ppb) range.

• FP suffer the same level of interferences as AAS from: • 1 - Anion due to complexation (chemical interference). • 2 - Matrix interference. • 3 - Burner interference. • 4 - Ionisation interference. • 5 - emission interference.

LIMITATIONS • Alteration of light emission because of altered flame temp. • It needs perfect control of flame temperature. • Interference by other elements is not easy to be eliminated • Heavy and transition metals , the number of absorption and emission lines is enormous and the spectra are complex • Inadequate selectivity of WL. • Differences in viscosity between standards and sample.

ADVANTAGES OF AAS OVER FP • 1 - Sensitivity. • 2 - Applicability. • 3 - Smaller flame effect. • 4 - Less interference from other cations.

AAS VS PF

Working procedure • Both the standard stock solution and sample solution are prepared in fresh distilled water. • The flame of the photometer is calibrated by adjusting the air and gas. Then the flame is allowed to stabilize for about 5 min. • Now the instrument is switched on and the lids of the filter chamber are opened to insert appropriate colour filters. • The readings of the galvanometer are adjusted to zero by spraying distilled water into the flame. • The sensitivity is adjusted by spraying the most concentrated standard working solution into the flame. Now the full scale deflection of the galvanometer is recorded.

• Again distilled water is sprayed into the flame to attain constant readings of galvanometer. Then the galvanometer is readjusted to zero. • Now each of the standard working solutions is sprayed into the flame for three times and the readings of galvanometer are recorded. After each spray, the apparatus must be thoroughly washed. • Finally sample solution is sprayed into the flame for three times and the readings of galvanometer are recorded. After each spray, the apparatus must be thoroughly washed. • Calculate the mean of the galvanometer reading. • Plot the graph of concentration against the galvanometer reading to find out the concentration of the element in the sample.

INDUCTIVELY COUPLED PLASMA— ATOMIC EMISSION SPECTROMETRY • Introduction • Greenfield et al. developed plasma-based instruments in the mid 1960 s about the same time flame-based instruments such as FAAS and FAES became prominent. These first plasma-based instruments used direct current (DC) and microwave-induced (MI) systems to generate the plasma. Interference effects and plasma instability limited the utility of plasma instruments during analysis; consequently flame-based spectrometry instruments (such as FAAS) dominated the analytical market for metals analysis and remain effective today.

• The limitations of the first plasma instruments were overcome by utilizing an inductively coupled plasma (ICP) instead of DC or MI generated plasma. ICP optical systems became popular in the 1980 s due to their decreased cost, lower time investment during analysis, and labor saving advantages. FAAS/FAES instruments require a unique radiation source (lamp) for the approximately 35 elements they can measure. • Because the lamp must be changed between each element of interest, FAAS/FAES techniques analyze a single element at a time and are unable to easily analyze metalloids. • ICP optical systems, by contrast, can analyze about 60 different elements at the same time with a single source (the plasma). The most common instruments today are inductively coupled plasma—atomic emission spectrometers (ICP-AES) and inductively coupled plasma—mass spectrometers (ICP-MS).

• In plasma-based systems the temperature is considerably hotter (~6000 to 10 000 K) that results in more effective excitation of atoms (generally greater then 90%) of approximately 60 elements including some nonmetals. This intense heat prevents polyatomic species from forming, thus increasing the detection limits for many elements. Atoms are excited, and in many cases ionized, by the intense heat of the plasma, and the emission of a photon occurs via resonance fluorescence (normal valance electron relaxation by photon emission). • While plasma-based systems eliminate many problems, they are not free of interferences due to the excitation and subsequent emission of spectral lines for every element in the sample as well as the Ar added to facilitate plasma generation. The spectral overlay that results from these possible emissions is overcome in modern instruments with specialized sequential monochromators

• ICP-AES, compared to FAAS/FAES, offers high selectivity between elements, high sensitivity, a large dynamic range, especially as compared to FAAS that is limited by Beer’s law, lower detection limits, multi-element detection, and fewer matrix interferences.
")
• Components of an Inductively Coupled Plasma— Atomic Emission • Spectrometry System (ICP-AES)

• An ICP-AES system can be divided up into two basic parts; - the inductively coupled plasma source and - the atomic emission spectrometry detector. • The inductively coupled plasma source has mostly been unchanged since its invention with the exception of innovation in monochromator type, which enables greater suppression of interference phenomena.

THE PURPOSE OF THE PLASMA e. Ionization : Electron Loss Excitation : Emission Atomization : Dissociation Vaporization : Particles to gas Desolvation : Drying Droplets

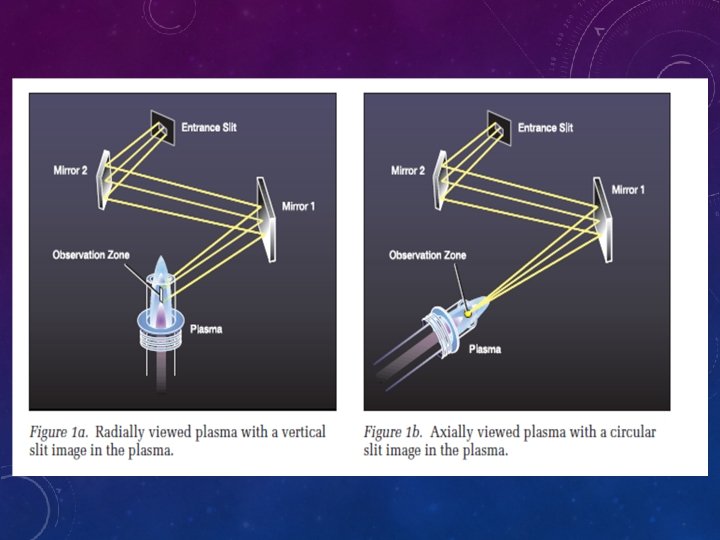
RADIAL EMISSION Low Energy Required Long Wavelengths K, Cs, La, Li, Na, Sr Med Energy Required (NAZ) Mn Compromise High Energy Required Short Wavelengths As, Se

• The sample is introduced to the nebulizer chamber via a peristaltic pump and tygon tubing attached to an automatic sampler. A peristaltic pump operates by sequentially compressing flexible tubing with evenly spaced and rotating rollers that pull/push the liquid through the system. • The rate of sample introduction into the plasma changes as the rotation rate of the peristaltic rollers increases or decreases. Flow of sample and Ar gas through the small aperture of the nebulizer creates very small droplets that form a mist of μm-sized particles in the nebulizer chamber. • Larger sample droplets collect on the chamber walls and are removed through a drain, while smaller particles travel with the Ar flow and enter the torch.

• Evaporation, atomization, and excitations/ionizations occur in the plasma at temperatures reaching 10 000 K. Ar not related to the sample is also excited and ionized because this gas both carries the sample aerosol and confines the location of the plasma to prevent damage to the rest of the instrument. • As the excited/ionized atoms leave the hot portion of the plasma, excited valence electrons relax and emit a photon characteristic of the electron transition. This photon is specific to the element but does not yield any information about the isotopic state of the element, unlike in mass spectrometry.

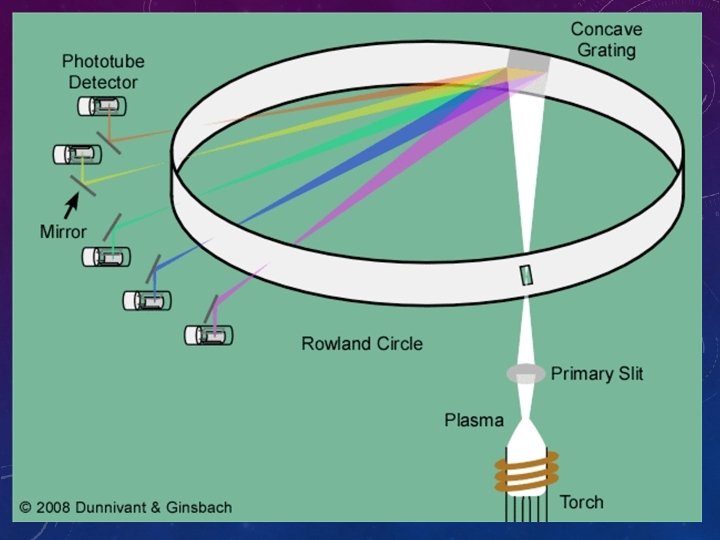
• Visible and UV radiation emitted from the sample constituents enters the monochromator through a small slit where the wavelengths are separated by grating(s) and/or prism(s) before being captured and measured by a wide variety of detectors. • Because spectral interferences may still occur, the choice and configuration of the monochromators in the instrument is important and has been the target of innovation. In the Figure, the most common form of a monochromator (a Rowland circle) and detector (photomultiplier; PMT) is shown:

• The Rowland system utilizes a concave Echellette-style grating monochromator to separate the various emission lines and simultaneously focus individual wavelengths on to a series of slits, with each slit aligned to allow a specific wavelength of radiation to pass to a detector. • Some systems use multiple PMTs at fixed locations to monitor each wavelength simultaneously whereas other systems use a single PMT and move it to different locations to detect each wavelength. Data from these detectors are processed by a computer because multiple wavelengths are measured in an ICP-AES system at the same time

DETECTORS IN ICP-AES

ICP-MS • Mass spectrometry method: detects ions distinguished by their mass -to-charge ratio (m/z value) • Based on ions moving under influence of electrical or magnetic field èMass analysers generally require operation under vacuum, to avoid ions colliding with other particles • Recommended series of short articles: Robert Thomas: A beginner’s guide to ICP-MS

ICP-MS INSTRUMENTATION AND PRINCIPLE Detector Plasma generates Under vacuum (e. g. positive ions electron multiplier) nebuliser Interface Spray chamber sample Sorted by mass analyser, e. g. quadrupole, magnetic sector, according to m/z ratio http: //www. cee. vt. edu/ewr/environmental/teach/smprimer /icpms. htm
 ICP Torch Cones and Ion")
ICP-MS instrumentation Sampling cone Collision cell Detector (discrete dynode) ICP Torch Cones and Ion Optics Skimmer cone Mass Analyser: Quadrupole 58 Modern instrument with collision/reaction cell

RECAP: ION FORMATION IN AN INDUCTIVELY-COUPLED PLASMA • Mostly, singly charged positive ions are generated (>90% efficiency)

INTERFACE AND ION OPTICS Room temperature, vacuum 6000 K, ambient pressure ICP torch • Major challenge in instrumentation: large differences in temperature and pressure. Interface (consisting of two cones) allows connecting ion source to mass analyser (requires vacuum) • Lens focuses ions. Necessary for getting as many ions as possible into analyser (maximising signal)

MASS ANALYSERS FOR ICP-MS • Quadrupole: High mass stability, fast • Lowest cost option • Time-of-Flight (rare) • HR (High-resolution): Uses magnetic sector mass analyser • Highest sensitivity and resolution, but slow and requires stable working environment • Expensive • Multi-collector (MD): Also with magnetic sector, but with detector array • Good for accurate and precise isotope ratios • Isotope dilution measurements – e. g. for accurate elemental ratios

QUADRUPOLE MASS ANALYSER n n n Four parallel metal rods with dc and ac voltage (alternating with radiofrequency) Works as mass filter: allows passage of particular m/z ions only Can scan over m/z range spectrum

ATOMIC MASS SPECTRA Ray and Hieftje, J. Anal. At. Spectrom. , 2001, 16, 1206 -1216 http: //www. wcaslab. co m/tech/tbicpms. htm

TYPICAL DETECTION LIMITS OF ICP-MS INSTRUMENT http: //las. perkinelmer. co. uk/content/Technical. Info/TCH_ICPMSThirty. Minute. Guide. pdf

POSSIBLE FACTORS THAT CAN AFFECT THE PERFORMANCE OF ICP-MS • Variations in plasma ionization efficiency • Possible clogging or corrosion of cone apertures • Differing concentrations of other components in matrix (e. g. acid, bulk elements) in samples could result in matrix suppression • Ion current influenced by matrix composition • Temperature and humidity fluctuations in the laboratory environment • Isobaric elemental and polyatomic interferences: Used to be greatest limitation for applicability

POLYATOMIC INTERFERENCES IN ICP-MS: ORIGINS • Spectral interference: caused by presence of species with same mass as analyte • Often derived from compounds with Ar Analyte Interference 39 K+ 38 Ar 1 H+ 40 Ca+ 40 Ar+ 51 V+ 35 Cl 16 O+ 52 Cr+ 40 Ar 12 C+ 56 Fe+ 40 Ar 16 O+ 63 Cu+ 23 Na 40 Ar+ 75 As+ 40 Ar 35 Cl+ 80 Se+ 40 Ar + 2
 • Various modes of action: •")
OVERCOMING POLYATOMIC INTERFERENCES: • Collision/reaction cells (CRC technology) • Various modes of action: • Collision-induced dissociation (less important) • Chemical reaction (major mechanism) Requires reactive gas • Electron transfer (major mechanism) • KED: kinetic energy discrimination (monoatomic analyte and interfering molecules are retarded differently) • Can either affect analyte or interference • Commonly used gases: He, H 2, ammonia http: //breeze. thermo. com/collis ioncells/ (Webinar)

POLYATOMICS AND HIGH-RESOLUTION ICP-MS • also no problem with polyatomics, as there are small, resolvable differences in mass: 31 P 16 O 14 N 16 O 1 H 15 N 16 O 30. 95 31. 00 Mass (u) 32 S 31. 95 32. 00

STABLE ISOTOPES AND THEIR USES • Most elements have more than one isotope • E. g. 32 S and 34 S, or 56 Fe and 57 Fe • Can use more than one mass for one element for measurements in ICP-MS • IDSM: Isotope dilution mass spectrometry: Use particular isotope of desired analyte as internal standard in ICP-MS • Can buy enriched compounds, e. g. 67 Zn. O, and use as “tracers”
 • Are")
EXAMPLE FOR USE OF STABLE ISOTOPES • Metal-binding protein with 4 Zn(II) • Are all four zinc ions exchangeable ? • Isolated with natural abundance Zn(II): % 60 50 40 67 Zn: 4. 1% 30 20 10 Isotope 0 64 66 67 68 70 • Incubated overnight at 37°C with 40 mol equivalents of 67 Zn(II) (93% isotopic purity) • Measured isotopic ratios
 As measured")
COMPARISON OF EXPERIMENTAL AND CALCULATED ISOTOPIC RATIOS Calculated for 4 exchanging Zn(II) As measured Calculated for 3 exchanging Zn(II) 66/64 67/64 68/64 70/64 è For each isotopic ratio, results agree best with the scenario for 3 exchanging zinc: Clear demonstration that only 3 out of 4 Zn exchange: è The protein has one zinc that is inert towards exchange

ICP-MS AND HYPHENATION • • ICP-MS can be coupled with a variety of separation techniques: Liquid chromatography HPLC-ICP-MS Capillary electrophoresis CE-ICP-MS Advantages of hyphenated techniques: • better control over matrix • Allows separation of different components: direct access to speciation • Laser ablation LA-ICP-MS • For surface analysis • For materials that are difficult to digest (e. g. alloys) • Is being developed in scanning fashion with mm spatial resolution: Imaging the metal composition of a material • Caveat: Calibration ?

LASER ABLATION Useful for surface analysis of solid samples monitor camera Laser UV light Carrier gas in To ICP sample

THE ABLATION PROCESS Plume of molecules and ions from a surface hit by a laser http: //kottan-labs. bgsu. edu/pictures/

COMPARISON: AAS, ICP-OES, AND ICP-MS • AAS: Single element, ppm/ppb range • Cheap, simple • Small dynamic range • GFAAS about 100 times more sensitive than FAAS, but also more challenging • ICP-OES: Multi-element, ppb range • Limited spectral interferences, good stability, low matrix effects • ICP-MS: Multi-element, possible to reach ppt (or even ppq) • Most complex, most expensive, lowest detection limits, isotope analysis possible

COMPARISON: DETECTION LIMITS AND WORKING RANGES http: //pubs. acs. org/hotartcl/tcaw/99/oct/ele

SYNOPSIS: INTERFERENCES IN ATOMIC SPECTROSCOPY Technique Type of Interference Flame Ionization AAS Chemical Physical Graphite Furnace AAS Physical and chemical Molecular absorption Spectral ICP-OES Spectral Matrix ICP-MS Spectral Matrix Method of Compensation Ionization buffers Releasing agent or nitrous oxide-acetylene flame Dilution, matrix matching, or method of additions Spectral Standard Temperature Platform Furnace (STPF), conditions, standard additions Zeeman or continuum source background correction Zeeman background correction Background correction or the use of alternate analytical lines Internal standardization Inter-element correction, use of alternate masses, higher resolution systems or reaction/collision cell technology Internal standardization http: //pubs. acs. org/hotartcl/tcaw/99/oct/table 1. html

A technique decision matrix Exercise: How is this decision matrix correlated with strengths and limitations of the various techniques ? http: //las. perkinelmer. com/c ontent/relatedmaterials/bro chures/bro_atomicspectrosc opytechniqueguide. pdf
 in")
OTHER INORGANIC MASS SPECTROMETRY METHODS • Mainly for surface analysis (depth profiling, imaging) in different materials (e. g. conducting, semiconducting, and nonconducting solid samples; technical, environmental, biological, and geological samples) • Spark source mass spectrometry (SSMS) • Glow discharge mass spectrometry (GDMS) • Laser ionization mass spectrometry (LIMS) • Thermal ionization mass spectrometry (TIMS) • Secondary ion mass spectrometry (SIMS): most sensitive elemental and isotopic surface analysis technique • Sputtered neutral mass spectrometry (SNMS) • Detection limits for the direct analysis of solid samples by inorganic solid mass spectrometry: down to ppb levels

SIMS: secondary ion mass spectrometry n n n n n One of the most widespread surface analysis techniques for advanced material research Principle: bombard surface with ions, “secondary” ions are sputtered from surface High sensitivity for all elements Any type of material that can stay under vacuum (insulators, semiconductors, metals) Potential for high-resolution imaging (down to 40 nm) Very low background: high dynamic range (more than 5 decades) Quantitative work complicated by variations in secondary ion yields in dependence on chemical environment and the sputtering conditions (ion, energy, angle) Rapid deterioration of bombarded surface Static SIMS: Molecular and elemental characterisation of top monolayer • Dynamic SIMS: Bulk composition or depth distribution of trace elements. Depth resolution ranging from one to 20 -30 nm
- Slides: 80