IR Infrared Spectroscopy Infrared spectroscopy IR spectroscopy is

 is the spectroscopy that deals with the infrared region of")
 involves the interaction of infrared radiation with")

 Stretching deformation: It is a vibrational")


- Slides: 8
IR Infrared Spectroscopy
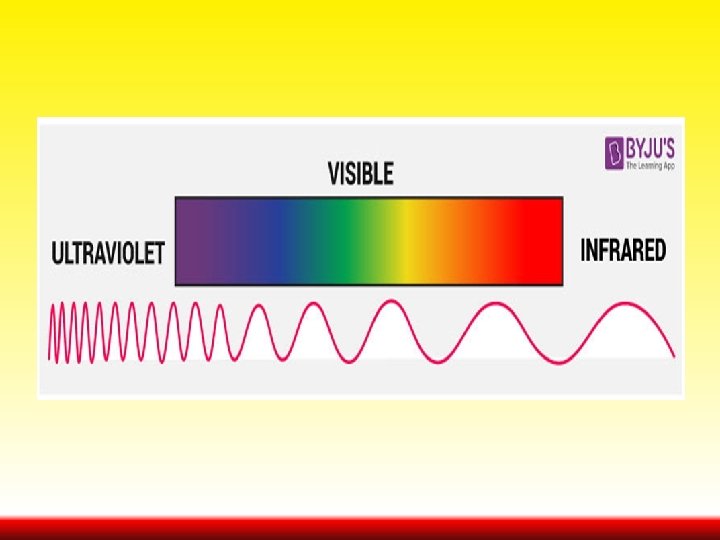
Infrared spectroscopy (IR spectroscopy) is the spectroscopy that deals with the infrared region of the electromagnetic spectrum, that is light with a longer wavelength and lower frequency than visible light. It covers a range of techniques, mostly based on absorption spectroscopy. As with all spectroscopic techniques, it can be used to identify and study chemicals. A common laboratory instrument that uses this technique is a Fourier transform infrared (FTIR) spectrometer. The IR spectroscopy theory utilizes the concept that molecules tend to absorb specific frequencies of light that are characteristic of the corresponding structure of the molecules.
Infrared spectroscopy (IR spectroscopy or vibrational spectroscopy) involves the interaction of infrared radiation with matter. It covers a range of techniques, mostly based on absorption spectroscopy. As with all spectroscopic techniques, it can be used to identify and study chemical substances. Samples may be solid, liquid, or gas. The method or technique of infrared spectroscopy is conducted with an instrument called an infrared spectrometer to produce an infrared spectrum. Typical units of frequency used in IR spectra are wave numbers, with the symbol cm− 1. Units of IR wavelength are commonly given in micrometers (formerly called "microns"), symbol μm, which are related to wave numbers in a reciprocal way. A common laboratory instrument that uses this technique is a Fourier transform infrared (FTIR) spectrometer. Two-dimensional IR is also possible.
The infrared portion of the electromagnetic spectrum is usually divided into three regions; the near- (0. 75 - 2. 5 μm , mid- (2. 5 - 16 μm ) and far- infrared (25 - 1000 μm), named for their relation to the visible spectrum. The higher-energy near-IR, approximately 14000– 4000 cm− 1 (0. 7– 2. 5 μm wavelength) can excite overtone or harmonic molecular vibrations. The mid-infrared, approximately 4000– 400 cm− 1 (2. 5– 25 μm) may be used to study the fundamental vibrations and associated rotational-vibrational structure. The farinfrared, approximately 400– 10 cm− 1 (25– 1000 μm), lying adjacent to the microwave region, has low energy and may be used for rotational spectroscopy. The names and classifications of these subregions are conventions, and are only loosely based on the relative molecular or electromagnetic properties. IR Spectroscopy detects frequencies of infrared light that are absorbed by a molecule. Molecules tend to absorb these specific frequencies of light since they correspond to the frequency of the vibration of bonds in the molecule.
There are two types of vibrational motions: A) Stretching deformation: It is a vibrational motion of a bond along the bond axis within a molecule (Ʋ). B) Bending deformation: It is a vibrational motion of a bond perpendicular to the bond axis within a molecule (δ). Normal modes: A molecule can vibrate in many ways, and each way is called a vibrational mode. Linear molecules have 3 N - 5 degrees of vibrational modes whereas nonlinear molecules have 3 N - 6 degrees of vibrational modes (also called vibrational degrees of freedom). As an example H 2 O, a non-linear molecule, will have 3 × 3 - 6 = 3 degrees of vibrational freedom, or normal modes.
IR Spectroscopy Instrumentation The instrumentation of infrared spectroscopy is illustrated below. First, a beam of IR light from the source is split into two and passed through the reference ant the sample respectively. Now, both of these beams are reflected to pass through a splitter and then through a detector. Finally, the required reading is printed out after the processor deciphers the data passed through the detector.
Graph of the IR spectrum Given below is a sample of typical Infrared Absorption Frequencies.