Atomic Absorption Spectroscopy AAS Sebastian Guzman History It
 Sebastian Guzman")
Atomic Absorption Spectroscopy (AAS) Sebastian Guzman

History It was first observed in 1802 with the discovery of the Fraunhofer lines in the sun’s spectrum. In 1953 Australian physicist Sir Alan Walsh showed it could be used as a quantitative analytical tool.

What is it? Atomic absorption measures the amount of energy (in the form of photons of light, and thus a change in wavelength) absorbed by the sample. A detector compares the wavelengths transmitted by the sample with the wavelengths before they passed through the sample. Atoms have distinct patterns of wavelengths because of their unique configurations of the outer shells. Concentrations are in mg/L or ppm. So sensitive it can measure parts per billion (µg dm-3)

Elements detectable by atomic absorption are pink

Where is it used? Used in clinical analysis to analyze metals in blood or urine. Used in environmental analysis to find the concentration of metal in our rivers, seawater, drinking water, and air. Used in pharmaceuticals to determine the amount of catalyst that is left over in the final product. Used in mines to determine the amount of gold in rocks.
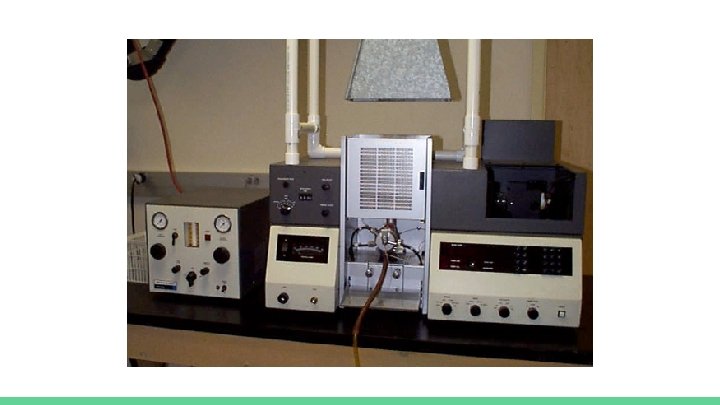
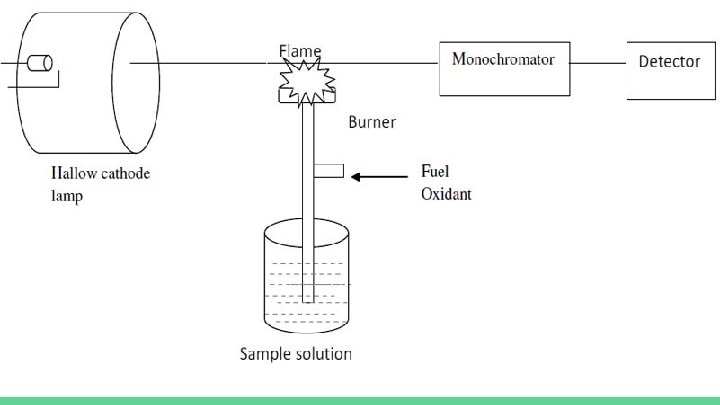

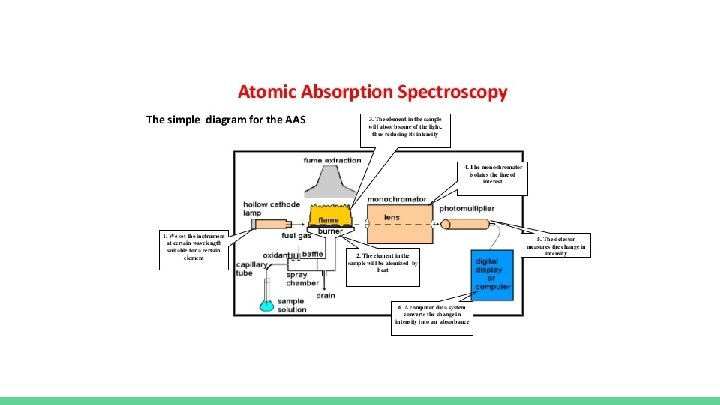
How it works In flame AAS a nebulizer is used to aspirate the sample into the flames. The light beam is generated by a hollow-cathode lamp that uses excited atoms of the same element being analyzed to produce the light. This is so that the energy being radiated corresponds directly to the wavelength being absorbed by the atomized sample. The lamp must be aligned so that it crosses the hottest part of the flame. The light that passes through the flame goes into a monochromator which is set to accept and transmit radiation at a specified wavelength. Then it travels into the detector which measures the intensity of the beam of light. When light hits metal in the solution the detector records that as absorption.

How it works The absorption is then shown on the output device by the data system.

Nebulizer A sample passes through a nebulizer to become an aerosol. It is then mixed with fuel and passed through a series of baffles to remove the larger mist. Back

Hollow-Cathode Lamp Inside is a cathode made of the element of interest with a low internal pressure of an inert gas. A low electrical current is passed through so that the metal becomes excited and a few spectral lines characteristic of the element are emitted. It then comes out of a window. Back

Monochromator It separates spectral line of interest from others spectral lines with different wavelengths emitted by the hollow-cathode lamp. The wavelength that exits depends on the grating. Back

Detector The monochromator receives light from the hollow-cathode lamp through the flame together with the light emitted from the flame. The light from the flame emission will be rejected and only that from the hollow-cathode lamp will be accepted. The current output corresponds to the intensity of light falling on the photocade. Back

Output Device Output devices like the Model 460 have a digital display that provides a direct readout of absorbance values. Some models find the line of best fit using the standard solutions to output the concentration instead of the absorbance.

Calibration Curve In order to tell how much of a sample is present you have to establish a basis for comparison of known concentrations. As the concentration of the atom increases the absorption will also increase proportionally. After running a series of known concentrations and recording their absorbance you can draw a best fit line between all the points. This line can then be used to find the concentration of the substance of unknown concentration.

Example #1

Example #2

Example #3
 can be used to determine the lead concentration")
Practice Problems Atomic Absorption Spectroscopy (AAS) can be used to determine the lead concentration in soil collected from the side of a road. A student prepared standard lead solutions for comparison and the absorbance of each solution was measured. A road-side soil sample was also prepared.
 Absorbance Blank 0. 00 Standard 1 1. 00 0. 17 Standard")
Sample Concentration (ppm) Absorbance Blank 0. 00 Standard 1 1. 00 0. 17 Standard 2 2. 00 0. 34 Standard 3 3. 00 0. 48 Standard 4 4. 00 0. 65 Standard 5 5. 00 0. 83 Sample ? 0. 58 1) Plot the data points. 2) FInd a line of best fit. 3) Find the unknown concentration.

Line of best fit

Answer Using the line of best fit you can find the unknown concentration. y = 0. 16371 x + 0. 002381 0. 58 = 0. 16371 x + 0. 002381 x = 3. 50 The concentration of the sample is 3. 50 ppm.

Resources http: //www. ausetute. com. au/aas. html http: //web. nmsu. edu/~esevosti/report. htm http: //wps. pearsoned. com. au/wps/grader http: //www. liskeard. cornwall. sch. uk/images/Liskeard-Sixth-Form/Atomic-Absorption. Spectrometry. pdf
- Slides: 24