Introduction to Spectrophotometry Spectroscopy Is the study of


- Slides: 25

Introduction to Spectrophotometry

Spectroscopy Is the study of the interaction of light & matter n Spectrophotometer – instrument that uses electromagnetic radiation from UV, visible or IR to analyze the absorption or transmission of a sample n We will use visible in our lab n

Properties of Light n Electromagnetic waves radiation moves in

Electromagnetic Spectrum

Electromagnetic Spectrum

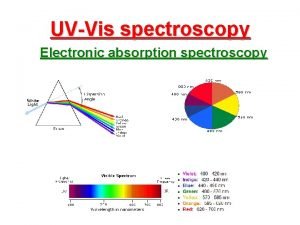
Colors & Wavelengths Visible Light COLOR WAVELENGTH (λ in nm) Ultraviolet < 380 Violet 380 – 435 Blue 436 – 480 Greenish-blue 481 – 490 Bluish-green 491 – 500 Green 501 – 560 Yellowish-green 561 – 580 Yellow 581 – 595 Orange 596 – 650 Red 651 – 780 Near Infrared > 780

What is Colorimetry? n The solutions of many compounds have characteristic colors. n The intensity of such a color is proportional to the concentration of the compound.

What are Spectroscopy and Spectrophotometry? ? n Light can either be transmitted or absorbed by dissolved substances n Presence & concentration of dissolved substances is analyzed by passing light through the sample n Spectroscopes measure electromagnetic emission n Spectrophotometers measure electromagnetic absorption

Instruments of Measurement Two most common: 1. Visible Spectrophotometer n n Spect 20, Spect 88 n Uses Xe or W lamps as light sources n Glass cuvettes hold the sample 2. Atomic-Absorption Spectrophotometer

Instruments of Measurement n What do visible spectrophotometers measure? – Amount of light absorbed by the dissolved substance – Qualitative – color gives info about the solution composition – Quantitative – provides numerical data for the concentration

Absorption of Light n White light – All colors – Polychromatic light

Absorption of Light n Monochromatic light – Light of one color Monochromator-spreads out light into its component wavelength Red light is absorbed by the green solution

The Spectrophotometer

Success of spectrophotometry… Requires sample to absorb light differently to the other chemicals in the solution n How is the correct wavelength selected? – The amount of light absorbed depends on the energy difference between 2 electron energy levels – Optimum wavelength for spectrophotometric analysis is selected by measuring the visible spectrum of the substance – This is done by plotting absorbance (A) versus wavelength (λ) n

Food Dyes Only 7 dyes are approved by the FDA for use in foods, drugs & cosmetics n All artificial food colors are mixtures of these 7 dyes n We will be using FD&C Blue in this lab n

n n n A solution containing this dye is blue in white light The colors absorbed by solution are complementary to the transmitted color Blue solution absorbs yellow, orange, & red light So expect dye solution to peak at 580 – 650 nm Optimum wavelength is determined from wavelength of max. absorption λmax = 630 nm for Blue 1 This is given for the blue solution but you will have to claculate this for the red FD&C Blue 1

Wavelength of light absorbed: Is related to electronic structure of substance n Intensity of light absorbed depends on the concentration of solution n More concentrated, the more intense color & the greater intensity of light absorbed n When light is absorbed, the radiant power (P) of light beam decreases n

Transmittance (T) This is the fraction of incident light (P/Po) that passes through the sample n T=P Po n Po = intensity of “blank” n Blank – is solution identical to sample but without solute n

Definitions & Symbols n Intensity (I) n Transmittance (T) – It’s also referred to as %T or T x 100 – T = P/Po • Where Po is the intensity of the blank • Can also use I = Intensity instead of Power • T = I / Io

Graphical Relationship n% transmission and % absorption are not linearly related to concentration n For a graph to be useful, a straight line is needed n ABSORBANCE = log(1/T) = -log(T)

The amount of light absorbed depends upon: Concentration (c) n Path length of sample cell (b) thru which light passes n Defined by Beer’s Law n c P 0 P b

Beer’s Law The intensity of a ray of monochromatic light decreases exponentially as the concentration of the absorbing mediumn %T = Tx 100 = P/P 0 x 100% increases n A = - log T n More dissolved n A=εbc substance = more absorption and less transmittance n ε = molar absorptivity coefficient and is constant for a substance n

Spectral Transmission Curve n Optimum wavelength

Standardization Graph - Standards (solutions of known concentration) of the compound of interest are made, treated, and their absorbances (ABS) and concentration values are used to create a Standardization Graph.

Standardization Graph Absorbance vs. Concentration (%) of Co. Cl 2 0. 550 0. 500 0. 450 0. 400 0. 350 0. 300 0. 250 0. 200 0. 150 0. 100 0. 050 0. 000 0 20 40 60 80 % Concentration 100 120
 Introduction to spectrophotometry
 Introduction to spectrophotometry
 Spectrophotometry and beer's law
 Beer lambert law definition
 Spectrophotometer introduction
 A260/280 ratio for rna
 What is the principle of spectrophotometry
 Atomic absorption spectrophotometry principle
 Colour wheel colorimetry
 What is complementary color
 Beer's law equation example
 Nephelometry
 Application of colorimeter
 Introduction to colorimetry
 Applications of uv visible spectroscopy
 Charge d'un électron
 Hát kết hợp bộ gõ cơ thể
 Bổ thể
 Tỉ lệ cơ thể trẻ em
 Voi kéo gỗ như thế nào
 Glasgow thang điểm
 Chúa yêu trần thế alleluia
 Môn thể thao bắt đầu bằng từ chạy
 Thế nào là hệ số cao nhất
 Các châu lục và đại dương trên thế giới


