Nutritional assessment in hospitalized patients M Safarian MD


 n Men=48+ 2. 3 for each inch over 152 m")
 n Add 10% if SS is large n Subtract 10%")


 Very popular n Safe n Noninvasive n Portable n Rapid n")


, that may be associated")


,")


: to evaluate degree of hypermetabolism (stress level):")

 n Energy intake n Food and Beverage")


 n Hyponatremia: Na under 130 m. Eq/L n")
 n Hyperkalemia: K over 5,")

 n Consider hydration and Nutrition. n High level of urea")
 n Low level – – malnutrition, – serious hepatic failure–")

 n Serum levels of creatinine evaluation together with muscle")
 n. N V: M: 7 -46 F: 4 -35 U/L n High level")
 n High level – – hypoperfusion, – hepatitis, – cell necrosis, – muscles")
 n TG-increase – during sepsis, mainly on the begining, – monitorate")
 vital danger")
 n Hypophosphataemia: under 1, 9 mg/dl –")
 n Mg – together")


 l")


- Slides: 119
Nutritional assessment in hospitalized patients M. Safarian, MD Ph. D.
Nutrition Care Process Steps n Nutrition Assessment n Nutrition Diagnosis n Nutrition Intervention n Nutrition Monitoring and Evaluation
Nutritional care process Anthropometrics Nutritional assessment tools
Nutritional Assessment n Anthropometric n Clinical evaluation n Biochemical, n Dietary assessment laboratory assessment evaluation
ESPEN guidelines Questions to be answered: n What n Is is the condition now? the condition stable? n Will the condition get worse? the disease process accelerate nutritional deterioration?
Anthropometric methods in ICU n Weight n Height estimation n Mid-arm n Skin circumference fold thickness n Head circumference
Weight
Ideal Body Weight (kg) n Men=48+ 2. 3 for each inch over 152 m n Women=45. 3+2. 3 n Correction for each inch over 152 cm for skeletal size:
Ideal Body Weight (kg) n Add 10% if SS is large n Subtract 10% if SS is small
Adjusted body weight n Used when actual body weight is more than 120% of IBW: n. ABW=IBW+ 25% of (actual body weight - IBW)
Height in ICU patients
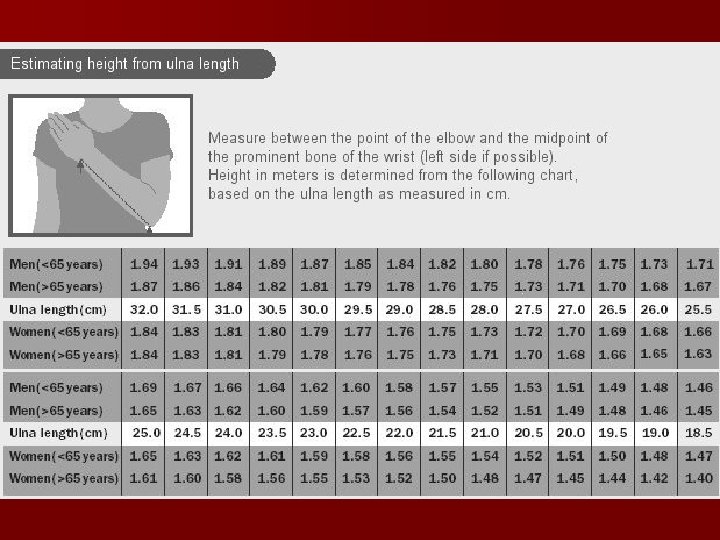
Alternative measurements Estimating Height from ulna length
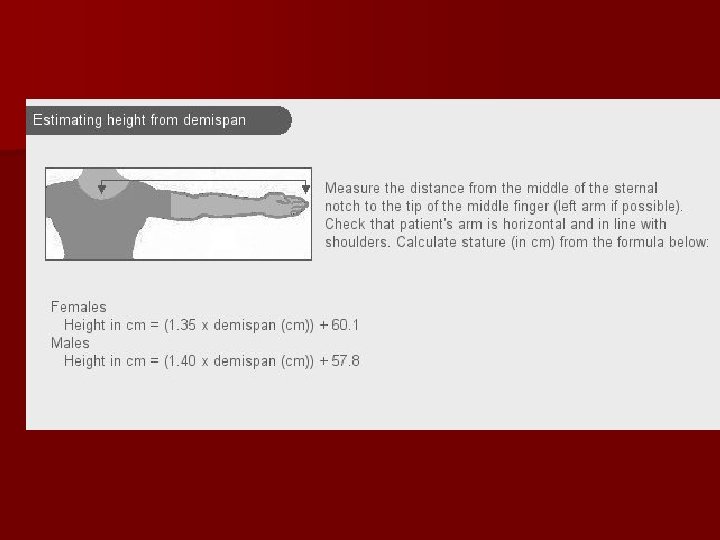
Estimations of height
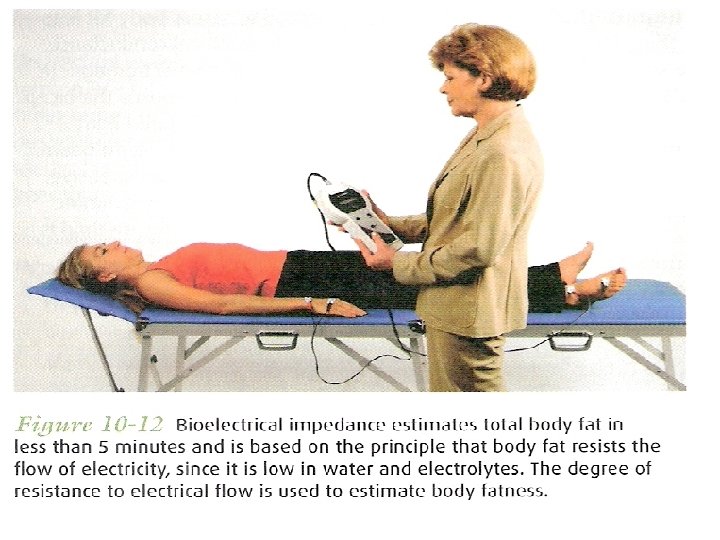
Body composition (BIA) Very popular n Safe n Noninvasive n Portable n Rapid n
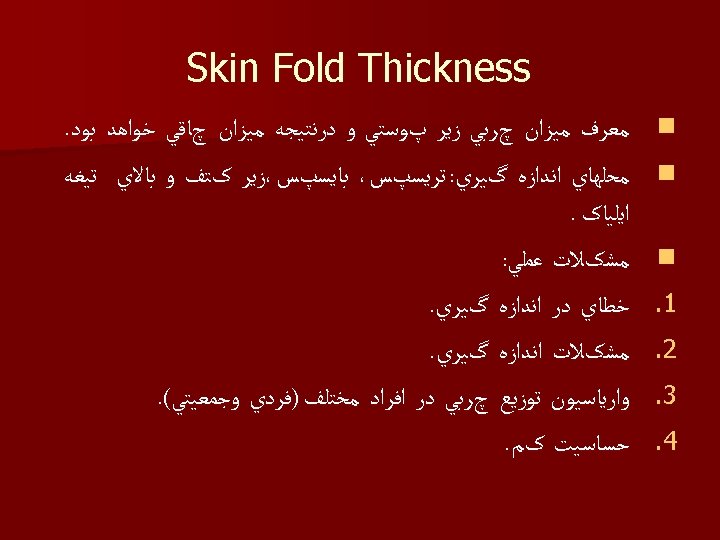
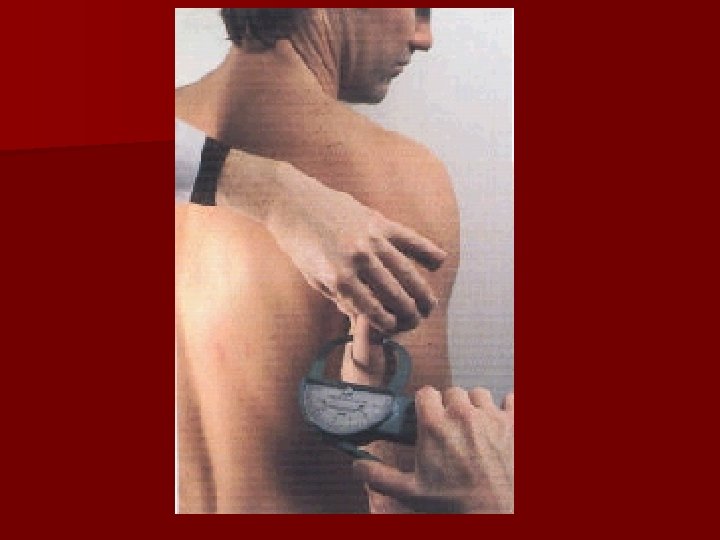
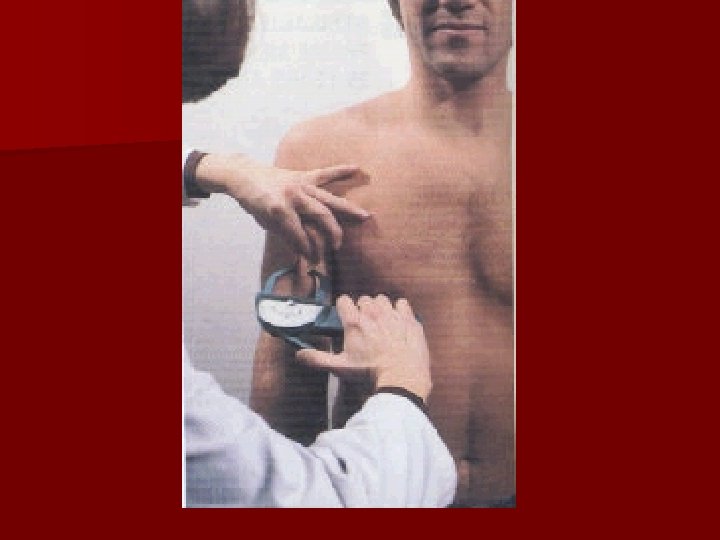
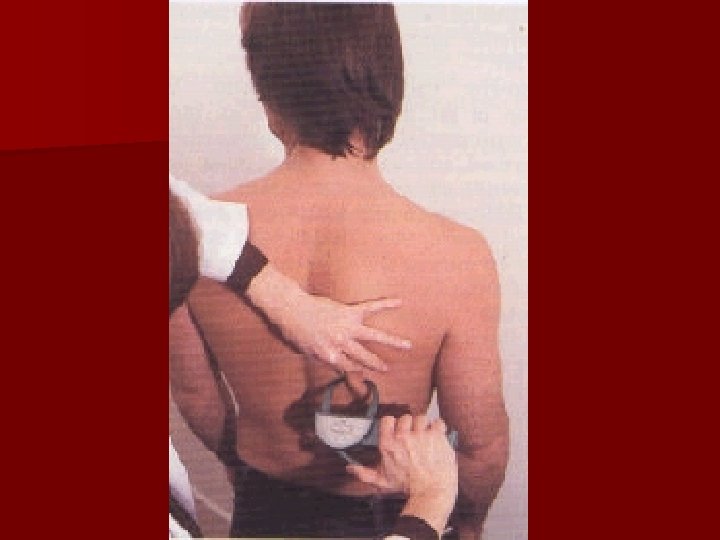
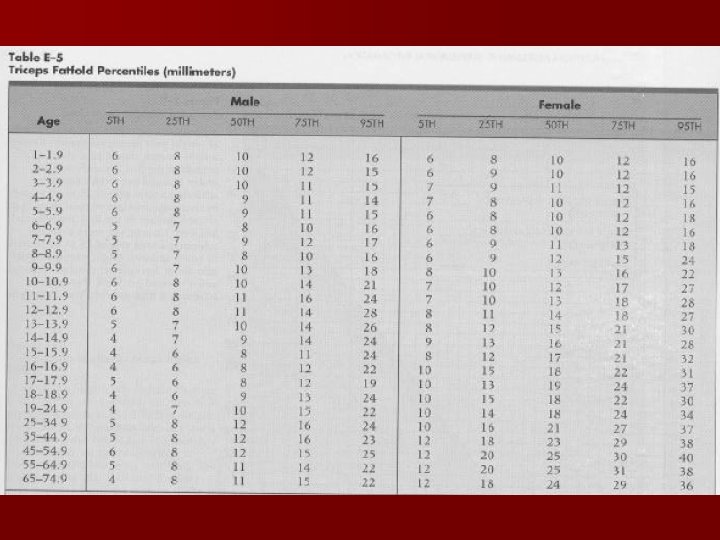
Skin Fold Thickness
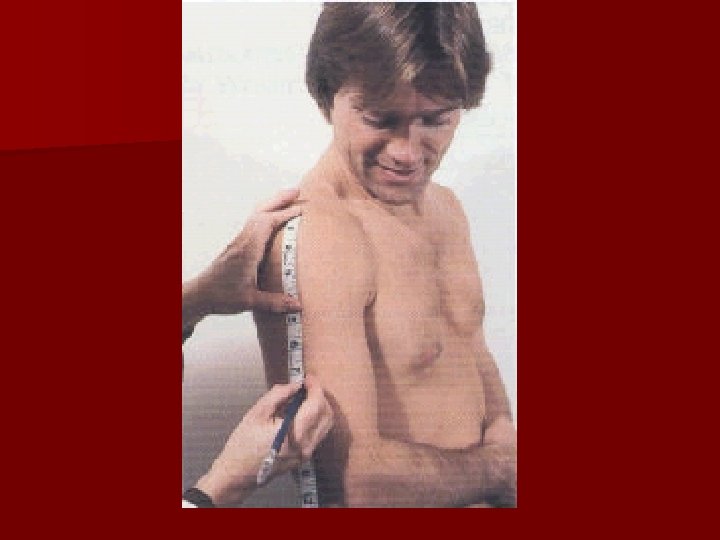
Mid arm circumference n n n measured with a nonstretch measuring tape midway between the acromion and olecranon of the nondominant arm ≤ 15 cm: severe depletion of muscle mass 16– 19 cm: moderate depletion 20– 22 cm: mild depletion
Mid arm circumference
BMI estimation If MUAC is <23. 5 cm, BMI is likely to be <20 kg/m 2 If MUAC is >32. 0 cm, BMI is likely to be >30 kg/m 2
Clinical assessment
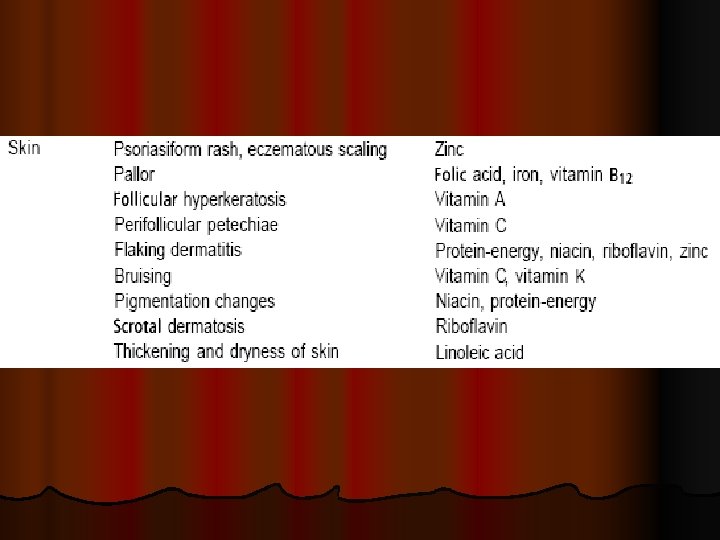
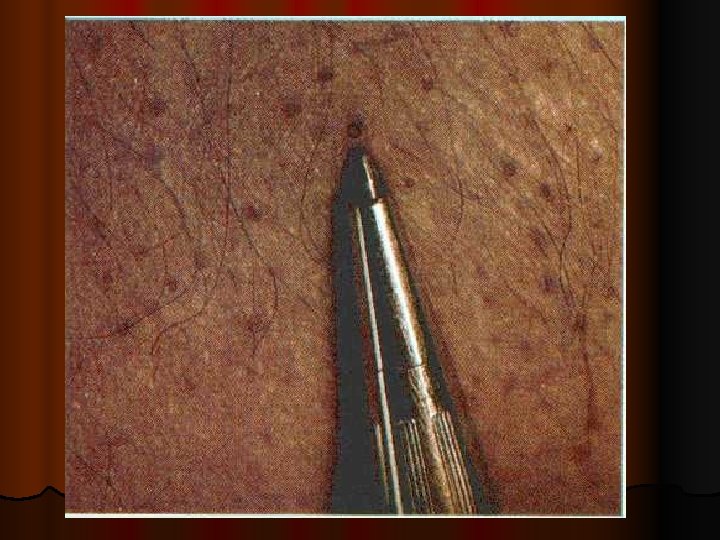
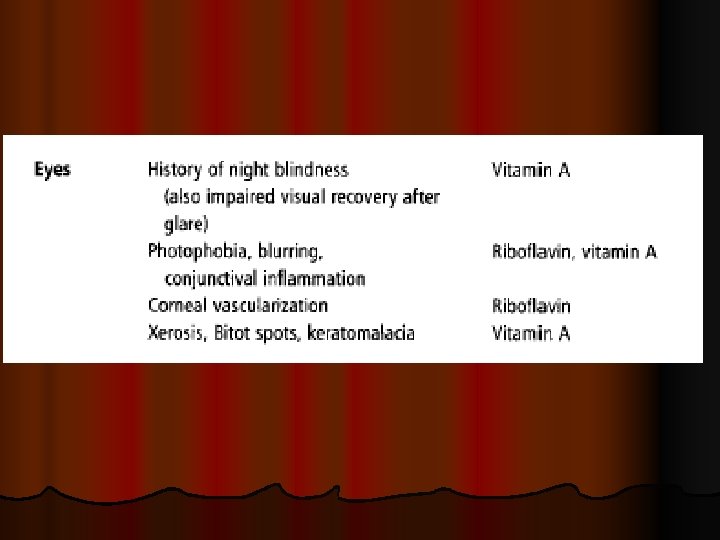
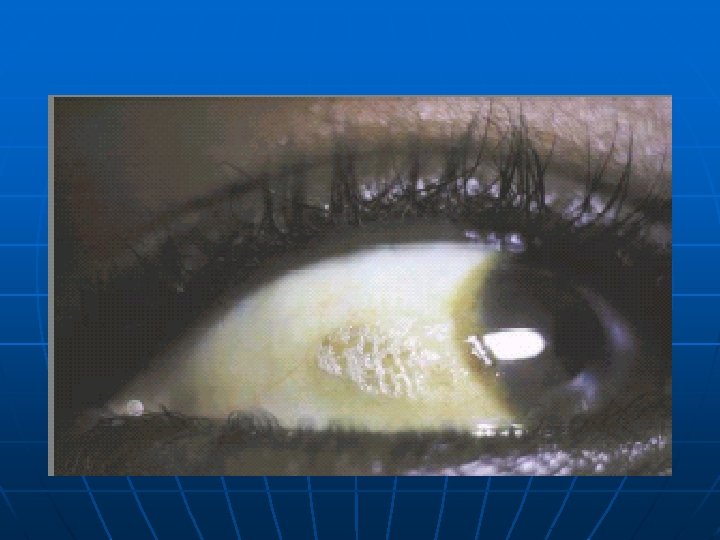
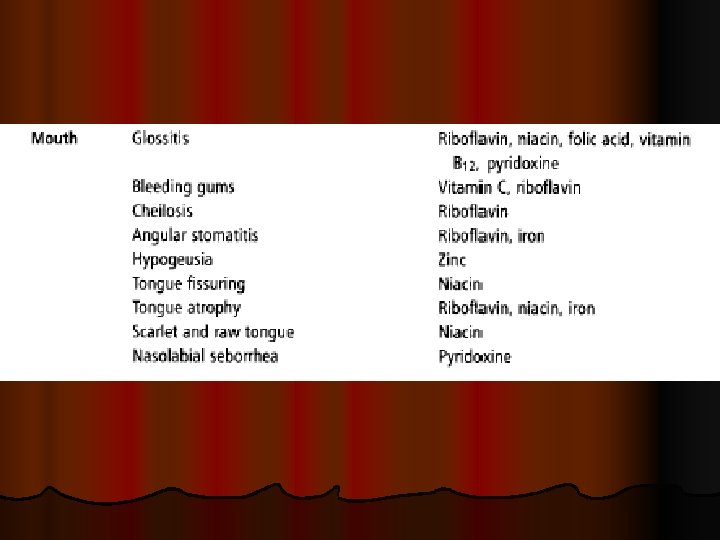
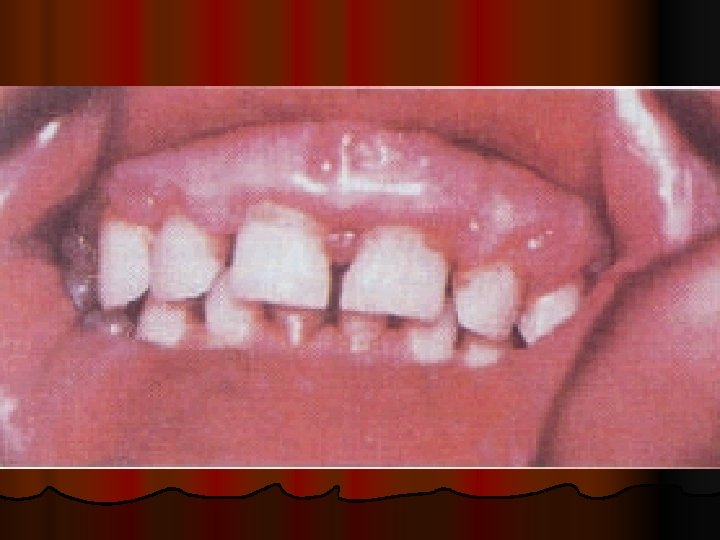
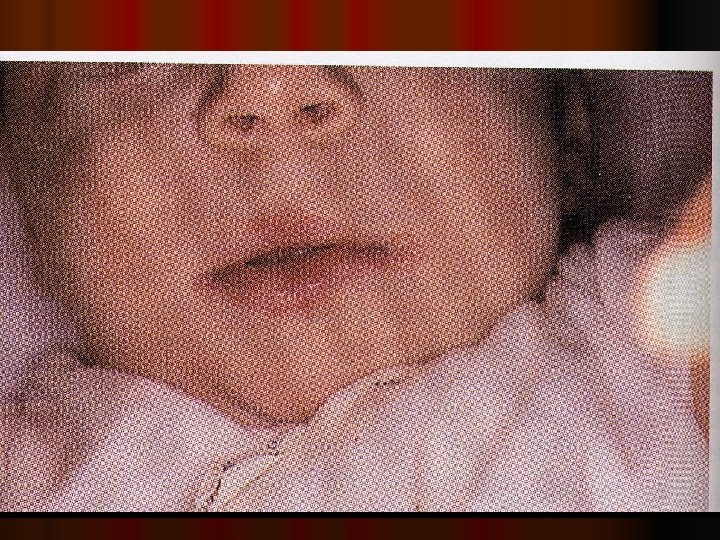
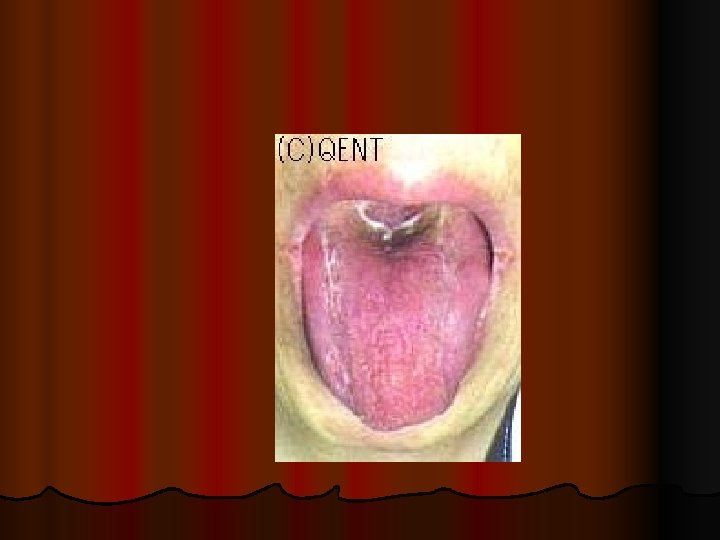
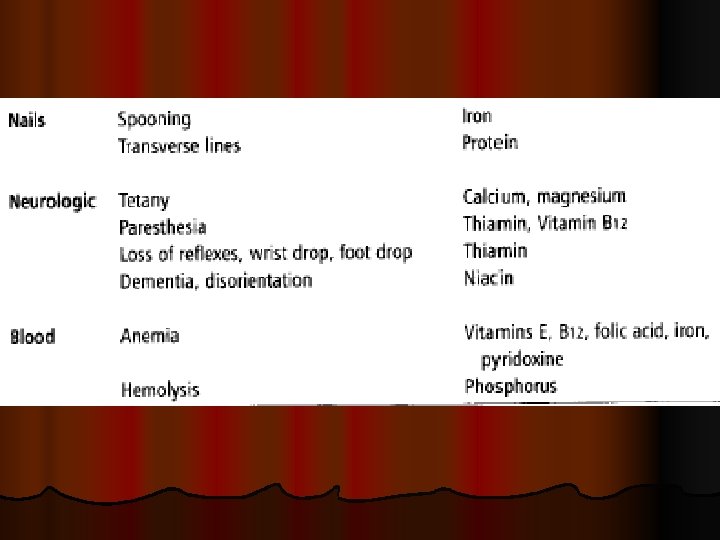
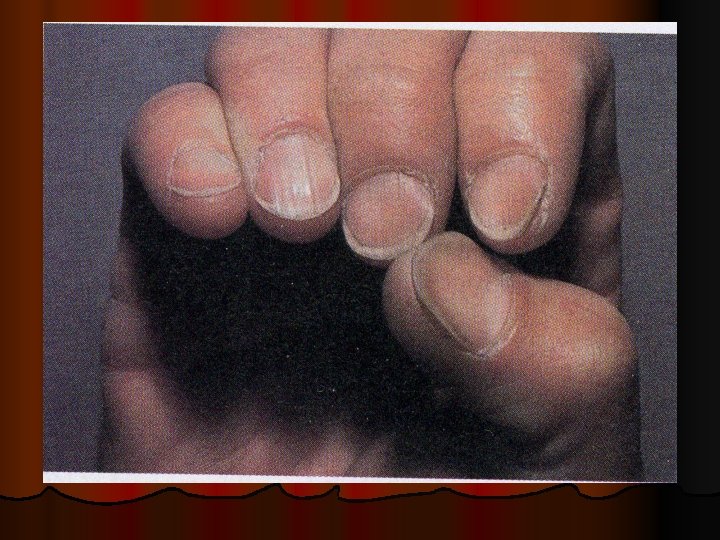
CLINICAL ASSESSMENT Detectiong of physical signs, (specific & non specific), that may be associated with malnutrition. Nutritional history General clinical examination, with special attention to organs like hair, angles of the mouth, gums, nails, skin, eyes, tongue, muscles, bones, & thyroid gland. Detection of relevant signs helps in establishing the nutritional diagnosis
CLINICAL ASSESSMENT
General: muscle wasting
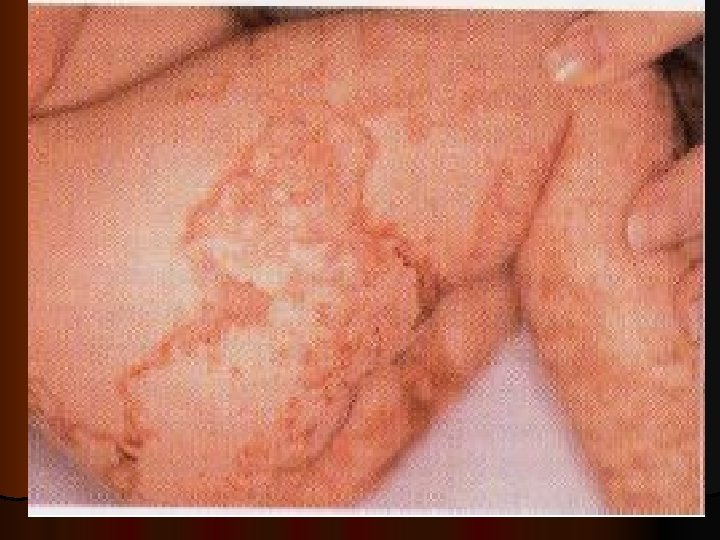
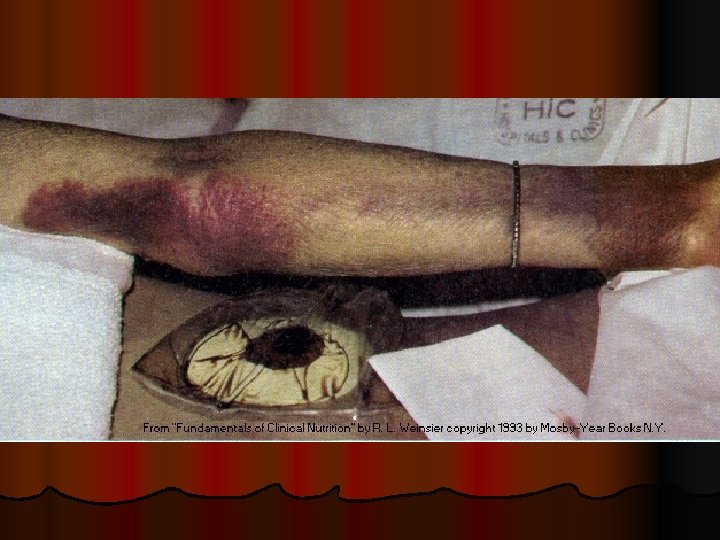
Flaky paint dermatosis: protein deficiency
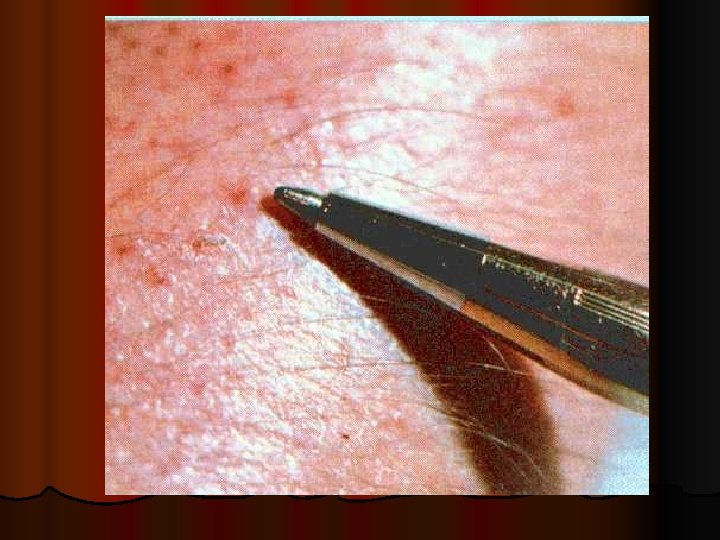
Essential fatty acid deficiency syndromes (EFADs(
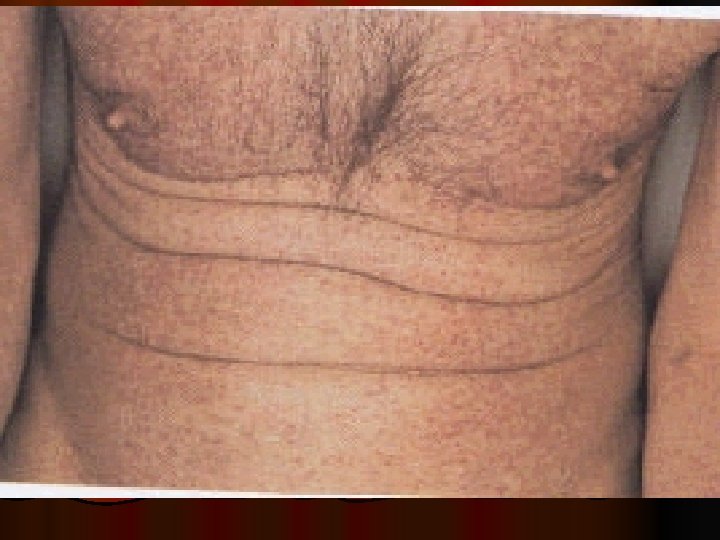
Zinc deficiency
Zinc deficiency
Wasting Clavicle 59
The Shoulder and Elbow n n The shoulder Normal: rounded or sloped Abnormal: square, can see acromion process The elbow well padded and not showing joint 60
The Arm Bend arm and pinch at triceps. Only pinch the fat, not the muscle. n Normal: fingers don’t meet n Abnormal: fingers meet n 61
The Legs showing muscle wasting 63
Quadriceps and Knees 64
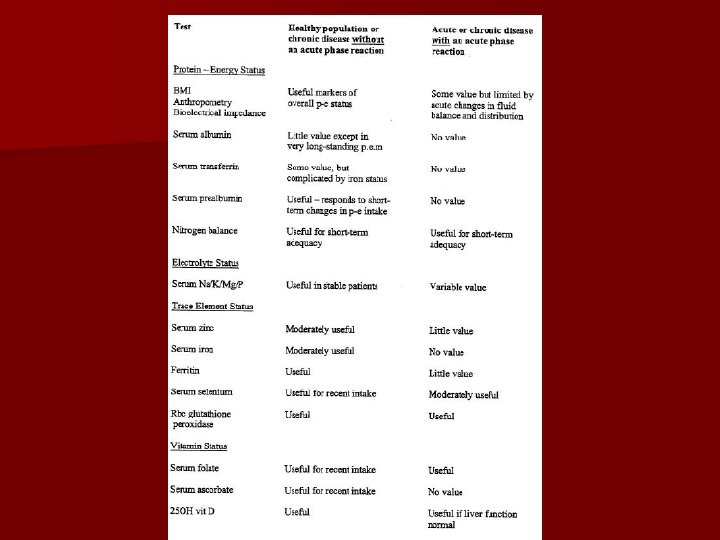
Biochemical, laboratory assessment
The possibilities of biochemical monitoring n On-line monitoring (cardiosurgery – p. H, minerals (K), the electrodes are localized on central cateter, possibility to check parameters on-line. n bed side monitoring (glycaemia, urine /protein, p. H, blood. . /, oximeter O 2 saturation, acidobasis, drugs /dg. strips) n Biochemical analysis
Biochemical parameters n Na, K, Cl, Ca, P, Mg, osmolality - blood, urine n Acidobasis, lactate n urea, creatinin clearence, Nitrogen balance n bilirubine, ALT, AST, LDH, amylase, lipase n cholesterol, triglycerides, glucose – blood, urine
Biochemical parameters n Total protein, albumine, prealbumine n CRP n TSH n Basic analysis are made at the first, must be done within 90 minutes
Other biochemical parameters n Trace elements /Zn, Se. . / n Vitamins n Drugs /methotrexate, antiepileptics, antibiotics. . . / n Aminogram /glutamin. . / n Interleucins, TNF… n Hormones /cortisol, glucagone, adrenaline. . /.
Biochemical markers of nutrition status: n Plasmatic proteins with short biologic half-life n Albumin – -syntetizate in liver, half-life time is 21 days – Normal: 35 -45 g/l. – Decrease of alb: malnutrition – Trends of changes alb. levels during realimentation are criterium of succesfull terapy. – Acute decrease: acute phase response.
Biochemical markers of nutrition status: n Transferin: syntesized in liver, – biolog HL: 8 days. Fysiolog. – Value 2 -4 g/l, n RBP: syntesized in liver – Biolog half-life : 12 h. , – Normal value: 0, 03 -0, 006 g/l. – Acute phase reactant (negative)
Biochemical markers of nutrition status: n Prealbumin-syntesized in liver, – biolog. half-life: 1, 5 days. – Normal Value 0, 15 -0, 4 g/l. – Decrease in failure of proteosyntesis-indicator of acute protein malnutrition.
NUTRITIONAL ASSESSMENT n Urine urea nitrogen (UUN): to evaluate degree of hypermetabolism (stress level): – 0 – 5 g/d= normometabolism – 5 – 10 g/d = mild hypermetabolism (level 1 stress) – 10 – 15 = moderate (level 2 stress) – >15 = severe (level 3 stress)
Nutrition Monitoring and Evaluation n Monitor progress and determine if goals are met n Identifies patient/client outcomes relevant to the nutrition diagnosis and intervention plans and goals n Measure and compare to client’s previous status, nutrition goals, or reference standards
Other Outcomes Food and Nutrient Intake (FI) n Energy intake n Food and Beverage n Enteral and parenteral n Bioactive substances n Macronutrients n Micronutrients Physical Signs/Symptoms n Anthropometric n Biochemical and medical tests n Physical examination
Monitoring
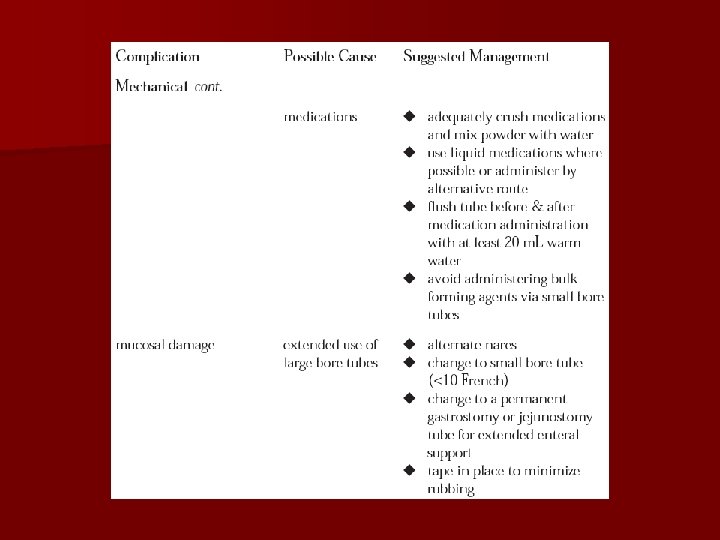
Enteral Nutrition Monitoring: Gastric Residuals n Clinically assess the patient for abdominal distension, fullness, bloating, discomfort n Place the pt on his/her right side for 15 -20 minutes before checking a RV to avoid cascade effect n Seek transpyloric access of feeding tube n Raise threshold for RV to 200 -300 m. L n Consider stopping RV checks in stable pts Rees Parrish C. Enteral Feeding: The Art and the Science. Nutr Clin Pract 2003; 18; 75 -85.
Some Lab tests
Na serum levels Hypernatremia: Na over 150 mmol/l n hyperaldosteronism hypovolemia reninangiot-aldost. n Hypothalamic damage n Hypertonic hyperhydration n Diabetes insipidus n Brain death
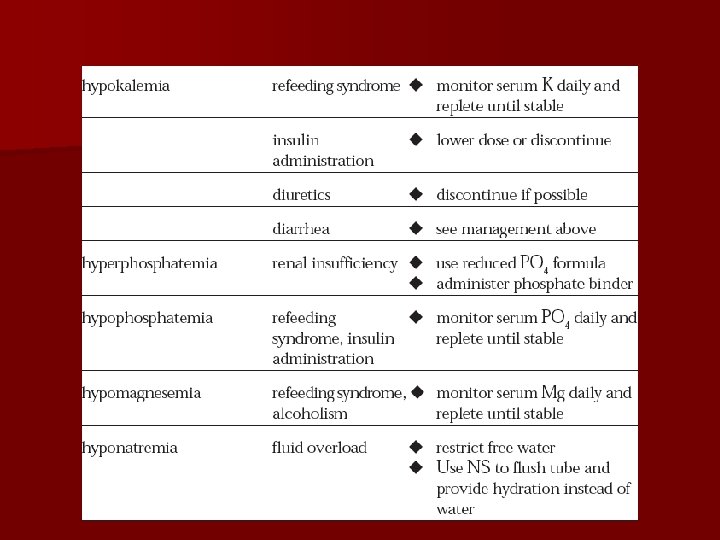
Na serum levels(136 -145 m. Eq/L) n Hyponatremia: Na under 130 m. Eq/L n Na in the third space - ascites, hydrothorax n Cardiac failure – increase of extracellular volume n Application of solutions without electrolytes n Hypersecretion of ADH – water retention
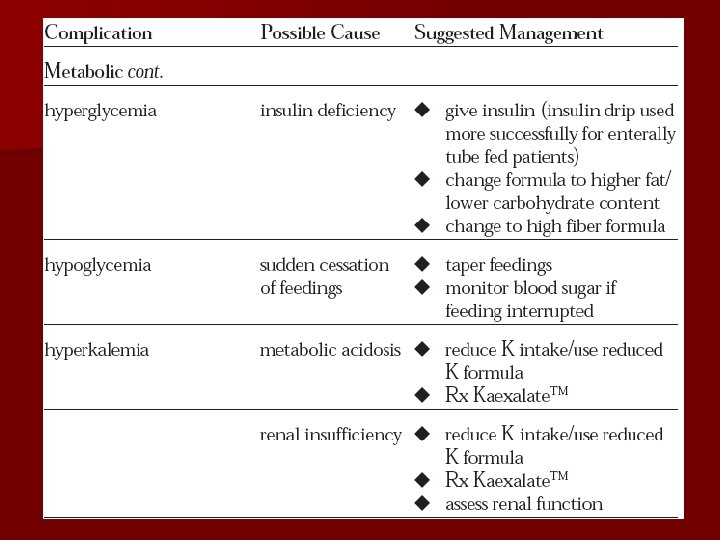
K serum levels (3. 5 -5. 3 m. Eq/L) n Hyperkalemia: K over 5, 0 - 5, 5 m. Eq/L – p. H dependent /acidosis increases K level – Bigger intake, low output or both – Acute renal failure – Acute metabolic acidosis – Infusion with K
K serum levels Hypokalemia: K under 3, 5 m. Eq/L – Low intake, bigger uptake, or both – Emesis, diarrhoe / intestinal loss/ – Diuretics – Chemotherapy, antimycotics /renal tubules failure/ – Anabolic phasis – Hyperaldosteronism – Acute metabolic alcalosis
BUN (5 -20 mg/dl) n Consider hydration and Nutrition. n High level of urea – high intake of N, – increase catabolism – polytrauma-muscele loss – GIT bleeding – dehydration – low output- renal failure, n Low level – malnutrition, serious hepatic failure- ureosyntetic cycle and
BUN (5 -20 mg/dl) n Low level – – malnutrition, – serious hepatic failure– ureosyntetic cycle and gluconeogenesis dysfunction, – pregnancy– increase ECF
Urea n Urea in urine n Increase – catabolism, prerenal failure n Decrease – chronic malnutrition, acute renal failure
Creatinine(0. 5 -1. 1 mg/dl) n Serum levels of creatinine evaluation together with muscle mass, age, gender n Increase – bigger offer- destruction of muscle mass, – low output-renal failure n Decrease- – low offer-low muscle mass – malnutrition n Creatinine clearence, excretion fraction renal function
ALT(SGPT) n. N V: M: 7 -46 F: 4 -35 U/L n High level – – hepatopathologia, – steatosis, – hepatitis, – cell damage,
AST(SGOT) n High level – – hypoperfusion, – hepatitis, – cell necrosis, – muscles damage n both aminotransferases increase during damage of hepatic cells during inf. hepatitis.
TG(10 -190 mg/dl) n TG-increase – during sepsis, mainly on the begining, – monitorate during parenterál nutrition with lipid emulsion n Glycemia, serum, urine, n Hypoglycemia below 2, 5 mmol/l-vital danger n hyperglycemia- insulin. rezistence, recomendation level of glycemia 4, 5 -8, 2
Glucose n Glycemia, serum, urine, n Hypoglycemia below 2, 5 mmol/l-(45 mg/dl) vital danger n hyperglycemia- insulin. rezistence n Recomendation (80 -150 mg/dl) level of glycemia 4, 5 -8, 2
P– serum levels(2. 7 -4. 5 mg/dl) n Hypophosphataemia: under 1, 9 mg/dl – Acute wastage of energy after succesfully resuscitation, overfeeding sy, anabolism (energetic substrates without K, Mg, P). n Hyperphosphataemia – Renal failure – Cell damage – over 5, 8 mg/dl
Mg – serum levels (1, 3 -2, 5 m. Eq/L) n Mg – together with potassium n Hypomagnesaemia – under 1, 2 m. Eq/L / – renal failure – low intake.
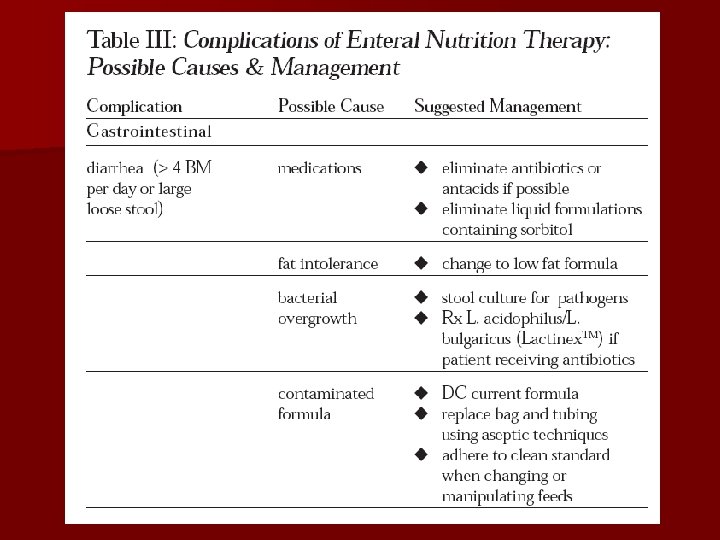
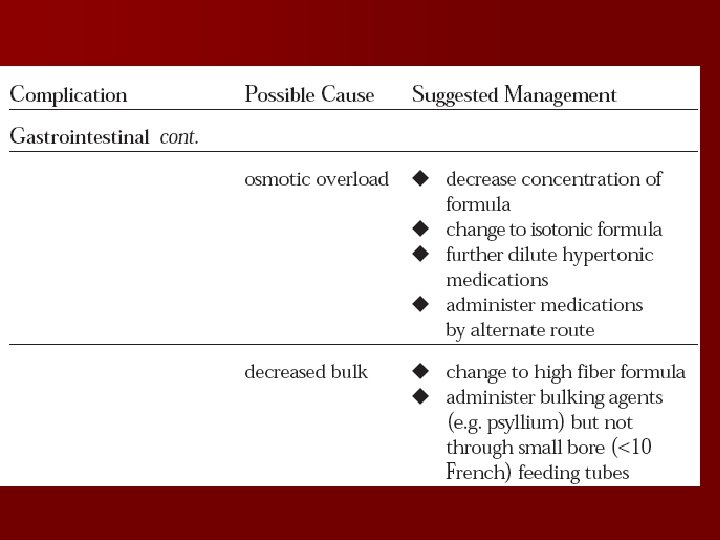
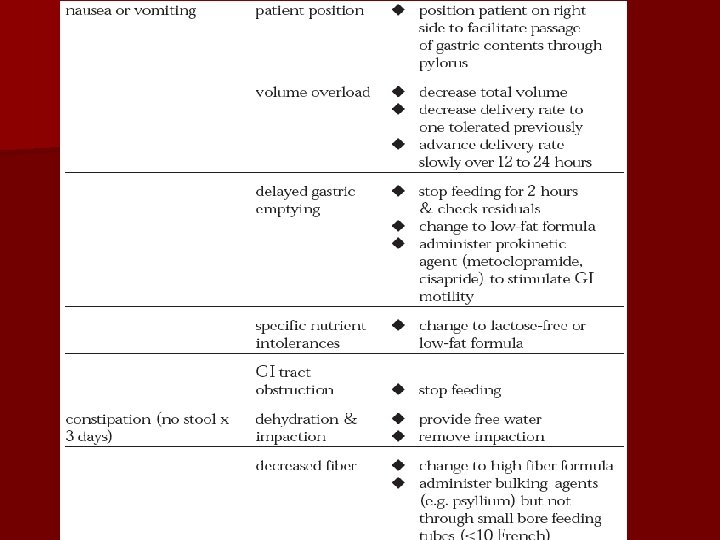
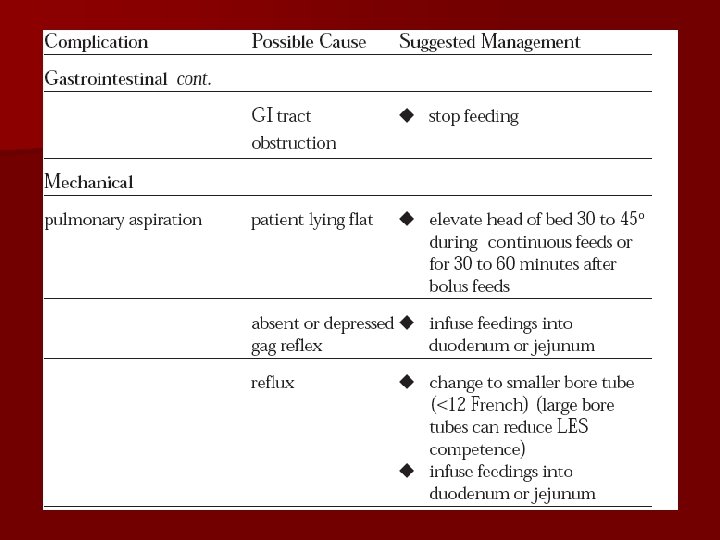
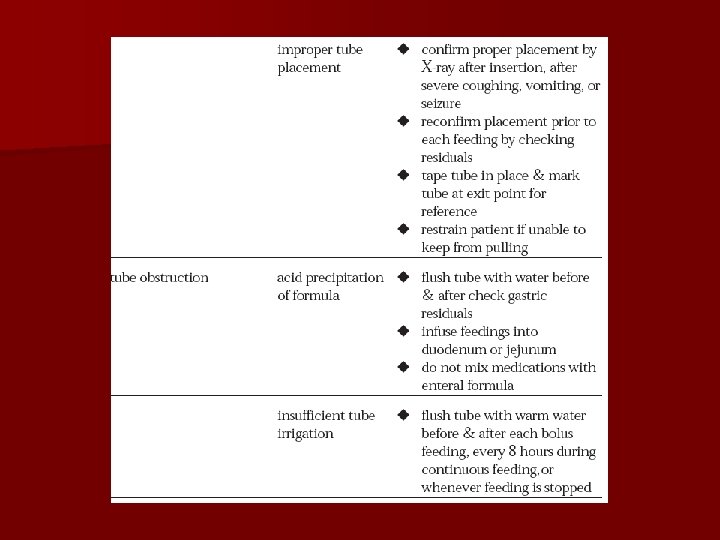
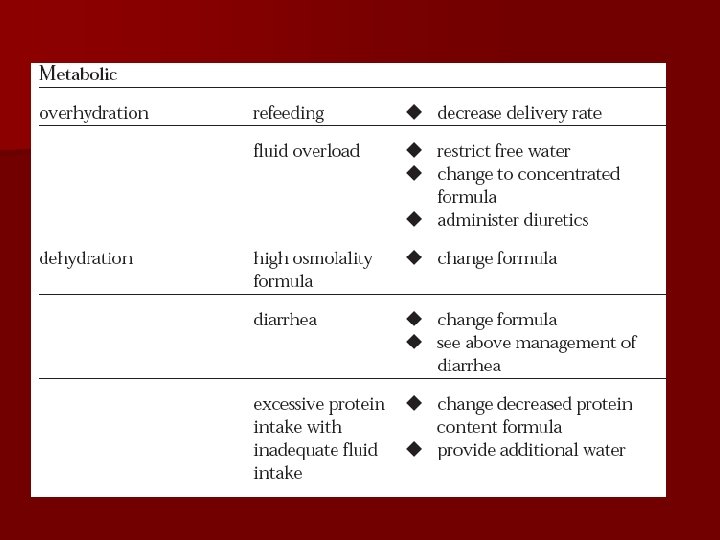
Monitoring of EN n For formula intolerance, n Hydration status, n Electrolyte status, n Nutritional status,
Monitoring
Monitoring in PN therapy l Weight (on a daily basis, initialy and ) l Blood Daily Electrolytes (Na+, K+, Cl-) Glucose Acid-base status 3 times/week BUN Ca+, P Plasma transaminases
Monitoring in PN therapy Variable to be monitored Initial Later period Clinical status Daily Catetheter site Daily Temperature Daily Intake &Output Daily
Monitoring in PN therapy Variable to be monitored Initial Later period Weight serum glucose Daily Weekly 3/wk Electrolytes (Na+, K+, Cl-) Daily 1 -2//wk BUN Ca+, P, mg Liver function Enzymes Serum triglycerides CBC 3/wk Weekly weekly
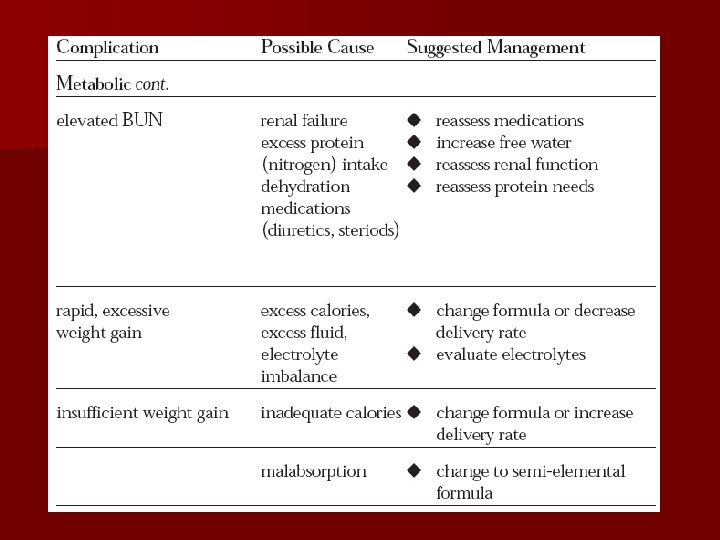
Problems 1. Catheter sepsis 2. Placement problems 3. Metabolic complications
Complications l l Dehydration Possible cause: l. Inadequate fluid support; l. Unaccounted fluid loss (e. g. diarrhea, fistulae, persistent high fever). l Management: l. Start second infusion of appropriate fluid, such as D 5 W, 1/2 NS, NS. l. Estimate fluid requirement and adjust PN accordingly.
Complications l l Overhydration Possible cause: l. Excess fluid administration; l. Compromised renal or cardiac function. l Management: l. Consider D 70 (can’t use with PPN) or 20% lipid as calorie source l. Initiate diuretics. l. Limit volume.
Complications l l Alkalosis Possible cause: l. Inadequate K to compensate for cellular uptake during glucose transport l. Excessive GI or renal K losses. l. Inadequate Cl- in patients undergoing gastric decompression. l Management: l. KCl to PN. l. Assure adequate hydration. l. Discontinue acetate.
Complications l l Acidosis Possible cause: l. Excessive renal or GI losses of base l. Excessive Cl- in PN. l Management: l. Rule out DKA and sepsis. l. Add acetate to PN.
Complications l l Hypercarbia Possible cause: l. Excessive l calorie or carbohydrate load. Management: l. Decrease total calories or l. CHO load.
Complications l l Hypocalcemia Possible cause: l. Excessive PO 4 salts l. Low serum albumin. l. Inadequate Ca in PN. l Management: l. Slowly increase calcium in PN prescription.
Complications l l Hypercalcemia Possible cause: l. Excessive Ca in PN l. Administration of vitamin A in patients with renal failure. l. Can lead to pancreatitis. l Management: l. Decrease calcium in PN. l. Ensure adequate hydration. l. Limit vitamin supplements in patients with renal failure to vitamin C and B vitamins.
Complications l Hyperglycemia l Possible cause: l. Stress response. Occurs approximately 25% of cases. Management: l. Rule out infection. l. Decrease carbohydrate in PN. l. Provide adequate insulin.
Complications l Hypoglycemia l Possible cause: l. Sudden withdrawal of concentrated glucose. l. More common in children. l Management: l. Taper PN. Start D 10.
Complications l Cholestasis l Possible cause: l. Lack of GI stimulation. l. Sludge present in 50% of patients on PN for 4 -6 weeks; lresolves with resumption of enteral feeding. l Management: l. Promote enteral feeding.
Complications l l Hepatic tissue damage and fat infiltration Possible cause: l. Unclear etiology. l. May be related to excessive glucose or energy administration; l. L-carnitine deficiency. l Management: l. Rule out all other causes of liver failure. l. Increase fat intake relative to CHO. l. Enteral feeding.