Nutrition surveys Nutrition surveys Objectives Different types of

Nutrition surveys

Nutrition surveys Objectives • • Different types of nutrition data Why surveys are important Why is data quality important Nutrition surveys methodologies – SMART – DHS – MICS 2

Nutrition surveys Prevalence? 3
 4")
Nutrition surveys 7, 4% (50 million) 4

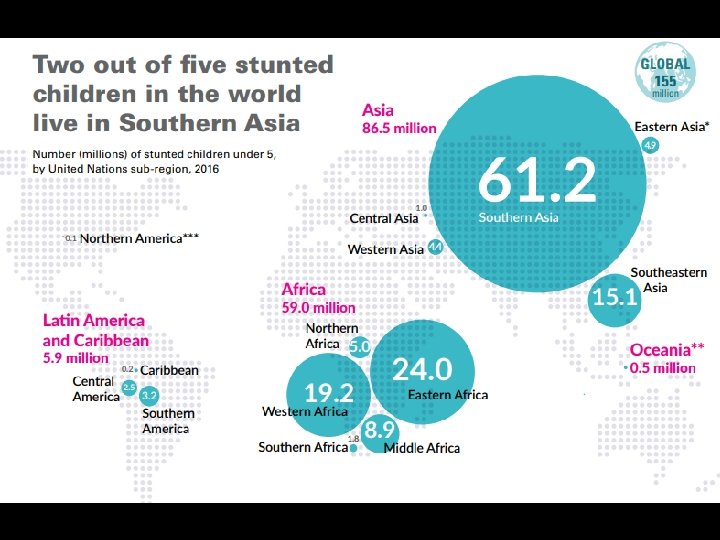
? ? ? STUNTING ? ? ?
 6")
22, 9% (155 million) 6

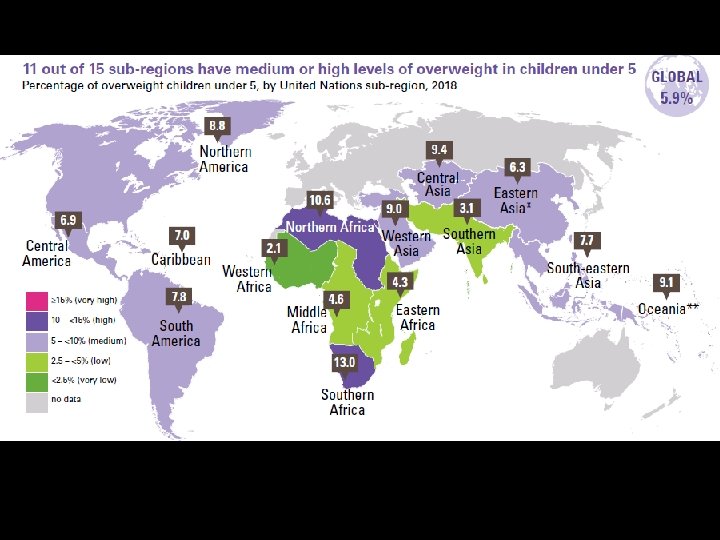
? ? ? OBESITY ? ? ?

Nutrition surveys Prevalence DATA IS USED BY GOVERNMENTS TO DEVELOP POLICIES AND PLAN HEALTH PROGRAMMES 10

WHO Thresholds for nutrition data significance In the case of wasting, high levels of malnutrition come together with an increase in child mortality.

Nutrition surveys LARGE-SCALE SURVEYS ARE A COMPLEX AND DIFFICULT TO UNDERTAKE. ANTHROPOMETRIC MEASUREMENTS ARE PRONE TO ERRORS 12

Nutrition surveys What is a survey? 13

Nutrition surveys Definition of a Survey Collection of data from a specific population at a single point in time 14

Nutrition surveys What are the differences between nutritional surveys, nutrition surveillance and rapid assessment? 15

Methods for Data Collection Rapid assessment Objective Rapid appraisal Data Type Qualitative/ Cross sectional snapshot Method Observational / Secondary source Nutrition Survey Mediumterm appraisal Nutrition Surveillance Quantitative/ Cross sectional snapshot Sample with survey instruments Quantitative/ Longitudinal trends Continuous appraisal Periodic, standardizd d data collection 16

Nutrition surveys Surveys vs Surveillance Survey Surveillance Provides a punctual image of the target population in relation to specific data. Continual and regular process of collecting information. Allows to collect a wide variety of data. Allows to collect a limited number of data. Usually, data collection is done on a sample of the population. Always tries to collect data on every case of disease. Data collection that allows to calculate the prevalence and incidence rates. Data collection only for numerator; we have to get data for the denominator from other resources. 17

Nutrition surveys Why conduct a Nutrition Survey? 1. Evaluate the severity of people’s nutritional situation and the risk to people’s lives. 2. To identify appropriate interventions to address malnutrition and its underlying causes. 3. Advocacy. 4. Evaluate already existing programs (baseline) 18

Data quality for nutrition • SDGs, WHA targets • Accurate anthropometric data is critical • The type of survey used depends on the context, but all surveys should follow standard criteria for anthropometric data quality and standard methods for data collection, analysis and reporting • Comparable and accurate anthropometric data is essential

Antropometric data • Not only from surveys, also from routine data, surveillance and administrative reports • Used by host country governments, donors, and national and international partners • Complex data collection (require specific tools) • Only high quality data can be used for decision • NIPN works with both, routine and data quality

21

Data quality • Even validated data need checking data quality • Different types of surveys may have different bias and produce different results • Data quality is important to all types of data and some of the checks presented here can be applied to all data (not only surveys) • Quality of non anthropometric data is also very important for nutrition (age)

Data Quality Routine data Survey data Other indicators Anthropometry Basic Advanced

The data is not "good" or "bad" quality. The quality of the data must be good enough for the desired analysis

Nutrition surveys Survey errors Sampling errors Is the survey representative of the population? Measurement errors Is the data collected close to the real value in the population? 25

Nutrition surveys Sampling errors Tests to compare the data in our sample with the population data (age, sex, etc) Measurement errors Extreme values Dissaggregation by team Anthropometric data Flags, normal tests… NIPN training module 26

Anthropometric data quality of our surveys Surveys that collect Nutrition data 27

Nutrition surveys Demographic and Health Surveys The DHS programme was established in 1984. More than 300 surveys in over 90 countries Nationally representative household sample surveys Coverage of a range of population health indicators 5000 - 30 000 households and 7, 000 children surveyed in average • Every 3– 6 years • Data-sets are fully open-access. • • • 28

29

Categories of DHS indicators • • Characteristics of Households. Fertility, contraception and sexual activity Family Planning. Early Childhood Mortality. Maternal and Child Health. Maternal and Child Nutrition Malaria. HIV/AIDS 30

Anthropometric data quality of our surveys Multiple Indicator Cluster Surveys • Developed by UNICEF in the early 1990 s to respond to data needs for the World Summit for Children Goals • Funding from UNICEF, other UN agencies and development partners, and governments • 313 surveys done in 117 countries in 23 years • Used on the final data collection for the Millennium Development Goals and the Sustainable Development Goals (SDGs) baseline setting. • Multi-topic surveys and similar sample sizes to DHS • Currently: MICS 6 31

Multiple Indicator Cluster Surveys 32

Categories of MICS indicators Mortality Nutrition Child Health Water, sanitation and hygiene • Reproductive health • Child development • Literacy and education • • • Child protection HIV and sexual behavior Mass media Subjective Wellbeing Tobacco and alcohol use House hold energy use Victimization Social transfers 33

Anthropometric data quality of our surveys Standardized Monitoring & Assessment of Relief and Transitions (SMART) • Standardized and simplified survey methodology to use in emergency situations and recently on development contexts. • Designed to calculate burden on nutrition programs • Data on Nutrition, Mortality and selected intervention • Initiated in 2002 • The SMART/NNS are often conducted every two years, annually, or two times a year • ENA specialized software • Costs: 1 strata 20, 000$. NNS 200, 000$ 34

The Complex Emergency Database 35

5 min Quizz Identify commonalities of the three Surveys methodologies.

Nutrition surveys Justification for a survey • Decision made in collaboration with the government, the partner agencies and the funders. • Surveys have to take place in order to answer to questions oriented towards programs. • To consider : – Will the survey answer questions that arise? – Are the results important for decision making? – Will the results of the survey lead to adopting specific measures? – Is the affected population accessible? – Is there data already available? 37

Checking data quality What to assess during a nutrition survey? • • Anthropometry (children vs adults) Morbidity and mortality. Food security. The social and care environment The health environment Available resources Political and security context 38

Excercise 2 • Divide in 4 groups: A, B, C and D • Activity 1: Additional data to collect. – Target population for this data – Method used to collect it. – Possible advantages and disadvantages • Activity 2: differences of the three survey methods 39
- Slides: 39