
Statewide Evaluation Results Surveys and DESSA Terri Foulkes

- Slides: 74
Statewide Evaluation Results, Surveys, and DESSA Terri Foulkes, Missouri After. School Network Wayne Mayfield, Ph. D, Office of Social and Economic Data Analysis Karen De. Chant-Ross, Aperture Education
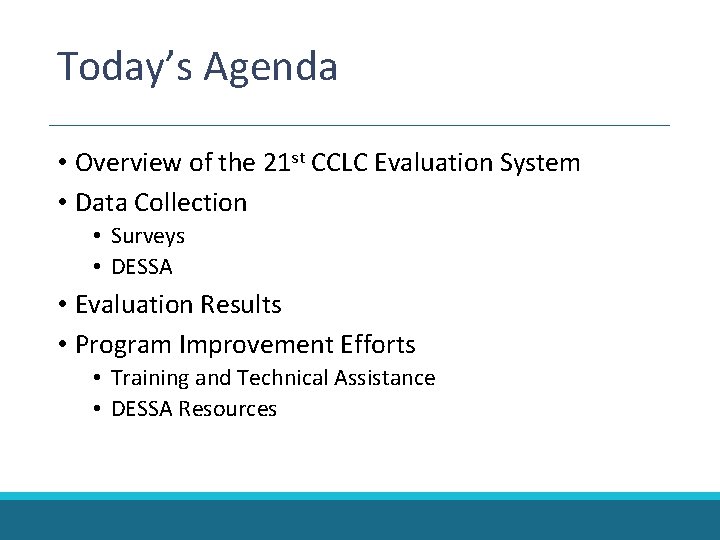
Today’s Agenda • Overview of the 21 st CCLC Evaluation System • Data Collection • Surveys • DESSA • Evaluation Results • Program Improvement Efforts • Training and Technical Assistance • DESSA Resources
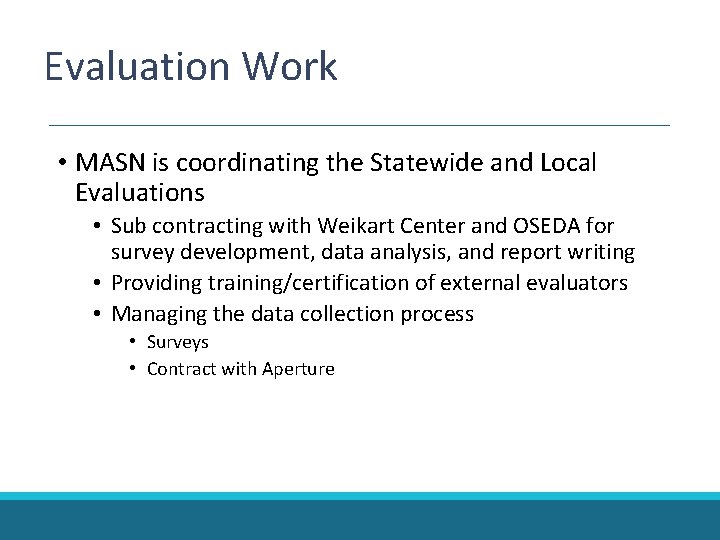
Evaluation Work • MASN is coordinating the Statewide and Local Evaluations • Sub contracting with Weikart Center and OSEDA for survey development, data analysis, and report writing • Providing training/certification of external evaluators • Managing the data collection process • Surveys • Contract with Aperture
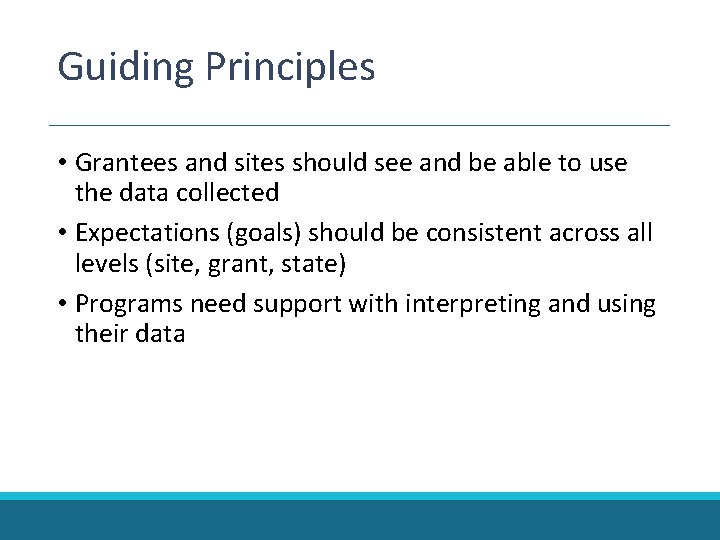
Guiding Principles • Grantees and sites should see and be able to use the data collected • Expectations (goals) should be consistent across all levels (site, grant, state) • Programs need support with interpreting and using their data
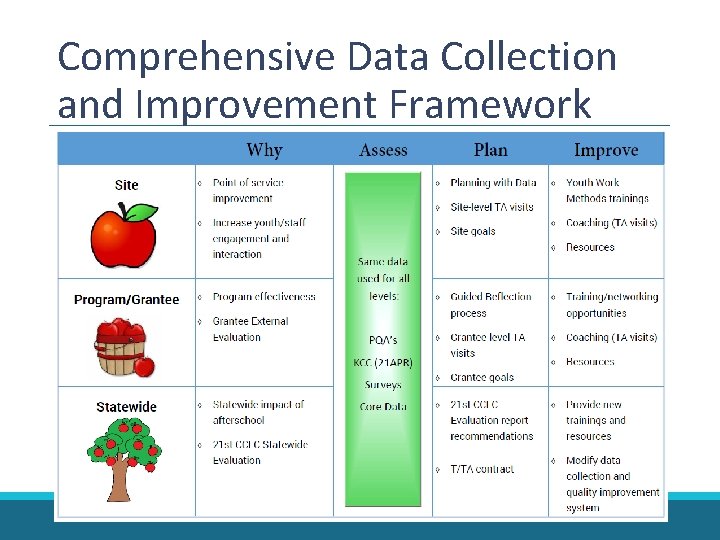
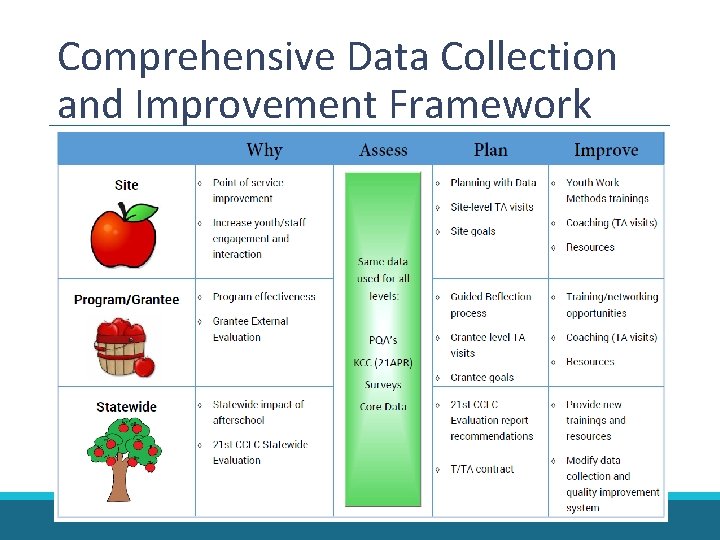
Comprehensive Data Collection and Improvement Framework
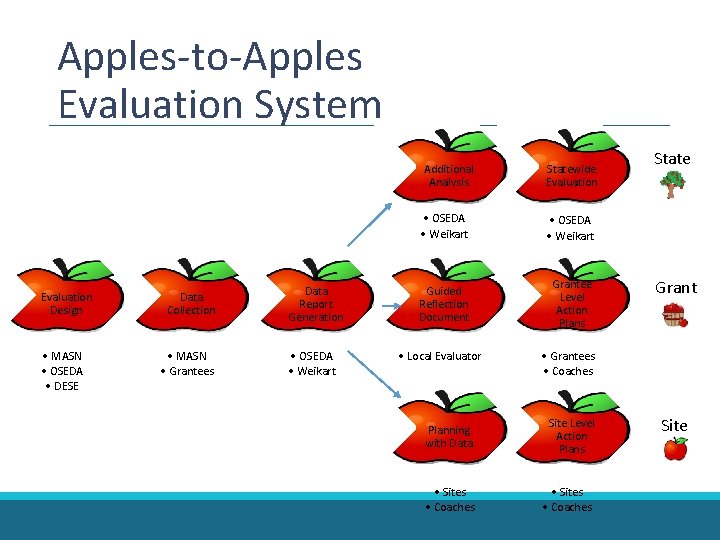
Apples-to-Apples Evaluation System Evaluation Design • MASN • OSEDA • DESE Data Collection • MASN • Grantees Data Report Generation • OSEDA • Weikart Additional Analysis Statewide Evaluation • OSEDA • Weikart Guided Reflection Document Grantee Level Action Plans • Local Evaluator State Grant • Grantees • Coaches Planning with Data Site Level Action Plans • Sites • Coaches Site
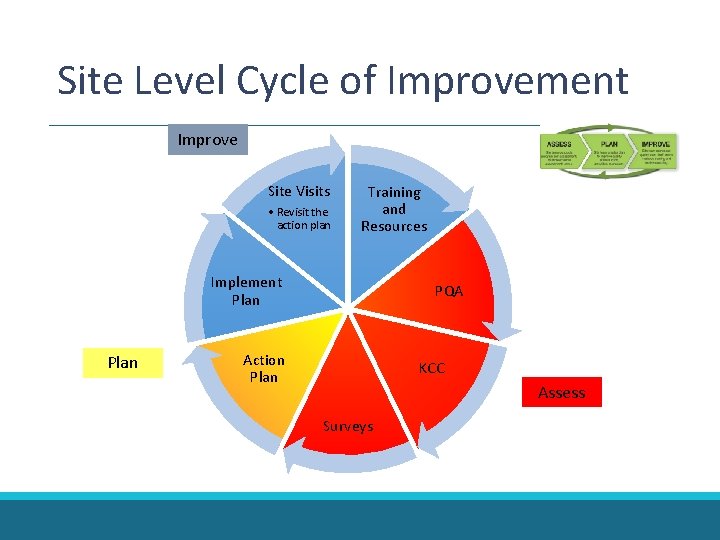
Site Level Cycle of Improvement Improve Site Visits • Revisit the action plan Training and Resources Implement Plan PQA Action Plan KCC Assess Surveys
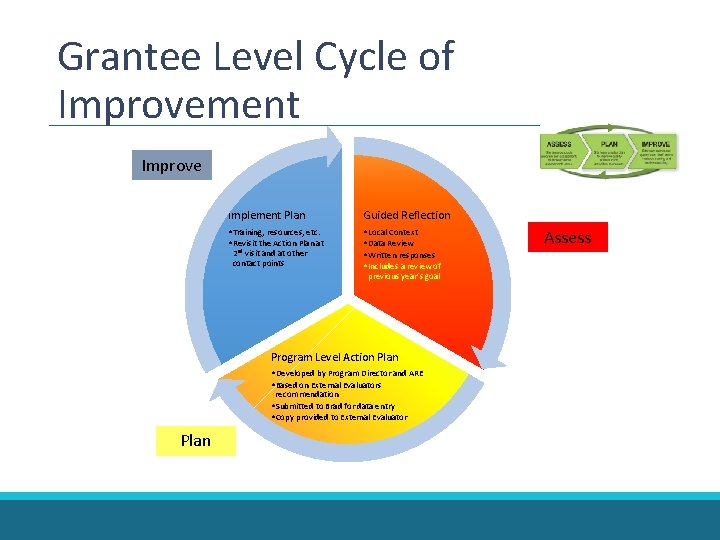
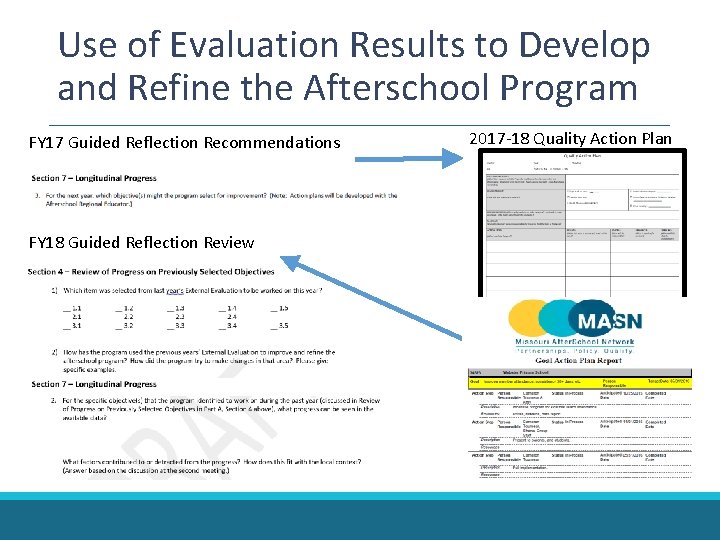
Grantee Level Cycle of Improvement Improve Implement Plan Guided Reflection • Training, resources, etc. • Revisit the Action Plan at • Local Context • Data Review • Written responses • Includes a review of 2 nd visit and at other contact points previous year’s goal Program Level Action Plan • Developed by Program Director and ARE • Based on External Evaluators recommendation • Submitted to Brad for data entry • Copy provided to External Evaluator Plan Assess
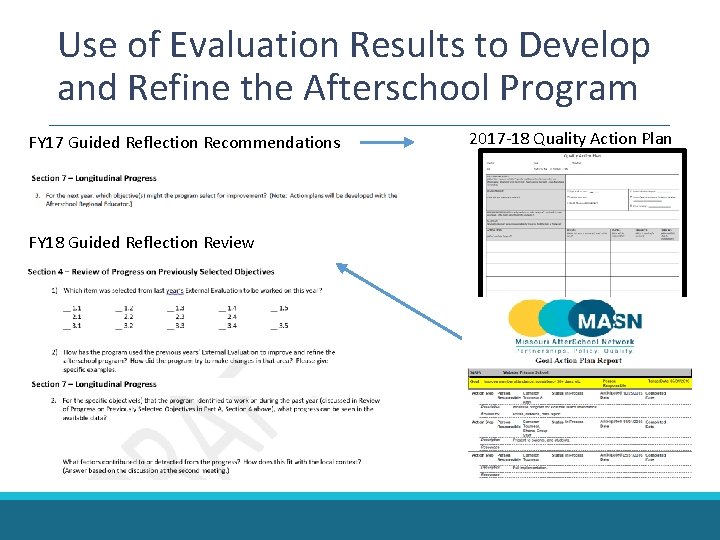
Use of Evaluation Results to Develop and Refine the Afterschool Program FY 17 Guided Reflection Recommendations FY 18 Guided Reflection Review 2017 -18 Quality Action Plan
Local External Evaluation
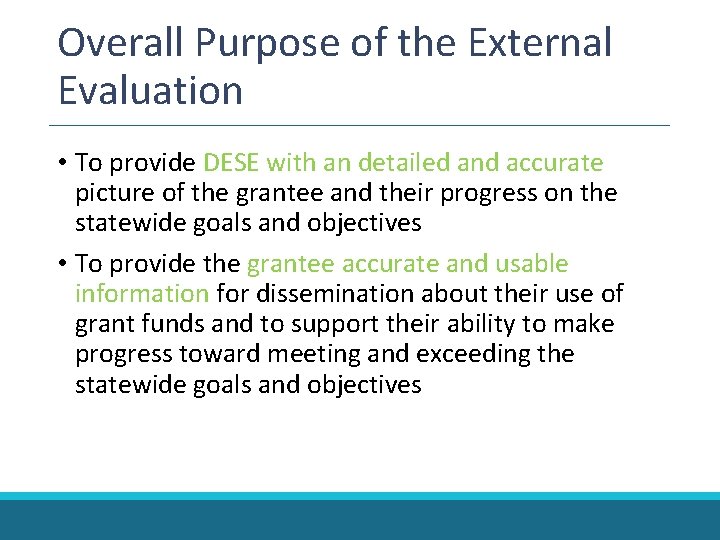
Overall Purpose of the External Evaluation • To provide DESE with an detailed and accurate picture of the grantee and their progress on the statewide goals and objectives • To provide the grantee accurate and usable information for dissemination about their use of grant funds and to support their ability to make progress toward meeting and exceeding the statewide goals and objectives
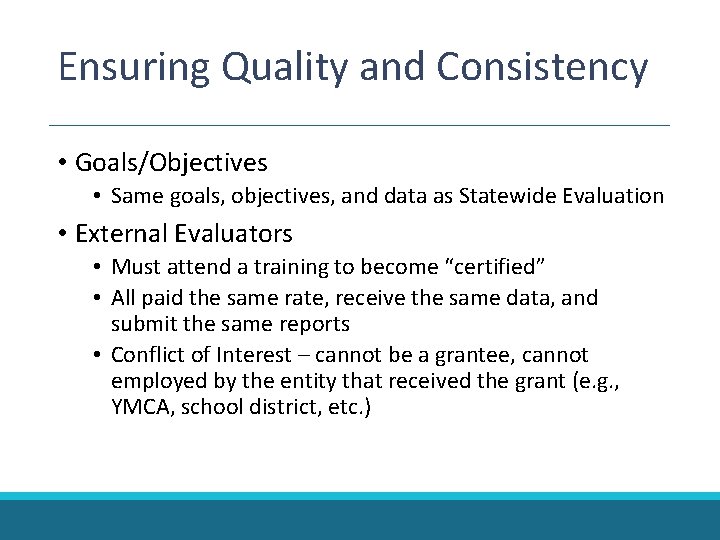
Ensuring Quality and Consistency • Goals/Objectives • Same goals, objectives, and data as Statewide Evaluation • External Evaluators • Must attend a training to become “certified” • All paid the same rate, receive the same data, and submit the same reports • Conflict of Interest – cannot be a grantee, cannot employed by the entity that received the grant (e. g. , YMCA, school district, etc. )
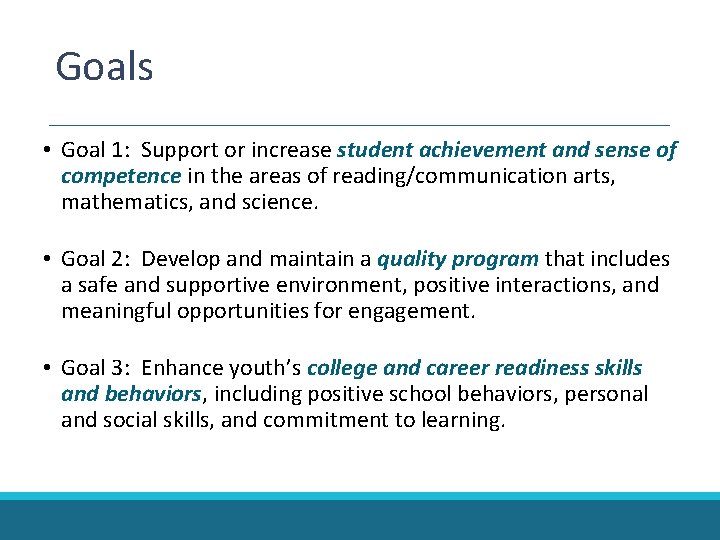
Goals • Goal 1: Support or increase student achievement and sense of competence in the areas of reading/communication arts, mathematics, and science. • Goal 2: Develop and maintain a quality program that includes a safe and supportive environment, positive interactions, and meaningful opportunities for engagement. • Goal 3: Enhance youth’s college and career readiness skills and behaviors, including positive school behaviors, personal and social skills, and commitment to learning.
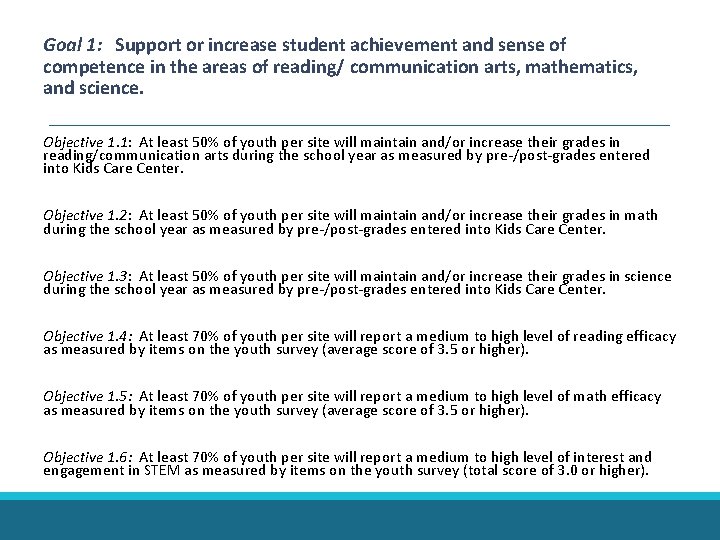
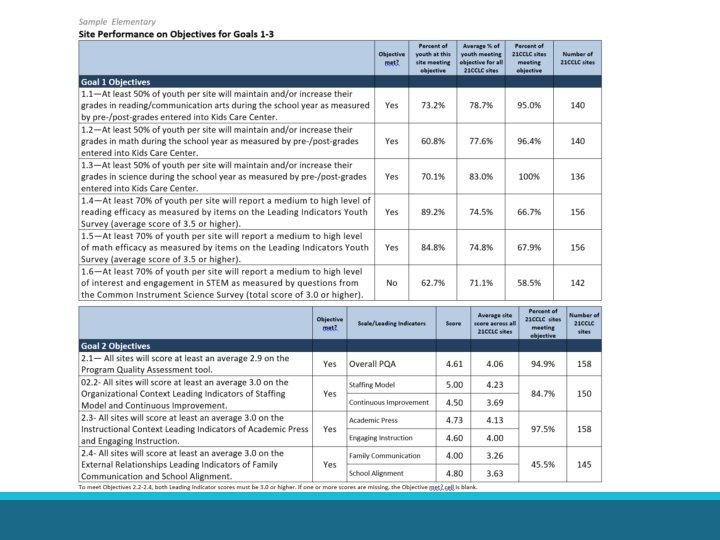
Goal 1: Support or increase student achievement and sense of competence in the areas of reading/ communication arts, mathematics, and science. Objective 1. 1: At least 50% of youth per site will maintain and/or increase their grades in reading/communication arts during the school year as measured by pre-/post-grades entered into Kids Care Center. Objective 1. 2: At least 50% of youth per site will maintain and/or increase their grades in math during the school year as measured by pre-/post-grades entered into Kids Care Center. Objective 1. 3: At least 50% of youth per site will maintain and/or increase their grades in science during the school year as measured by pre-/post-grades entered into Kids Care Center. Objective 1. 4: At least 70% of youth per site will report a medium to high level of reading efficacy as measured by items on the youth survey (average score of 3. 5 or higher). Objective 1. 5: At least 70% of youth per site will report a medium to high level of math efficacy as measured by items on the youth survey (average score of 3. 5 or higher). Objective 1. 6: At least 70% of youth per site will report a medium to high level of interest and engagement in STEM as measured by items on the youth survey (total score of 3. 0 or higher).
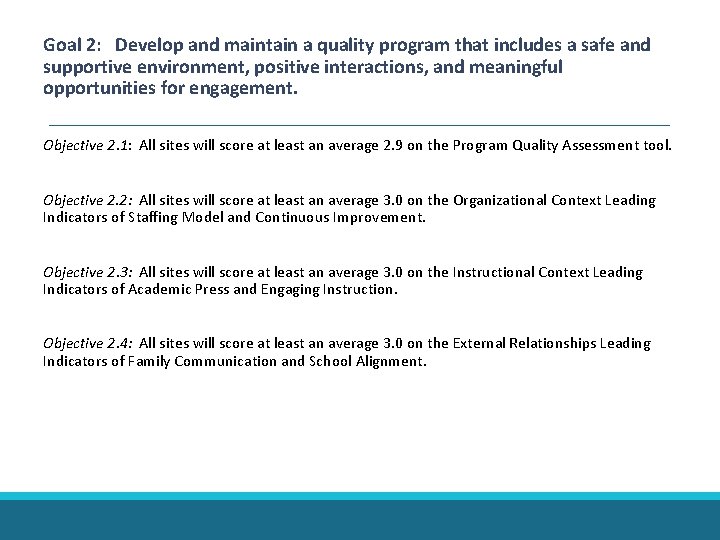
Goal 2: Develop and maintain a quality program that includes a safe and supportive environment, positive interactions, and meaningful opportunities for engagement. Objective 2. 1: All sites will score at least an average 2. 9 on the Program Quality Assessment tool. Objective 2. 2: All sites will score at least an average 3. 0 on the Organizational Context Leading Indicators of Staffing Model and Continuous Improvement. Objective 2. 3: All sites will score at least an average 3. 0 on the Instructional Context Leading Indicators of Academic Press and Engaging Instruction. Objective 2. 4: All sites will score at least an average 3. 0 on the External Relationships Leading Indicators of Family Communication and School Alignment.
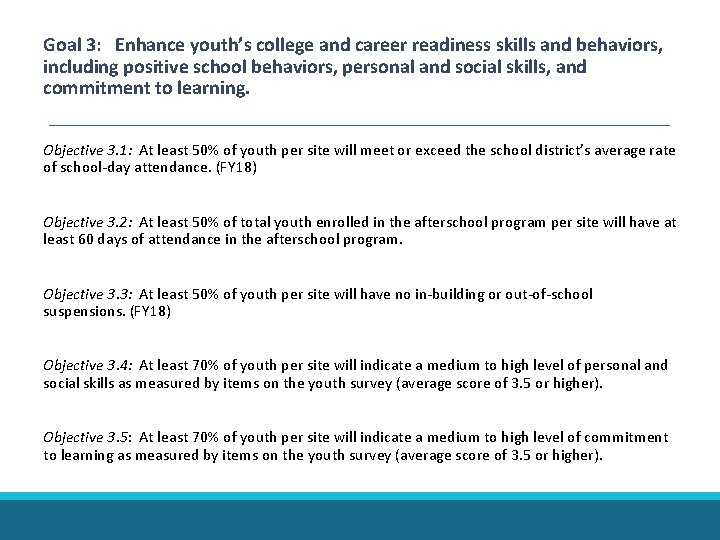
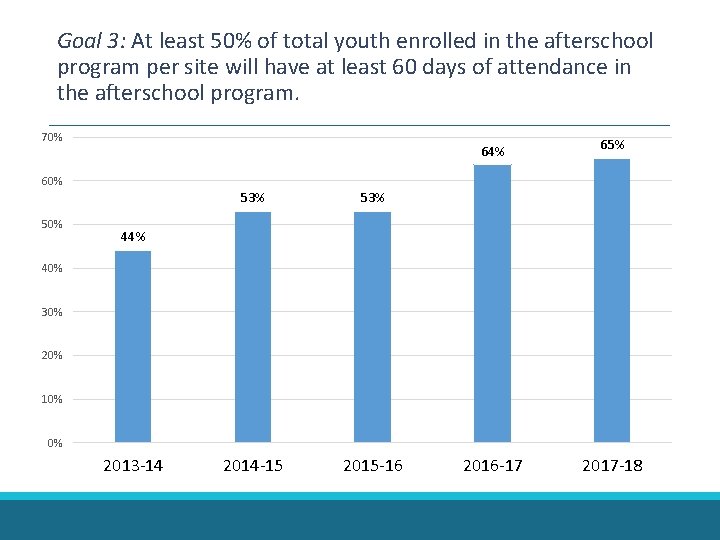
Goal 3: Enhance youth’s college and career readiness skills and behaviors, including positive school behaviors, personal and social skills, and commitment to learning. Objective 3. 1: At least 50% of youth per site will meet or exceed the school district’s average rate of school-day attendance. (FY 18) Objective 3. 2: At least 50% of total youth enrolled in the afterschool program per site will have at least 60 days of attendance in the afterschool program. Objective 3. 3: At least 50% of youth per site will have no in-building or out-of-school suspensions. (FY 18) Objective 3. 4: At least 70% of youth per site will indicate a medium to high level of personal and social skills as measured by items on the youth survey (average score of 3. 5 or higher). Objective 3. 5: At least 70% of youth per site will indicate a medium to high level of commitment to learning as measured by items on the youth survey (average score of 3. 5 or higher).
External Evaluation Products Guided Reflection Documentation Evaluation Summary Report
Audiences • Guided Reflection Documentation • DESE – Extended Learning • Program Administration • External Evaluation Summary • Superintendents/School Boards • Families • Community
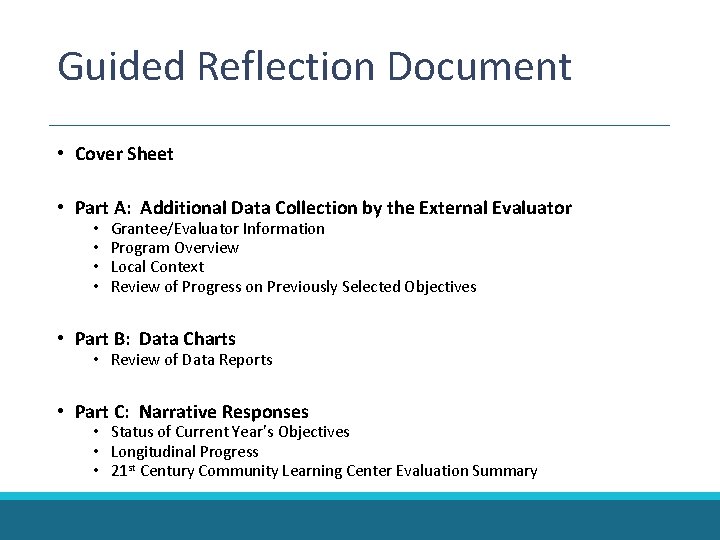
Guided Reflection Document • Cover Sheet • Part A: Additional Data Collection by the External Evaluator • • Grantee/Evaluator Information Program Overview Local Context Review of Progress on Previously Selected Objectives • Part B: Data Charts • Review of Data Reports • Part C: Narrative Responses • Status of Current Year’s Objectives • Longitudinal Progress • 21 st Century Community Learning Center Evaluation Summary
Evaluation Summary Report • 2 page summary of the external evaluation • Summarizes the status of the three goals • Target audience – school administration, families, public • Template provided with consistent language • Evaluator pulls it all together in one brief document
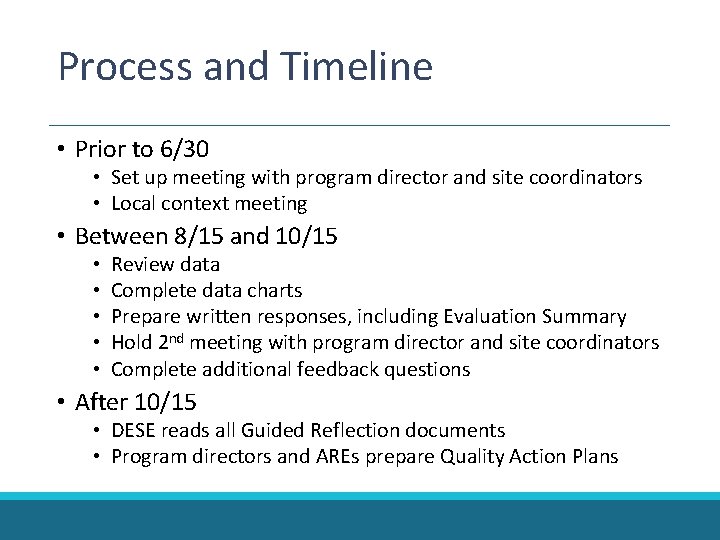
Process and Timeline • Prior to 6/30 • Set up meeting with program director and site coordinators • Local context meeting • Between 8/15 and 10/15 • • • Review data Complete data charts Prepare written responses, including Evaluation Summary Hold 2 nd meeting with program director and site coordinators Complete additional feedback questions • After 10/15 • DESE reads all Guided Reflection documents • Program directors and AREs prepare Quality Action Plans
Data Collection
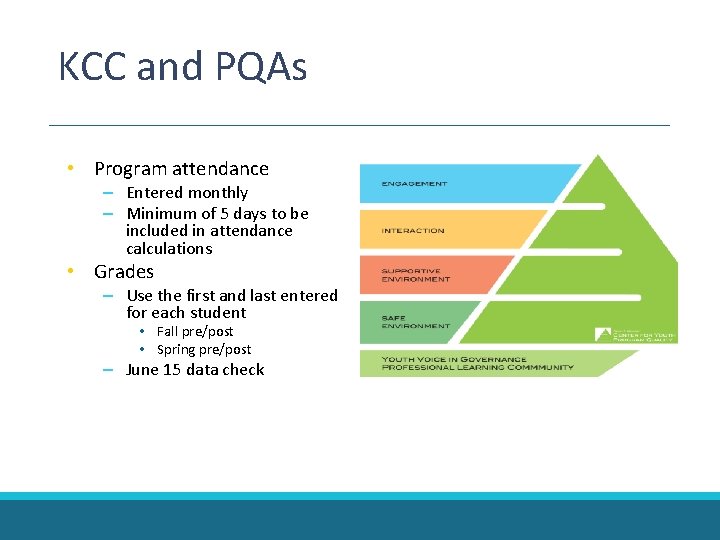
KCC and PQAs • Program attendance – Entered monthly – Minimum of 5 days to be included in attendance calculations • Grades – Use the first and last entered for each student • Fall pre/post • Spring pre/post – June 15 data check
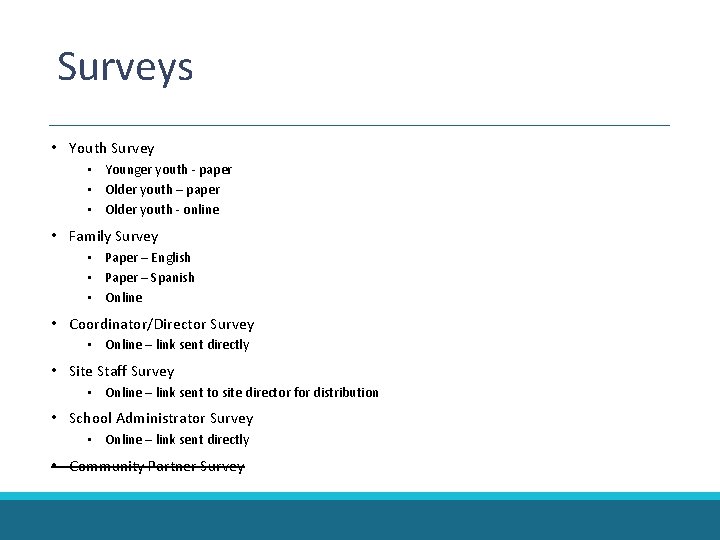
Surveys • Youth Survey • Younger youth - paper • Older youth – paper • Older youth - online • Family Survey • Paper – English • Paper – Spanish • Online • Coordinator/Director Survey • Online – link sent directly • Site Staff Survey • Online – link sent to site director for distribution • School Administrator Survey • Online – link sent directly • Community Partner Survey
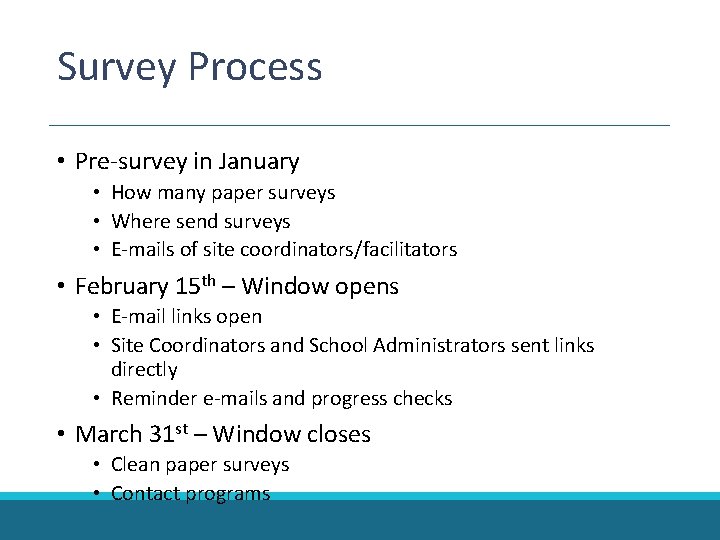
Survey Process • Pre-survey in January • How many paper surveys • Where send surveys • E-mails of site coordinators/facilitators • February 15 th – Window opens • E-mail links open • Site Coordinators and School Administrators sent links directly • Reminder e-mails and progress checks • March 31 st – Window closes • Clean paper surveys • Contact programs
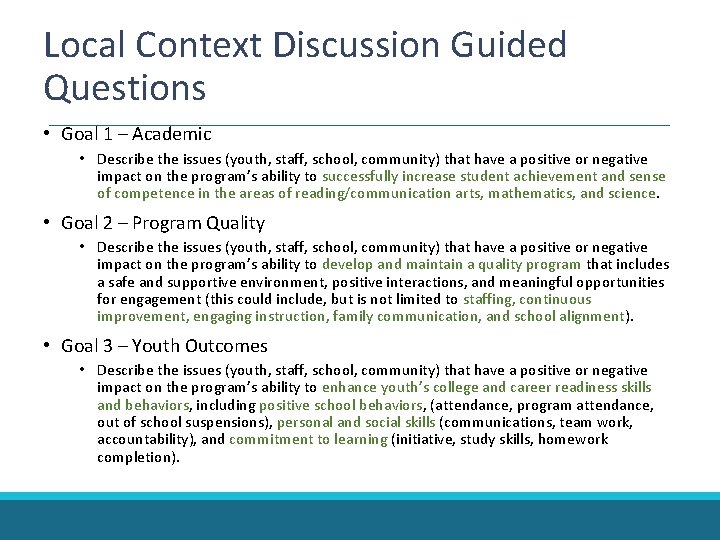
Local Context Discussion Guided Questions • Goal 1 – Academic • Describe the issues (youth, staff, school, community) that have a positive or negative impact on the program’s ability to successfully increase student achievement and sense of competence in the areas of reading/communication arts, mathematics, and science. • Goal 2 – Program Quality • Describe the issues (youth, staff, school, community) that have a positive or negative impact on the program’s ability to develop and maintain a quality program that includes a safe and supportive environment, positive interactions, and meaningful opportunities for engagement (this could include, but is not limited to staffing, continuous improvement, engaging instruction, family communication, and school alignment). • Goal 3 – Youth Outcomes • Describe the issues (youth, staff, school, community) that have a positive or negative impact on the program’s ability to enhance youth’s college and career readiness skills and behaviors, including positive school behaviors, (attendance, program attendance, out of school suspensions), personal and social skills (communications, team work, accountability), and commitment to learning (initiative, study skills, homework completion).
DESSA Data Collection
Who are we? Aperture Education specializes in social and emotional learning (SEL) solutions. Our flagship product, the DESSA Comprehensive SEL System, allows educators and parents to measure, strengthen, and support social-emotional competence of youth in grades K-12 both in school and in out-of-school settings. The DESSA System includes a suite of strength-based assessments, a universal screener that can be administered in less than a minute, and growth strategies and foundational practices to strengthen social-emotional competence. The DESSA System is lauded by researchers because it meets high standards for reliability and validity. It is appreciated by educators for its ability to easily and quickly identify each student's personal social-emotional strengths and provide practical supports that result in improved student outcomes.
The DESSA Comprehensive SEL System DESSA, DESSA-mini, DESSA-High School Edition, and DESSA-Second Step Edition
Strength-based Ø Assumes that every person has untapped resources that can improve conditions Ø We identify perceived relative strengths + work to improve conditions = higher perceived competence and intrinsic motivation Ø DESSA looks at the positive behaviors we want to see out of all children Ø Allows us to evaluate SEL skill development from a proactive position
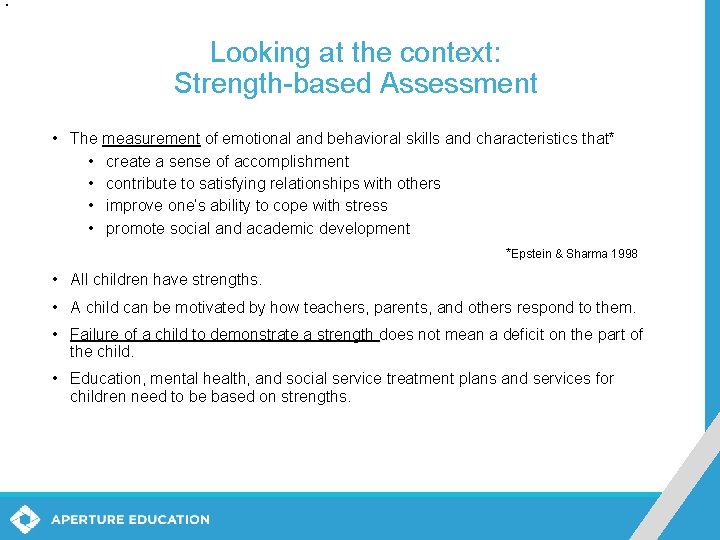
Looking at the context: Strength-based Assessment • The measurement of emotional and behavioral skills and characteristics that* • create a sense of accomplishment • contribute to satisfying relationships with others • improve one’s ability to cope with stress • promote social and academic development *Epstein & Sharma 1998 • All children have strengths. • A child can be motivated by how teachers, parents, and others respond to them. • Failure of a child to demonstrate a strength does not mean a deficit on the part of the child. • Education, mental health, and social service treatment plans and services for children need to be based on strengths.
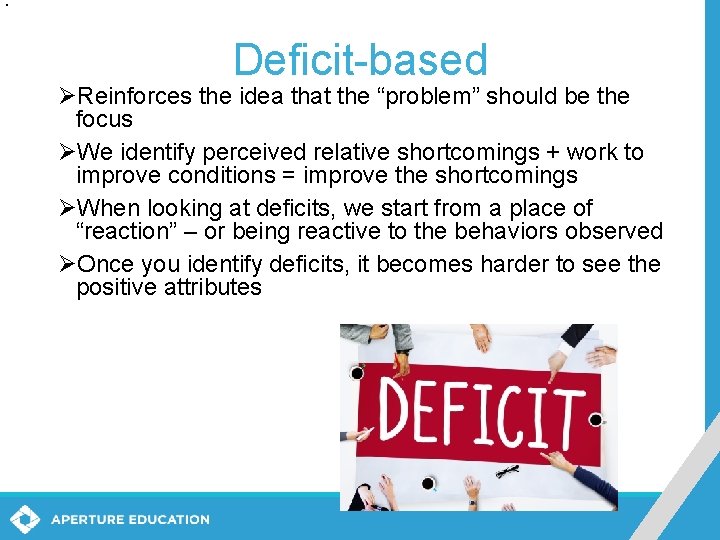
Deficit-based ØReinforces the idea that the “problem” should be the focus ØWe identify perceived relative shortcomings + work to improve conditions = improve the shortcomings ØWhen looking at deficits, we start from a place of “reaction” – or being reactive to the behaviors observed ØOnce you identify deficits, it becomes harder to see the positive attributes
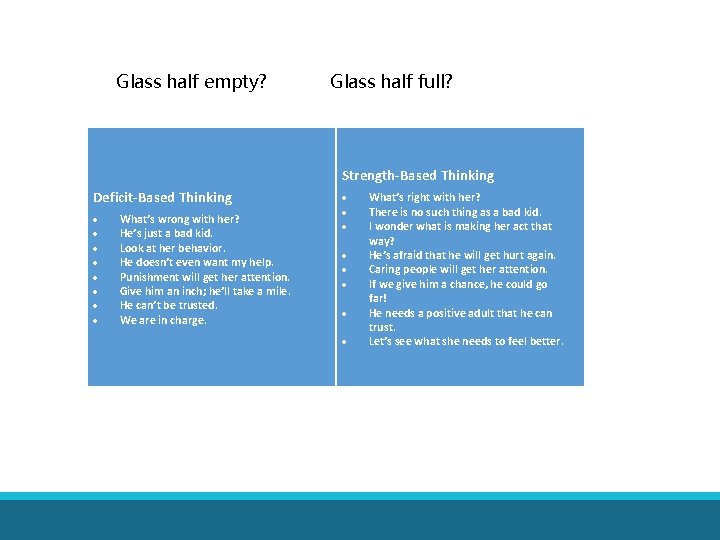
Glass half empty? Glass half full? Strength-Based Thinking Deficit-Based Thinking What’s wrong with her? He’s just a bad kid. Look at her behavior. He doesn’t even want my help. Punishment will get her attention. Give him an inch; he’ll take a mile. He can’t be trusted. We are in charge. What’s right with her? There is no such thing as a bad kid. I wonder what is making her act that way? He’s afraid that he will get hurt again. Caring people will get her attention. If we give him a chance, he could go far! He needs a positive adult that he can trust. Let’s see what she needs to feel better.
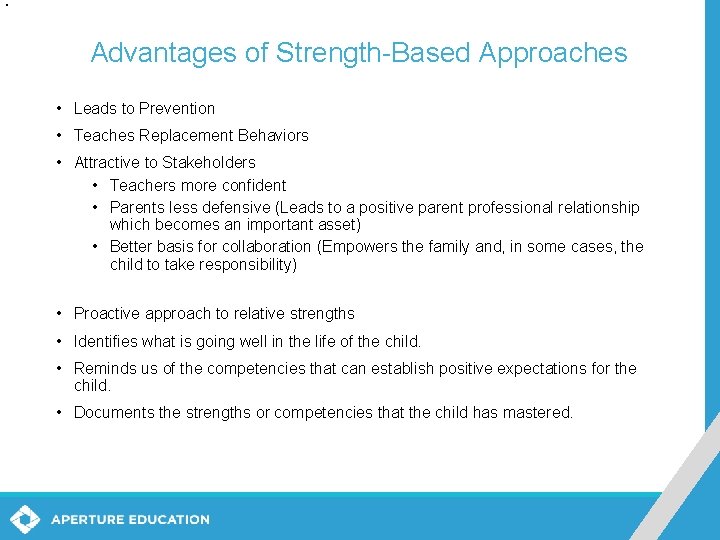
Advantages of Strength-Based Approaches • Leads to Prevention • Teaches Replacement Behaviors • Attractive to Stakeholders • Teachers more confident • Parents less defensive (Leads to a positive parent professional relationship which becomes an important asset) • Better basis for collaboration (Empowers the family and, in some cases, the child to take responsibility) • Proactive approach to relative strengths • Identifies what is going well in the life of the child. • Reminds us of the competencies that can establish positive expectations for the child. • Documents the strengths or competencies that the child has mastered.
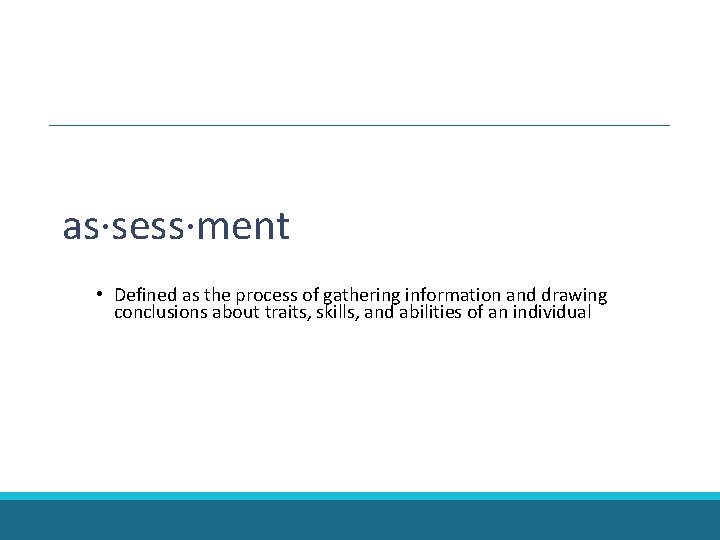
as·sess·ment • Defined as the process of gathering information and drawing conclusions about traits, skills, and abilities of an individual
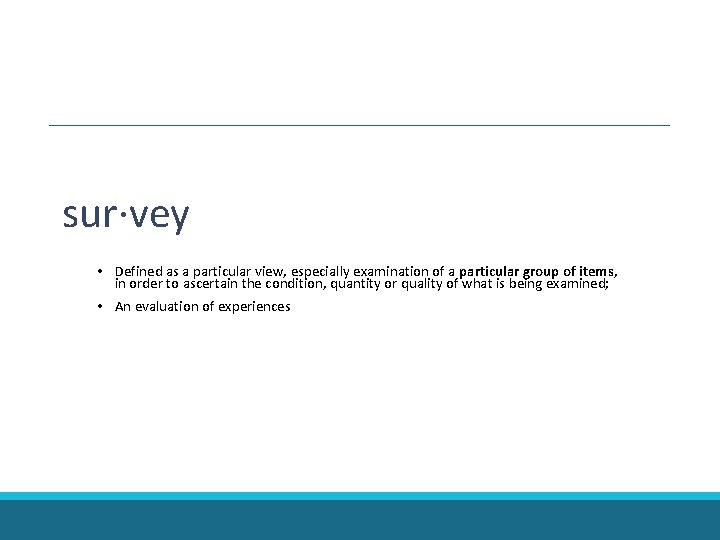
sur·vey • Defined as a particular view, especially examination of a particular group of items, in order to ascertain the condition, quantity or quality of what is being examined; • An evaluation of experiences
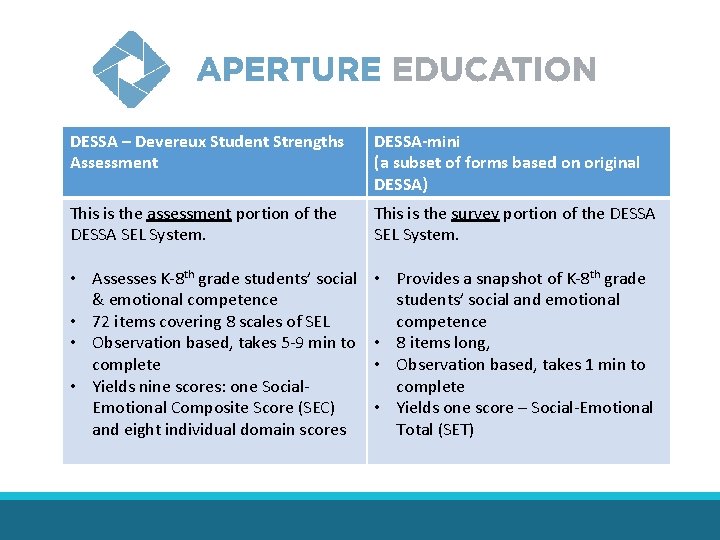
DESSA – Devereux Student Strengths Assessment DESSA-mini (a subset of forms based on original DESSA) This is the assessment portion of the DESSA SEL System. This is the survey portion of the DESSA SEL System. • Assesses K-8 th grade students’ social & emotional competence • 72 items covering 8 scales of SEL • Observation based, takes 5 -9 min to complete • Yields nine scores: one Social. Emotional Composite Score (SEC) and eight individual domain scores • Provides a snapshot of K-8 th grade students’ social and emotional competence • 8 items long, • Observation based, takes 1 min to complete • Yields one score – Social-Emotional Total (SET)
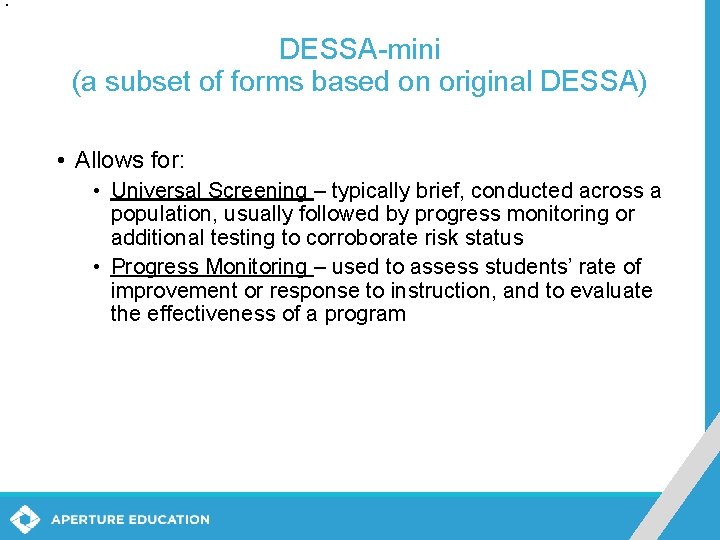
DESSA-mini (a subset of forms based on original DESSA) • Allows for: • Universal Screening – typically brief, conducted across a population, usually followed by progress monitoring or additional testing to corroborate risk status • Progress Monitoring – used to assess students’ rate of improvement or response to instruction, and to evaluate the effectiveness of a program
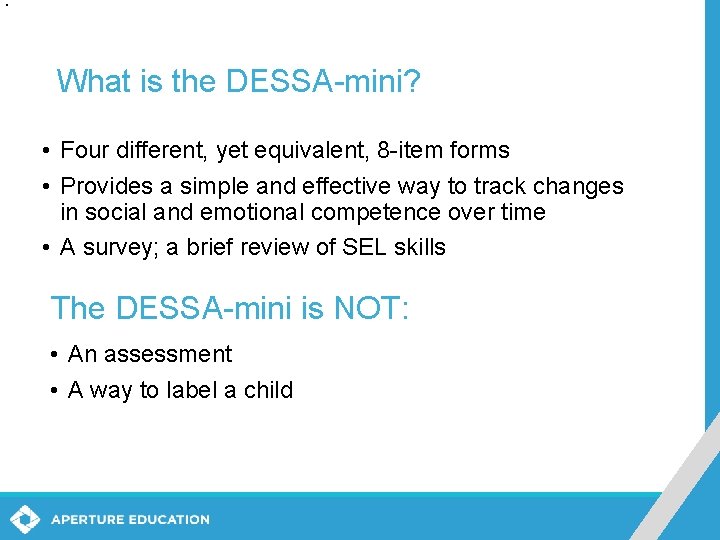
What is the DESSA-mini? • Four different, yet equivalent, 8 -item forms • Provides a simple and effective way to track changes in social and emotional competence over time • A survey; a brief review of SEL skills The DESSA-mini is NOT: • An assessment • A way to label a child
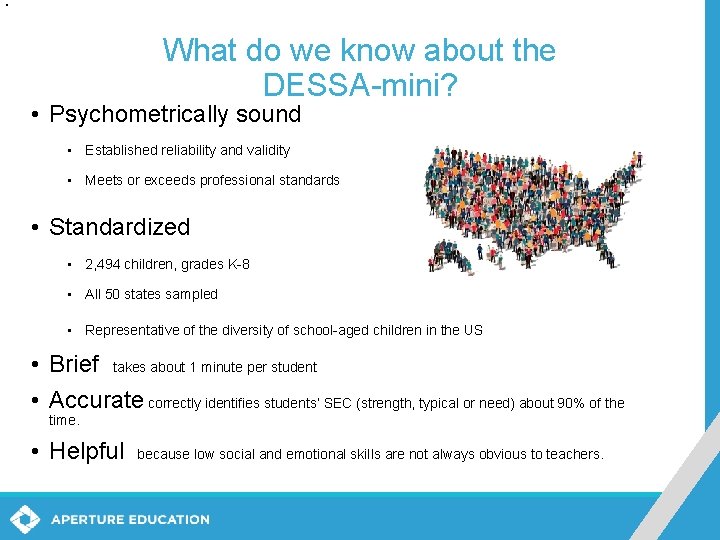
What do we know about the DESSA-mini? • Psychometrically sound • Established reliability and validity • Meets or exceeds professional standards • Standardized • 2, 494 children, grades K-8 • All 50 states sampled • Representative of the diversity of school-aged children in the US • Brief takes about 1 minute per student • Accurate correctly identifies students’ SEC (strength, typical or need) about 90% of the time. • Helpful because low social and emotional skills are not always obvious to teachers.
Statewide Evaluation Results over Time
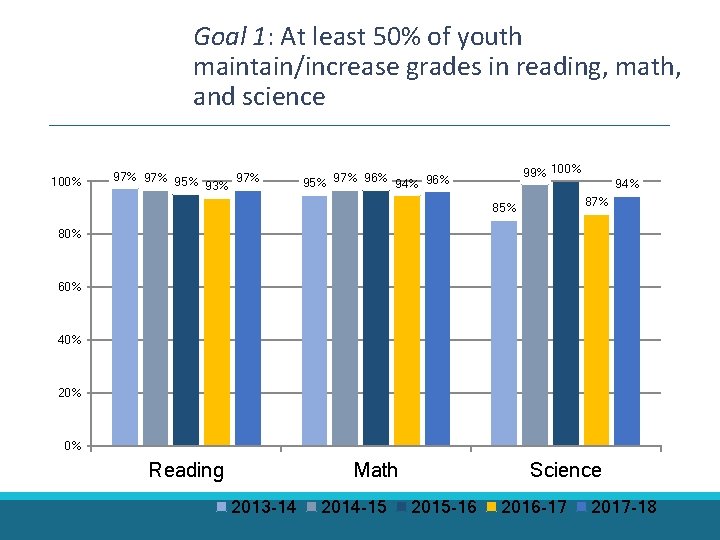
Goal 1: At least 50% of youth maintain/increase grades in reading, math, and science 100% 97% 95% 97% 93% 99% 100% 95% 97% 96% 94% 87% 85% 80% 60% 40% 20% 0% Reading Math 2013 -14 2014 -15 Science 2015 -16 2016 -17 2017 -18
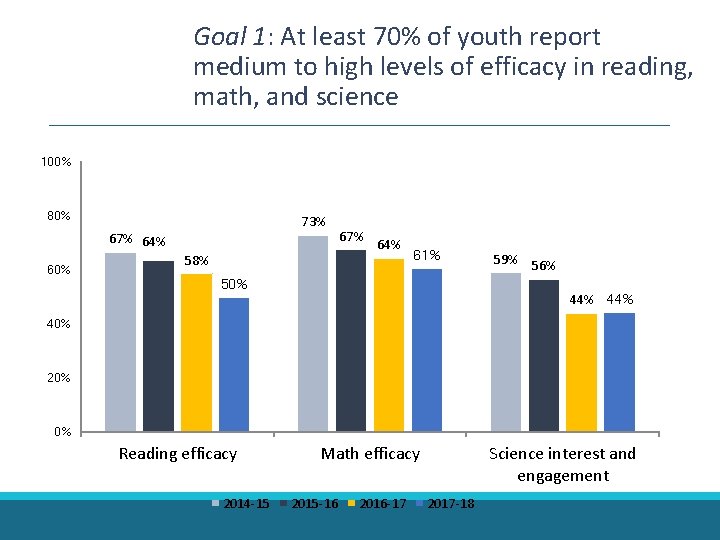
Goal 1: At least 70% of youth report medium to high levels of efficacy in reading, math, and science 100% 80% 73% 67% 64% 60% 58% 67% 64% 61% 50% 59% 56% 44% 40% 20% 0% Reading efficacy 2014 -15 Math efficacy 2015 -16 2016 -17 Science interest and engagement 2017 -18
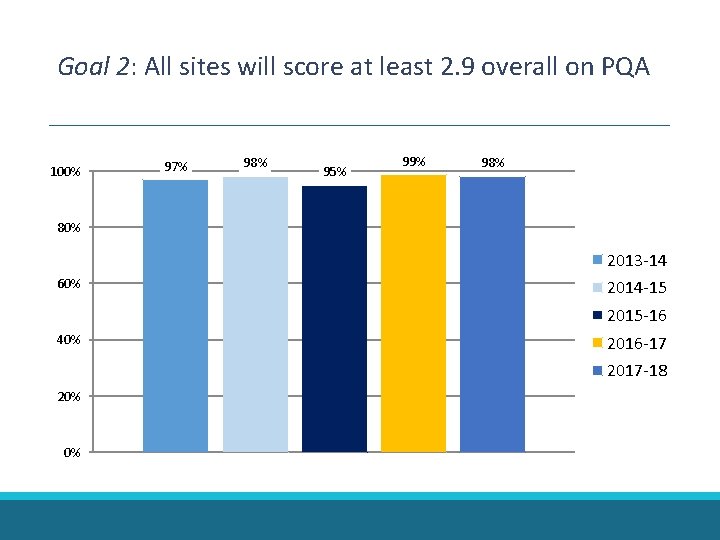
Goal 2: All sites will score at least 2. 9 overall on PQA 100% 97% 98% 95% 99% 98% 80% 2013 -14 60% 2014 -15 2015 -16 40% 2016 -17 2017 -18 20% 0%
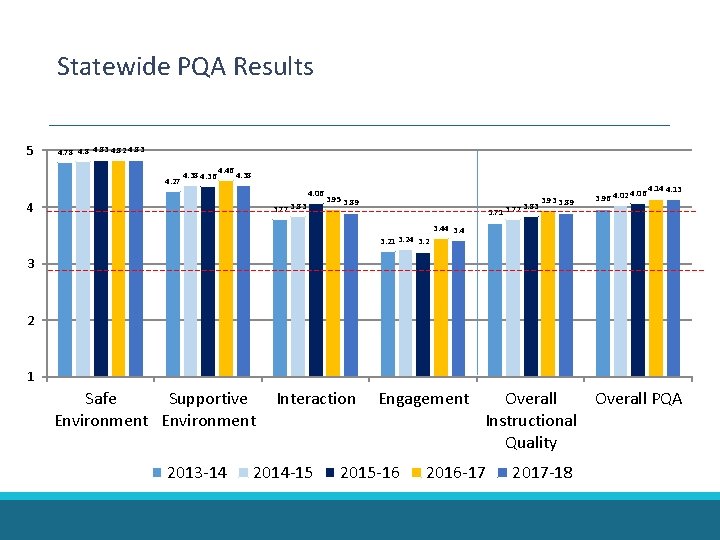
Statewide PQA Results 5 4. 78 4. 83 4. 82 4. 83 4. 27 4. 38 4. 36 4. 46 4. 38 4. 06 4 3. 77 3. 83 3. 95 3. 89 3. 71 3. 77 3. 21 3. 24 3. 2 3. 83 3. 93 3. 89 3. 96 4. 02 4. 06 4. 14 4. 13 3. 44 3. 4 3 2 1 Safe Supportive Environment 2013 -14 Interaction 2014 -15 Engagement 2015 -16 Overall PQA Instructional Quality 2016 -17 2017 -18
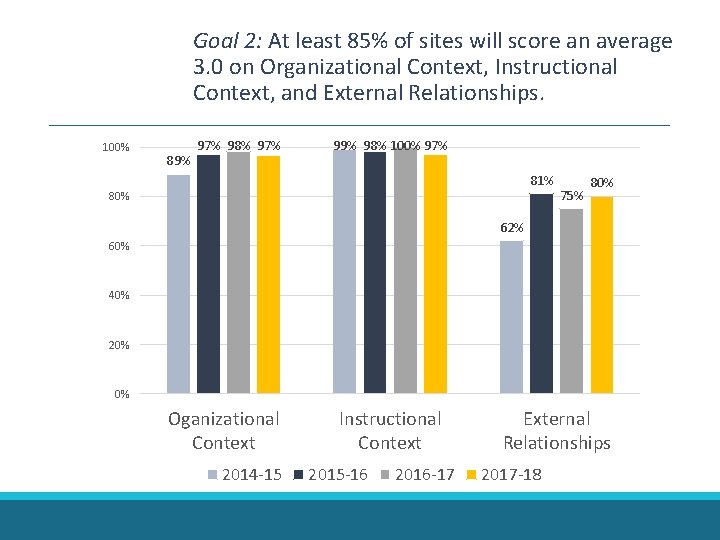
Goal 2: At least 85% of sites will score an average 3. 0 on Organizational Context, Instructional Context, and External Relationships. 100% 89% 97% 98% 97% 99% 98% 100% 97% 81% 80% 75% 80% 62% 60% 40% 20% 0% Oganizational Context 2014 -15 Instructional Context 2015 -16 2016 -17 External Relationships 2017 -18
Goal 3: At least 50% of total youth enrolled in the afterschool program per site will have at least 60 days of attendance in the afterschool program. 70% 64% 65% 2016 -17 2017 -18 60% 53% 53% 2014 -15 2015 -16 44% 40% 30% 20% 10% 0% 2013 -14
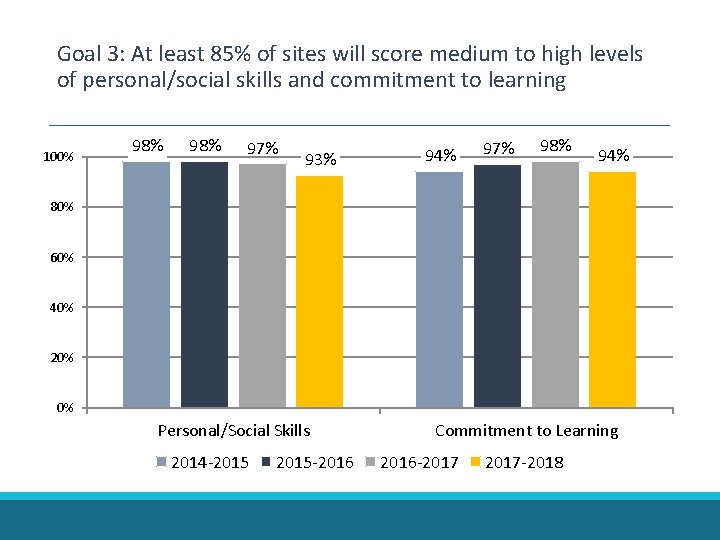
Goal 3: At least 85% of sites will score medium to high levels of personal/social skills and commitment to learning 100% 98% 97% 93% 94% 97% 98% 94% 80% 60% 40% 20% 0% Personal/Social Skills 2014 -2015 -2016 Commitment to Learning 2016 -2017 -2018
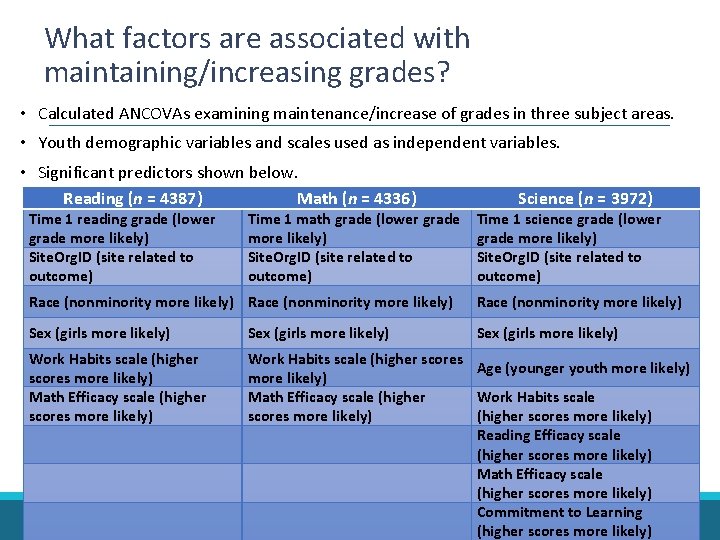
What factors are associated with maintaining/increasing grades? • Calculated ANCOVAs examining maintenance/increase of grades in three subject areas. • Youth demographic variables and scales used as independent variables. • Significant predictors shown below. Reading (n = 4387) Math (n = 4336) Time 1 reading grade (lower grade more likely) Site. Org. ID (site related to outcome) Time 1 math grade (lower grade more likely) Site. Org. ID (site related to outcome) Science (n = 3972) Time 1 science grade (lower grade more likely) Site. Org. ID (site related to outcome) Race (nonminority more likely) Sex (girls more likely) Work Habits scale (higher scores more likely) Math Efficacy scale (higher scores more likely) Work Habits scale (higher scores Age (younger youth more likely) Math Efficacy scale (higher Work Habits scale scores more likely) (higher scores more likely) Reading Efficacy scale (higher scores more likely) Math Efficacy scale (higher scores more likely) Commitment to Learning (higher scores more likely)
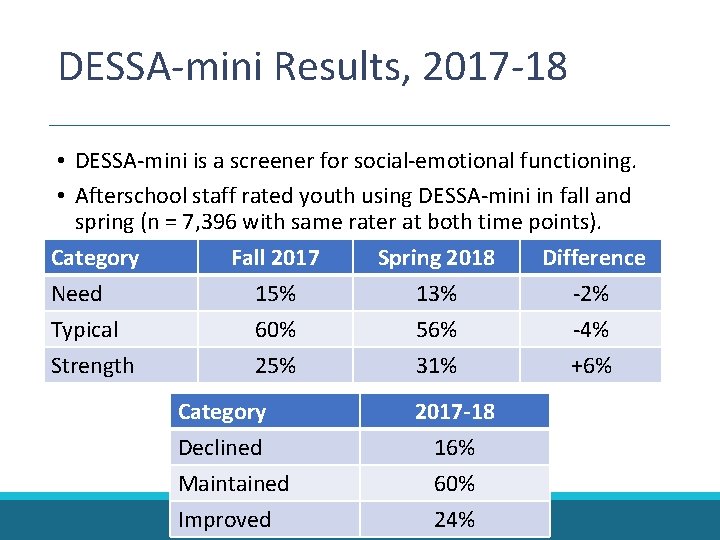
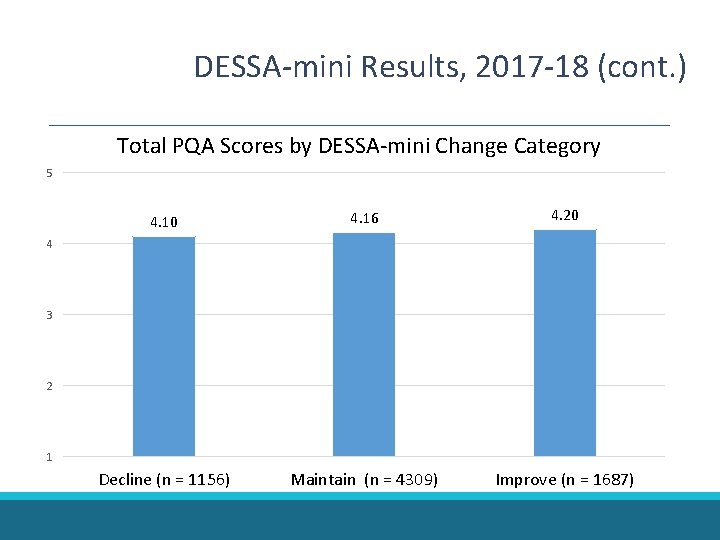
DESSA-mini Results, 2017 -18 • DESSA-mini is a screener for social-emotional functioning. • Afterschool staff rated youth using DESSA-mini in fall and spring (n = 7, 396 with same rater at both time points). Category Fall 2017 Spring 2018 Difference Need 15% 13% -2% Typical 60% 56% -4% Strength 25% 31% +6% Category Declined Maintained Improved 2017 -18 16% 60% 24%
DESSA-mini Results, 2017 -18 (cont. ) Total PQA Scores by DESSA-mini Change Category 5 4. 10 4. 16 4. 20 Decline (n = 1156) Maintain (n = 4309) Improve (n = 1687) 4 3 2 1
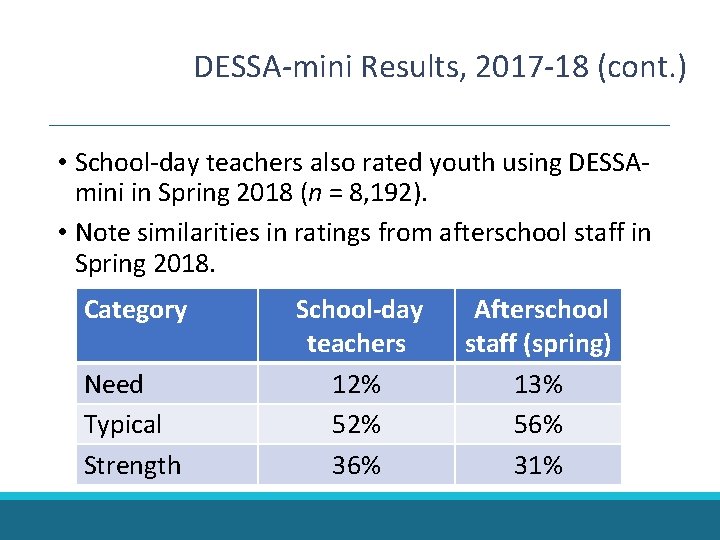
DESSA-mini Results, 2017 -18 (cont. ) • School-day teachers also rated youth using DESSAmini in Spring 2018 (n = 8, 192). • Note similarities in ratings from afterschool staff in Spring 2018. Category Need Typical Strength School-day teachers 12% 52% 36% Afterschool staff (spring) 13% 56% 31%
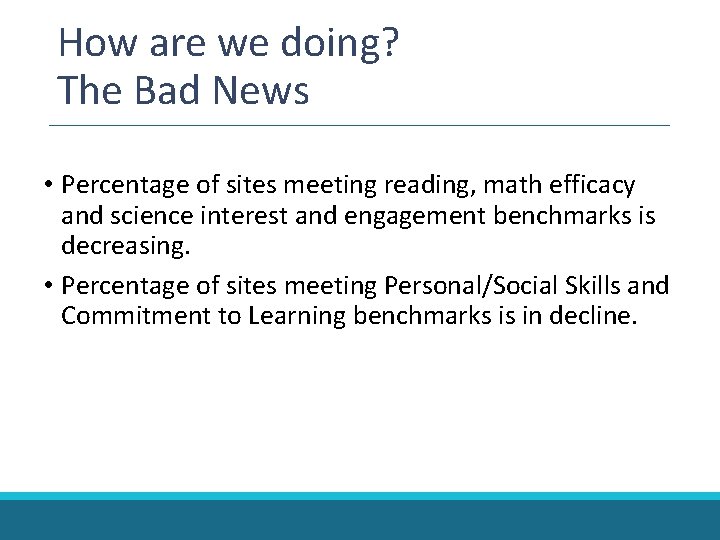
How are we doing? The Bad News • Percentage of sites meeting reading, math efficacy and science interest and engagement benchmarks is decreasing. • Percentage of sites meeting Personal/Social Skills and Commitment to Learning benchmarks is in decline.
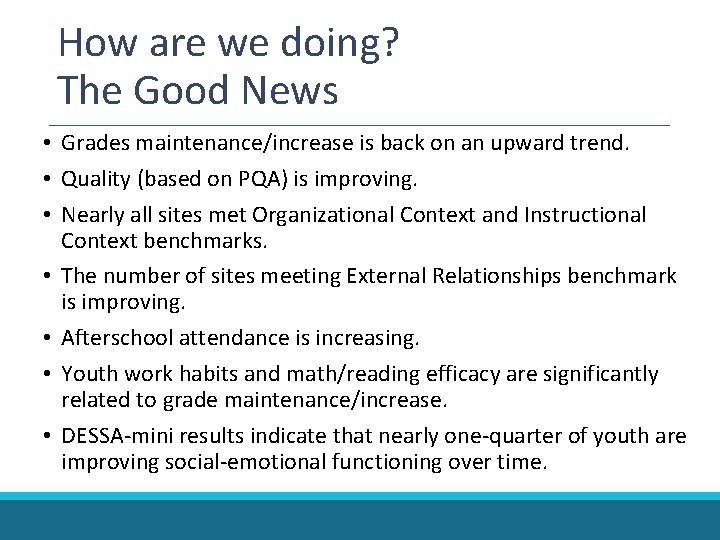
How are we doing? The Good News • Grades maintenance/increase is back on an upward trend. • Quality (based on PQA) is improving. • Nearly all sites met Organizational Context and Instructional Context benchmarks. • The number of sites meeting External Relationships benchmark is improving. • Afterschool attendance is increasing. • Youth work habits and math/reading efficacy are significantly related to grade maintenance/increase. • DESSA-mini results indicate that nearly one-quarter of youth are improving social-emotional functioning over time.
Program Improvement Efforts based on the Guided Reflection Process
Comprehensive Data Collection and Improvement Framework
Use of Evaluation Results to Develop and Refine the Afterschool Program FY 17 Guided Reflection Recommendations FY 18 Guided Reflection Review 2017 -18 Quality Action Plan
Using DESSA Data to Drive SEL Instruction
How does this help my organization?
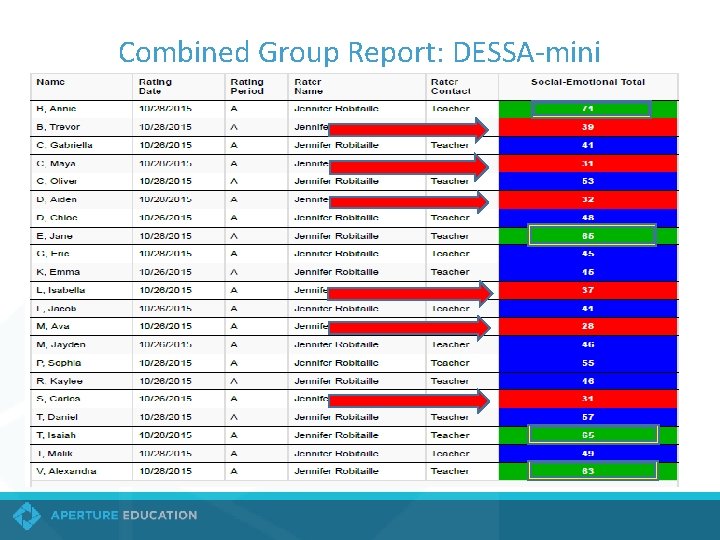
Combined Group Report: DESSA-mini
…Introducing Aperture Education’s online social and emotional learning assessment and intervention system
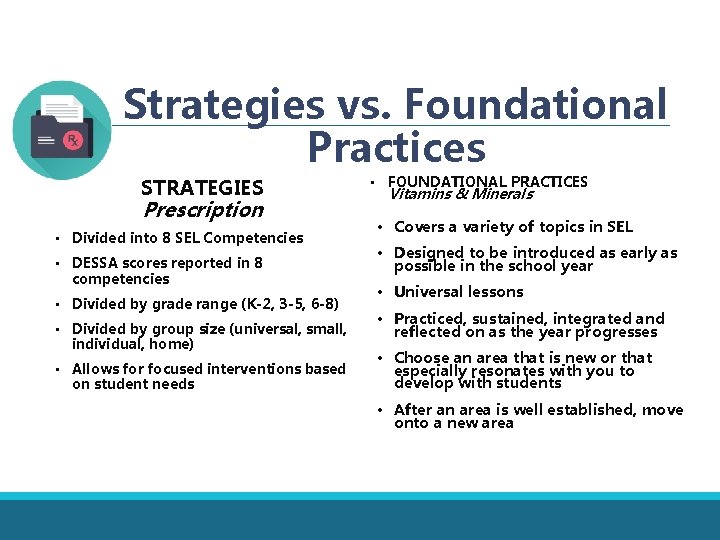
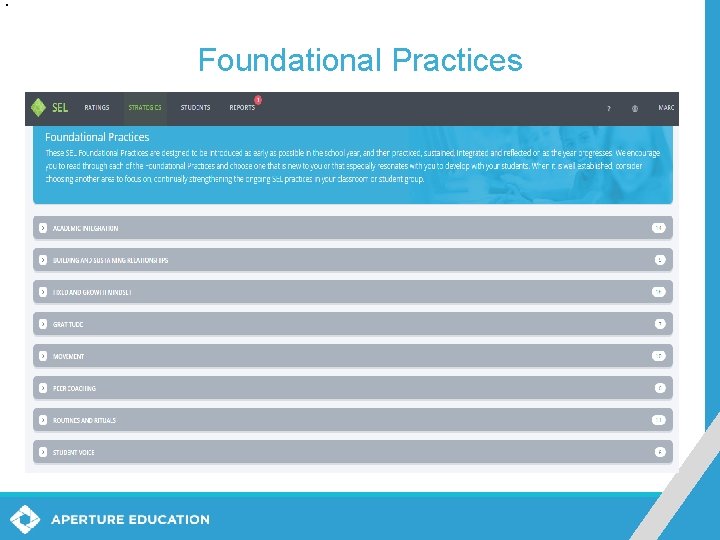
Strategies vs. Foundational Practices STRATEGIES Prescription • Divided into 8 SEL Competencies • DESSA scores reported in 8 competencies • Divided by grade range (K-2, 3 -5, 6 -8) • Divided by group size (universal, small, individual, home) • Allows for focused interventions based on student needs • FOUNDATIONAL PRACTICES Vitamins & Minerals • Covers a variety of topics in SEL • Designed to be introduced as early as possible in the school year • Universal lessons • Practiced, sustained, integrated and reflected on as the year progresses • Choose an area that is new or that especially resonates with you to develop with students • After an area is well established, move onto a new area
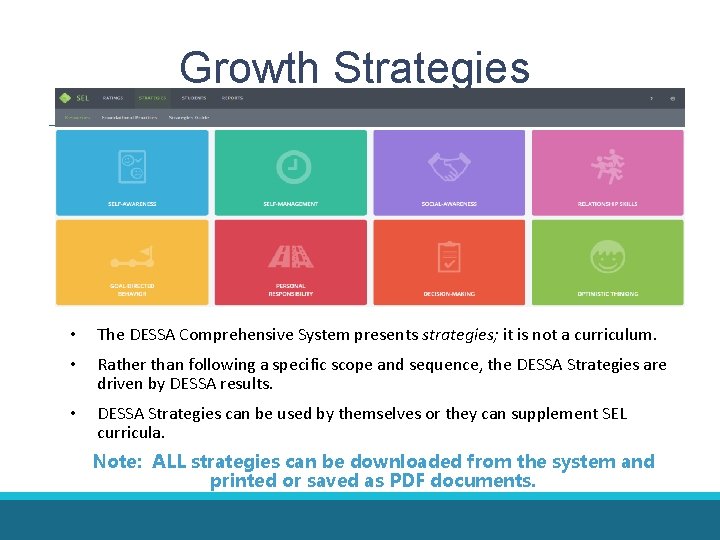
Growth Strategies • The DESSA Comprehensive System presents strategies; it is not a curriculum. • Rather than following a specific scope and sequence, the DESSA Strategies are driven by DESSA results. • DESSA Strategies can be used by themselves or they can supplement SEL curricula. Note: ALL strategies can be downloaded from the system and printed or saved as PDF documents.
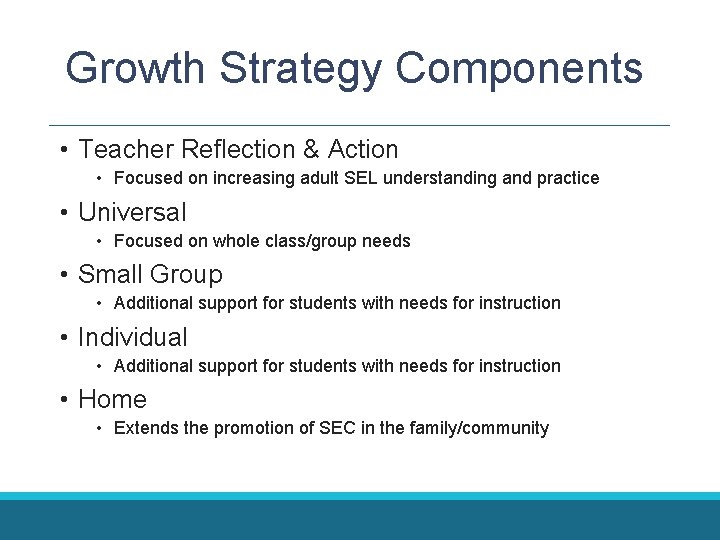
Growth Strategy Components • Teacher Reflection & Action • Focused on increasing adult SEL understanding and practice • Universal • Focused on whole class/group needs • Small Group • Additional support for students with needs for instruction • Individual • Additional support for students with needs for instruction • Home • Extends the promotion of SEC in the family/community
Foundational Practices
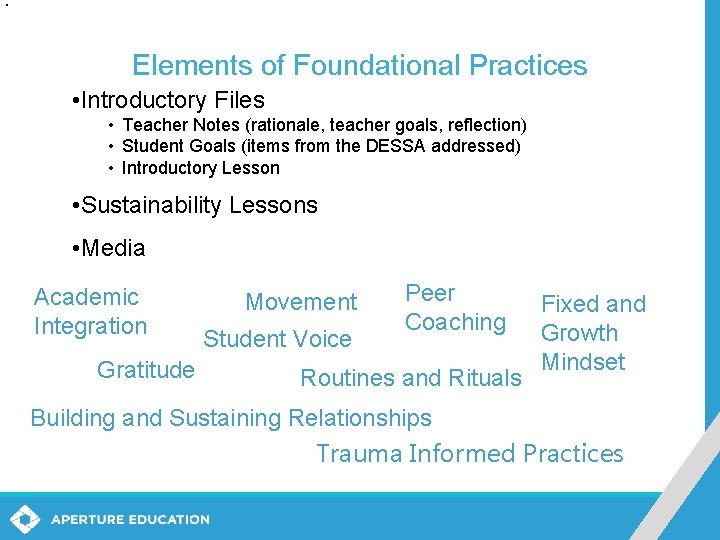
Elements of Foundational Practices • Introductory Files • Teacher Notes (rationale, teacher goals, reflection) • Student Goals (items from the DESSA addressed) • Introductory Lesson • Sustainability Lessons • Media Academic Integration Gratitude Movement Student Voice Peer Coaching Routines and Rituals Fixed and Growth Mindset Building and Sustaining Relationships Trauma Informed Practices
Planning for Social Emotional Success
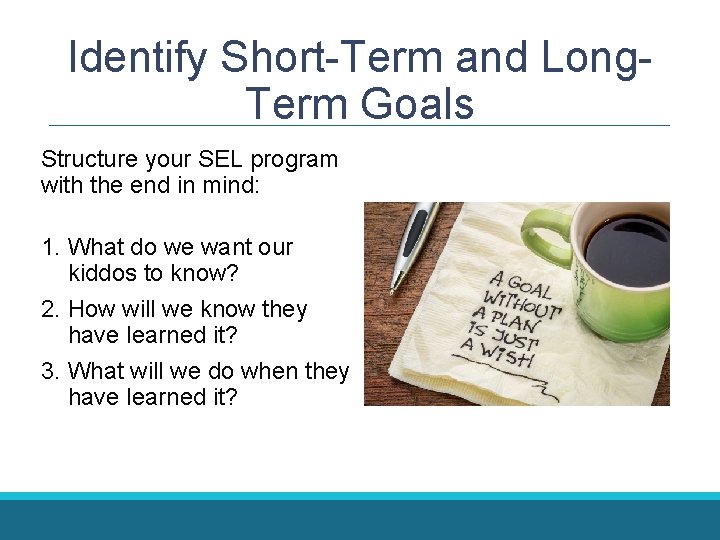
Identify Short-Term and Long. Term Goals Structure your SEL program with the end in mind: 1. What do we want our kiddos to know? 2. How will we know they have learned it? 3. What will we do when they have learned it?
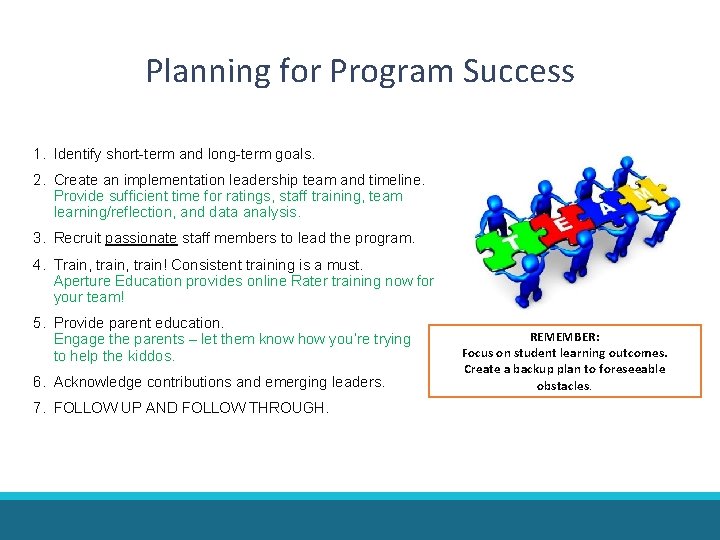
Planning for Program Success 1. Identify short-term and long-term goals. 2. Create an implementation leadership team and timeline. Provide sufficient time for ratings, staff training, team learning/reflection, and data analysis. 3. Recruit passionate staff members to lead the program. 4. Train, train! Consistent training is a must. Aperture Education provides online Rater training now for your team! 5. Provide parent education. Engage the parents – let them know how you’re trying to help the kiddos. 6. Acknowledge contributions and emerging leaders. 7. FOLLOW UP AND FOLLOW THROUGH. REMEMBER: Focus on student learning outcomes. Create a backup plan to foreseeable obstacles.
How does this help the kids? • SEL skill attainment can help predict serious disciplinary infractions (assaults, threats, weapons policy violations, possession of controlled substances) • Students identified as having a Need for Instruction on the DESSA-mini in October were 4. 5 times more likely to have a record of serious infraction by the end of the school year compared to students not identified to be in the Need for Instruction range *(Citation: Shapiro, V. B. , Kim, B. K. E. , Robitaille, J. L. , & Le. Buffe, P. A. (2016). Protective factor screening for prevention practice: Sensitivity and specificity of the DESSA-Mini. School Psychology Quarterly. Advance online publication. http: //dx. doi. org/10. 1037/spq 0000181 ) • Improving SEL skills have been correlated to: • • improved math & reading proficiency scores Decreased office referrals, decreased number of suspensions Decreased chronic absenteeism Improved graduation rates
Want to learn more about Growth Strategies and Foundational Practices? Support Documents Breakout Session • Growing SEL Through Program Planning • 3: 00 – 4: 00 pm & 4: 15 pm – 5: 15 pm • Room: Parasol II • Will email out to all attendees: • Strategies 101 • Sample Strategies • Sample Foundational Practices • Site Administrator Guidebook
www. apertureed. com 1 -844 -685 -2499 Karen De. Chant Ross, Account Executive kross@apertureed. com 980. 201. 8973