MODULE 2 THE SCIENTIFIC RESEARCH PROPOSAL Outcomes SE1


 Notes Accuracy The extent to which a measured value")


 There")


 More information LHC (Large Hadron")

, associated with")
, assess the")
- Slides: 90
MODULE 2 THE SCIENTIFIC RESEARCH PROPOSAL
Outcomes • SE-1 refines and applies the Working Scientifically processes in relation to scientific research • SE-3 interrogates relevant and valid peer-reviewed scientific research to develop a scientific research question, hypothesis, proposal and plan • SE-4 uses statistical applications, mathematical processes and/or modelling to gather, process, analyse and represent reliable and valid datasets • SE-5 analyses and applies the processes used in reliable and valid scientific research to solve complex scientific problems and inform further research • SE-6 analyses and reports on a contemporary issue or an application of science informed by either primary or secondary-sourced data, or both, in relation to relevant publicly available data sets • SE-7 communicates analysis of an argument or conclusion incorporating appropriate scientific language and referencing techniques in a scientific report
Students: conduct an initial literature search, from one or more areas of science, to identify the potential use of a contemporary, relevant publicly available data set develop a scientific research question from the literature search formulate an initial scientific hypothesis based on the scientific research question
evaluate the resources associated with the initial scientific hypothesis derived from the literature in terms of: – the scope to perform an investigation to obtain primary data – the availability of secondary-sourced data – the availability of a relevant publicly available data set(s) – reliability and validity – assessing the current state of theory, concept, issue or problem being considered assess the process involved in the development of a scientific research question and relevant hypothesis
Content Focus I Scientific Research Question and Hypothesis Students are to propose a scientific research question that relates to one or more of the science disciplines, formulate a relevant hypothesis and conduct scientific research into an issue, problem, emerging theory or discovery, using relevant publicly available data sets. Students create a Scientific Research Portfolio to evidence and substantiate the research process.
Content II Focus Successful scientific research depends upon the quality of the scientific research question. It must be meaningful, significant and feasible and clearly guide the scientific research process. It should be framed with consideration of methodologies, data collection and processing issues. Students will learn to develop a question that enables scientific research by exploring peer-reviewed published literature for guidance. Students will be guided to undertake relevant scientific research and to develop a detailed plan that lays the foundations for the subsequent processes to be employed to address a developed hypothesis.
Scientific Research Proposal Inquiry question: How is scientific research planned, based on a relevant hypothesis? conduct a detailed literature review to support the validity, significance and appropriateness of the scientific research question formulate a final scientific hypothesis based on the scientific research question develop the rationale and possible outcomes for the chosen scientific research develop a detailed plan to investigate the scientific hypothesis including: – the overall strategy – methodology – data analysis – representation and communication of the scientific research – timelines – benchmarks
Critically analyse the scientific research plan to refine and make appropriate amendments employ accepted referencing protocols, for example: – APA – Harvard – MLA
Developing the Question and Hypothesis Inquiry question: What are the processes needed for developing a scientific research question and initial hypothesis?
How Science works
What is research?
The research process:
Mind map of the research process: https: //mm. tt/1127805598? t=6 WMz. Dozm. L 4
Literature Search • conduct an initial literature search, from one or more areas of science, to identify the potential use of a contemporary, relevant publicly available data set Choose an area of science Identify data sets that represent the area of choice… websites on the next page might help Ensure you record the websites used for future reference… we’ll be looking at referencing later
Journals for young Scientists Young Scientist journal - https: //ysjournal. com/ Science Journal for kids - http: //www. sciencejournalforkids. org/ *Frontiers for young minds - https: //kids. frontiersin. org/ The National High School Journal of Science - http: //nhsjs. com/ Journal of Emerging Investigators https: //www. emerginginvestigators. org/ ** The Student Journal of Science and Technology http: //journal. fsst. ca/jsst/index. php/jsst/pages/view/studentresearch ** Science in Schools - https: //www. scienceinschool. org/ Google scholar - https: //scholar. google. com. au/
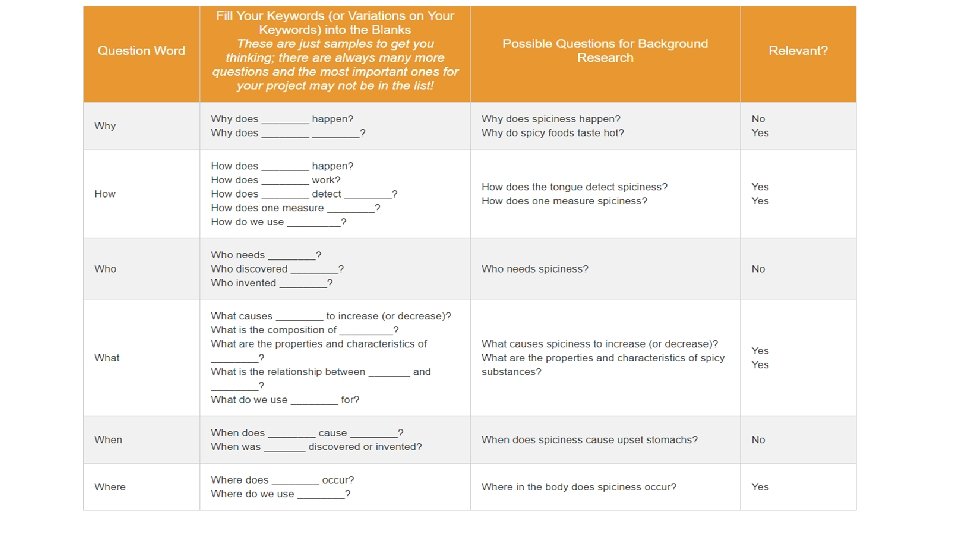
Scientific Research Question • develop a scientific research question from the literature search From the literature search and your chosen data set develop a scientific research questions.
Developing Research Questions Does drinking milk help decrease spiciness better than water or Pepsi? A scaffolded approach follows that demonstrate the process.
• formulate an initial scientific hypothesis based on the scientific research question Initial Scientific Hypothesis A scientific hypothesis is the initial building block in the scientific method. Many describe it as an "educated guess, " based on prior knowledge and observation. From your chosen data set formulate an initial scientific hypothesis
• evaluate the resources associated with the initial scientific hypothesis derived from the literature in terms of: - the scope to perform an investigation to obtain primary data - the availability of secondary-sourced data - the availability of a relevant publicly available data set(s) - reliability and validity - assessing the current state of theory, concept, issue or problem being considered
Resource Evaluation Evaluate resources to obtain information about your chosen hypothesis. Use the notes below to guide your evaluation.
Evaluating Data Term Definition Synonym(s) Notes Accuracy The extent to which a measured value agrees with its true value (i. e. Exact reference value). Precision The extent to which multiple measurements, made under identical or similar conditions, agree with each other (i. e. variations within a dataset). Internal reliability Measurement precision & Closeness Dispersion Instrument precision Spread Reliability The extent to which the findings of repeated experiments, conducted under identical or similar conditions, agree with each other. Consistency Repeatability Reproducibility Stability Sometimes referred to as external reliability Validity The extent to which an experiment addresses the question being investigated. Internal validity External validity: the extent to which the results of a study can be generalised Requires prior knowledge (i. e. reference values)
The Process Create a flow chart for the process used in the development of a scientific question and hypothesis. Assess the process used.
Scientific Research Proposal • Inquiry question: How is scientific research planned, based on a relevant hypothesis? • conduct a detailed literature review to support the validity, significance and appropriateness of the scientific research question Refer to “Developing a Literature Review” power point and notes.
formulate a final scientific hypothesis based on the scientific research question Scientific Hypothesis Scientific hypothesis, an idea that proposes a tentative explanation about a phenomenon or a narrow set of phenomena observed in the natural world. Formulate a final scientific hypothesis based on your research to date.
• develop the rationale and possible outcomes for the chosen scientific research Rationale and Possible Outcomes A rationale is simply your justification of the topic you chose. It explains why the research was performed in the first place. It is the very reason why you conducted the research Develop the rationale for your scientific question Outline possible outcomes for your scientific question
• The Chemistry Stage 6 Syllabus explores the structure, composition and reactions of and between all elements, compounds and mixtures that exist in the Universe. The discovery and synthesis of new compounds, the monitoring of elements and compounds in the environment, and an understanding of industrial processes and their applications to life processes are central to human progress and our ability to develop future industries and sustainability.
• develop a detailed plan to investigate the scientific hypothesis including: - the overall strategy - Methodology - data analysis - representation and communication of the scientific research - Timelines - benchmarks
The Plan Create a plan to investigate your scientific hypothesis that address all aspects of the syllabus point.
• critically analyse the scientific research plan to refine and make appropriate amendments Critical Analysis A critical analysis is subjective writing because it expresses the writer's opinion or evaluation of a text. Analysis means to break down and study the parts. Writing a critical paper requires two steps: critical reading and critical writing. Critical reading: Identify the author's thesis and purpose
Look at your own plan… What issues might arise How can it be improved
• employ accepted referencing protocols, for example: - APA - Harvard - MLA Referencing Use Mendeley to reference the resources you have used for your literature review. Link to Adobe Connect recording https: //connect. schools. nsw. edu. au/p 7 jkls 0 r 93 t 6/
Reference managing Software available other than Mendeley: Zotero Paper Endnote
Content Focus III Methodology and Data Collection Inquiry question: How is an appropriate methodology developed to collect valid and reliable data?
• assess and evaluate the uncertainty in experimental evidence, including but not limited to: – systematic errors – random errors assess and evaluate the use of errors in: – mathematical calculations involving degrees of uncertainty – graphical representations from curves of best fit • compare quantitative and qualitative research methods, including but not limited to: – design of method – gathering of data – analysis of data
Errors Systematic error: an error having a non-zero mean, so that its effect is not reduced when observations are averaged. Random error: an error in measurement caused by factors which vary from one measurement to another.
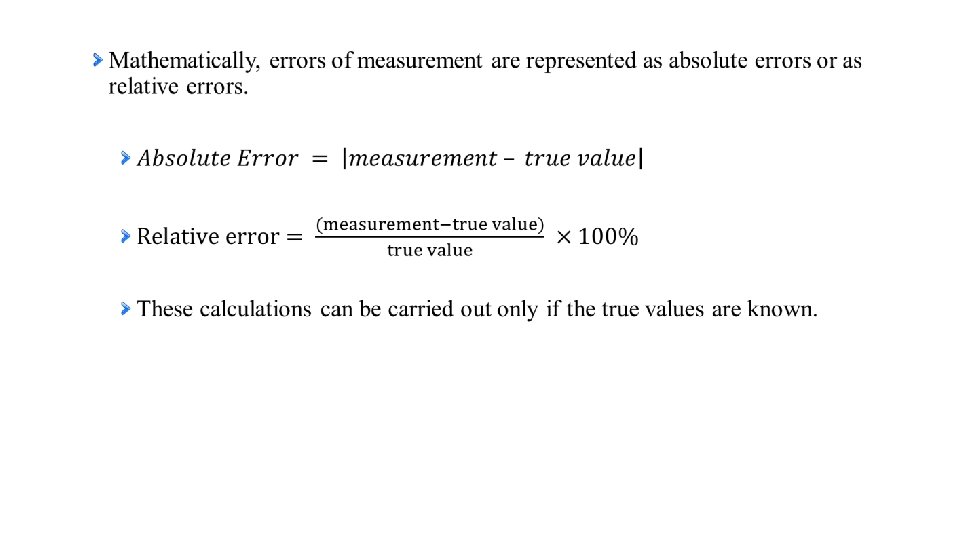
Errors of measurement Difference between the measured quantity value and its true or reference quantity value. Generally, there are two classes of scientific errors of measurement: Systematic errors (biases) - Repeating the measurements will not improve the accuracy of the data. Random errors - Random errors may be improved upon by repeating the measurements.
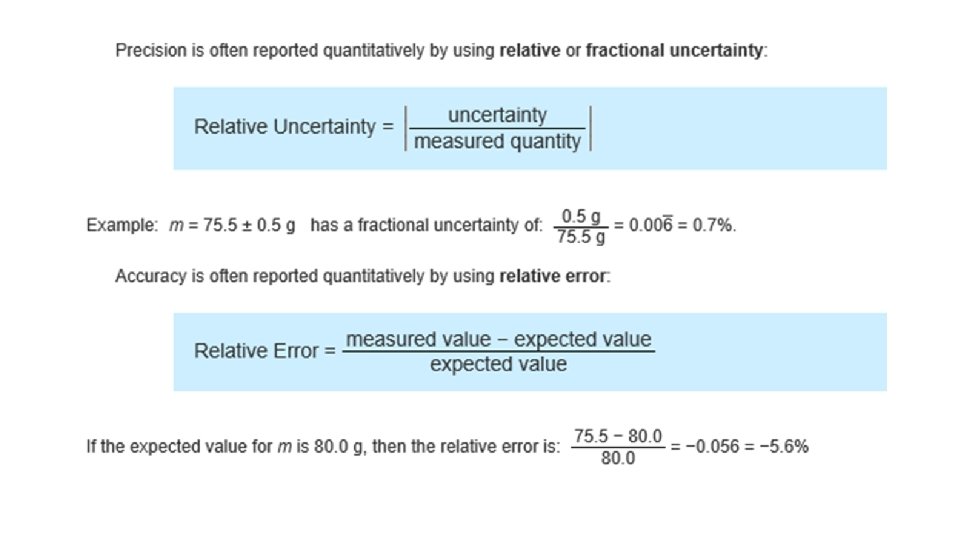
Errors and Uncertainties Uncertainty The true value of a measurement is not known accurately, but that it lies within a range of values. Measurement ± uncertainty (e. g. 0. 86 ± 0. 05 s) The reported uncertainty falls into one of two categories: Statistical uncertainty (sometimes referred to as Type A uncertainty) Non-statistical uncertainty (sometimes referred to as Type B uncertainty)
Errors in Measurement A simple approach for estimating the uncertainty in a measurement is to report the limiting precision of the measurement tool. For example, if a balance is calibrated to report masses to 0. 1 g, then the actual mass of a sample could be up to 0. 05 g greater or less than the measured mass, and the balance would still read out the same value. Thus, the uncertainty associated with mass measurements using this balance would be ± 0. 05 g. This method for estimating the uncertainty of a measurement is a good choice when only a single trial is performed.
Errors and Standard Deviation If on the other hand, the best estimate of a parameter is determined by making repeated measurements and computing the average value from the multiple trials, the uncertainty associated with each measurement can be determined from the standard deviation, σ. The standard deviation provides an estimate of the average uncertainty associated with any one of the N measurements that were performed.
When the uncertainties are random and multiple trials are performed to obtain the best estimate of a parameter, the standard deviation is an appropriate choice for describing the uncertainty in the measurement. Thus, the measured value could be reported as X=X±σ
Errors in Mathematical Calculations In most experiments, the parameter of interest is not necessarily measured directly, but rather is the result of a calculation that involves a number of measured quantities. There is an uncertainty associated with a calculated value when it depends on measured parameters that are added, subtracted, multiplied, or divided to obtain the parameter of interest.
When two measured values are added, the uncertainty associated with the sum is computed by taking the sum of the squares of the uncertainty associated with each measured value, and then taking the square root of the sum. Handling uncertainties in calculations that require multiplication and division is similar to that for addition and subtraction, but the uncertainties are replaced with fractional uncertainties.
Adding/Subtracting Measurements and Uncertainties Absolute Errors
For the sake of illustration, we let q = x + y and measure x and y to be x =3. 0 ± 0. 1 and y = 8. 0 ± 1. 0. We will write our final calculation of q in the form q = qbest ± ∆q. The best estimate of q will be:
Multiplying/Dividing Measurements and Uncertainties Add relative errors
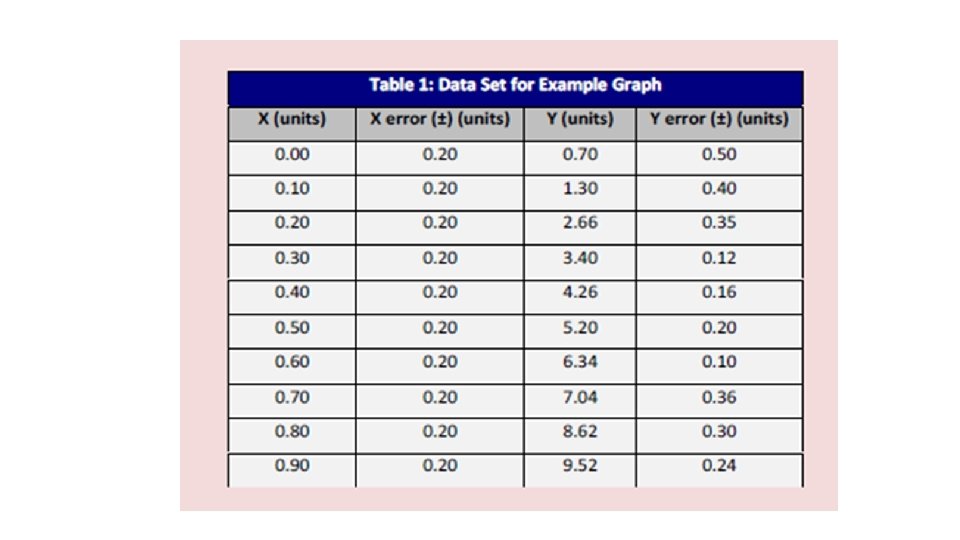
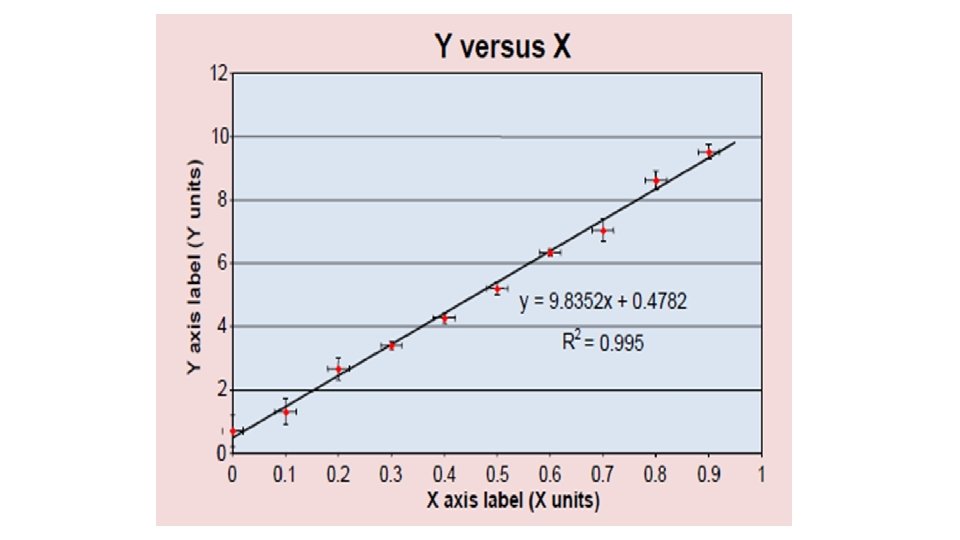
Errors in Graphical Representations Error bars are markers that visually show the uncertainty around each data point on the x and y axis You should expect your best fit line to pass through at least 70% of the error bars.
Quantitative V Qualitative Research • compare quantitative and qualitative research methods, including but not limited to: - design of method - gathering of data - analysis of data
Research Methodologies: A Comparison of Quantitative and Qualitative Methods Acknowledgement: Martin Gunnell 2016) There are two main research methodologies: quantitative and qualitative. The quantitative method, which has its origin based in the scientific method, relies on statistical procedures for data analysis. In contrast, qualitative methods rely on the descriptive narrative for data analysis.
Choice of methodology is heavily influenced by the research question. Proper research questions provide direction and focus in shaping data collection and analysis procedures.
Quantitative Research Methodology Quantitative, similar to the word quantity, implies using numerical data. So, quantitative methods rely on experiments and surveys to collect measurable data such that statistical processes can be applied. A major advantage of quantitative methods is that the results are usually generalizable to larger populations. The following discusses experimental and non-experimental design methods.
Experimental design. The experimental design is conducted in a laboratory setting which controls for variability. The primary benefit of an experimental design is that it may lead to causation. When one variable acts on another it may be deduced that the resulting state is caused by the action. Experimental methods provide an environment in which the unique characteristics or qualities of variables may be studied and their contribution may be measured. Laboratory settings are environments that lessen potential bias that occurs in natural settings where variables act as parts of a whole system. A negative of experimental design is that they have the potential to bias variable action by reducing or stopping the interaction among other variables.
Non-experimental designs include observation, survey, and other related methods of collecting numerical data that do not involve laboratory settings. The measurement of processing time, supply chain efficiency, product supply and demand, and price elasticity lend themselves to quantitative methods. Surveys are used to collect information about variables from participants in a population. Surveys have been used to collect political poll behaviours, marketing research, and a variety of other useful information. External validity is improved when data are collected using field surveys.
External validity implies that the results will generalize to a larger population because the findings are applicable across different settings and participants. Surveys include using questionnaires or structured interviews for data collection. Quantitative methods used structured interviews which repeat the same questions without deviation to each participant. Structured interview questions aim to maintain consistency and avoid bias.
Qualitative Research Methodology Qualitative methodologies are used to analyze and evaluate nonnumerical information. Quantitative studies try to understand intangible evidence, such as emotion and behaviour. Qualitative methods are applicable to studies that involve relationships between individuals, individuals and their environments, and motives that drive individual behaviour and action. Qualitative methods do not impose rigid rules and procedures similar to quantitative methodologies.
Qualitative methods derive the research process from the data itself. One process will usually lead to development of the next step. Qualitative methods allow “richness of the personal experience” by providing in-depth information in the natural language of the experience. This allows data categorization by witnessing the experience in its natural setting, disallowing preconceived hypotheses, and using critical researcher judgment.
Narratives. Narrative research involves asking individuals to share stories about their lives and deriving meaning from the experiences mentioned. The aim of the narrative approach is to combine the story’s chronological events with that of the researcher’s personal experience. Narratives may be supplemented with historical investigation, use of documents, and media sources.
• investigate the various methods that can be used to obtain large data sets, for example: - remote sensing - streamed data
Remote Sensing https: //www. sciencedirect. com/topics/earth-and-planetary-sciences/remotesensing-method Ambient Air Monitoring and Remote Sensing Mobile and remote sensing methods use large numbers of relatively inexpensive sensors linked by wireless or fibre optic networks. For Example: The South Coast Air Quality Management District (SCAQMD) of California has established an Air Quality Sensor Performance Evaluation Centre.
The objectives of AQ-SPEC are to: 1. evaluate the performance of low-cost air quality sensors in both field and laboratory settings; 2. provide guidance for evolving sensor technology and data interpretation; and 3. catalyze the successful evolution, development and use of sensor technology.
Remote Sensing of Oil Slicks for the Deepwater Horizon Damage Assessment. This discussion integrates the results of several independent remote sensing methods for detecting the presence of oil on the surface of the Gulf of Mexico during the DWH spill. Data from Landsat, MODIS, and SAR collected by at least 11 separate satellites, with 5 independent methods of evaluating oil on the ocean surface, and all of these data are in agreement that oil covered an extensive area of the surface of the northern Gulf of Mexico for over 3 months in 2010.
Fluvial –Tidal Sedimentology This involves in situ acoustic and optical instrumentation and remote sensing methods have been developed that have not routinely been applied to understanding ETM dynamics. That is sediment concentration and build-up river/estuarine environment. (Estuarine turbidity maxima (ETM) are zones of elevated sediment concentration that often occur in coastal plain, salt wedge, and river-dominated estuaries, where they influence the morphodynamic development, biogeochemical cycling, and contaminant redistribution of these systems. )
Geomorphological mapping Geomorphological field mapping can be conducted by remote sensing methods. Regional mapping was undertaken using two satellite imagery data sets: (1) from black and white Landsat MSS and false-colour composite Landsat TM (The Thematic Mapper (TM) is an advanced, multispectral scanning, Earth resources sensor) imagery at a scale of 1: 250, 000. TM images had winter-scene coverage using European remote sensing (ERS-1) SAR images at a scale of 1: 70, 000.
Streamed Data What is Stream Processing is a Big data technology. It is used to query continuous data stream and detect conditions, quickly, within a small time period from the time of receiving the data. The detection time period varies from few milliseconds to minutes. For example, with stream processing, you can receive an alert when the temperature has reached the freezing point, querying data streams coming from a temperature sensor.
Why is Stream Processing needed? Some insights are more valuable shortly after data has been received with the value of the data diminishing very fast with time. Stream Processing enables such scenarios, providing insights faster, often within milliseconds to seconds from the trigger. Following are some of the secondary reasons for using Stream Processing. Reasons 1: Some data naturally comes as a never-ending stream of events. To do batch processing, you need to store it, stop data collection at some time and processes the data.
Reason 2: Batch processing lets the data build up and try to process them at once while stream processing process data as they come in hence spread the processing over time. Hence stream processing can work with a lot less hardware than batch processing. Reason 3: Sometimes data is huge and it is not even possible to store it. Stream processing let you handle large fire horse style data and retain only useful bits. Reason 4: Finally, there a lot of streaming data available ( e. g. customer transactions, activities, website visits) and they will grow faster with Io. T use cases ( all kind of sensors). Streaming is a much more natural model to think about and program those use cases. Io. T – Internet of Things https: //www. slideshare. net/cloudera/top-5 -iot-use-cases
Gathering Data • propose a suitable method to gather relevant data, including large data set(s), if appropriate, applicable to the scientific hypothesis • A method of data collection is to be devised by students conducting first hand investigations. Students propose methods relevant to their investigation.
Processing Data for Analysis • Inquiry question: How is data processed so that it is ready for analysis?
• investigate appropriate methods for processing, recording, organising and storing data using modern technologies
Data Processing | Meaning, Definition, Steps, Types and Methods Data processing is the conversion of data into usable and desired form. This conversion or “processing” is carried out using a predefined sequence of operations either manually or automatically. Most of the data processing is done by using computers and thus done automatically. The output or “processed” data can be obtained in different forms like image, graph, table, vector file, audio, charts or any other desired format depending on the software or method of data processing used.
Fundamentals of data processing & how data is processed Data processing is undertaken by any activity which requires a collection of data. This data collected needs to be stored, sorted, processed, analysed and presented. This complete process can be divided into 6 simple primary stages which are: 1. Data collection 2. Storage of data 3. Sorting of data 4. Processing of data 5. Data analysis 6. Data presentation and conclusions
With the emergence and growing emphasis on Big Data & Data Mining the data collection is large and a number of operations need to be performed for meaningful analysis and presentation, the data is stored in digital form. Having the data into digital form enables the user to perform a large number of operations in small time and allows conversion into different types. The user can thus select the output which best suits the requirement.
This continuous use and processing of data follow cycle called as data processing cycle and information processing cycle which might provide instant results or take time depending upon the need of processing data. The complexity in the field of data processing is increasing which is creating a need for advanced techniques.
Storage of data is followed by sorting and filtering. This stage is profoundly affected by the format in which data is stored and further depends on the software used. General daily day and noncomplex data can be stored as text files, tables or a combination of both in Microsoft Excel or similar software. As the task becomes complex which requires performing specific and specialized operations they require different data processing tools and software which is meant to cater to the peculiar needs.
Data processing tools and softwares Hadoop Apache Hadoop tool is a big data framework which allows distribution of large data processing across various connected computers. It can scale up from a single server to thousands of different machines. HPCC This is a big data software tool developed by Lexis Nexis Risk Solution. It is highly efficient in accomplishing big data tasks with less code input. The whole tool works on a single programming language to perform all these complex analytical tasks. http: //planningtank. com/tools-softwares/data-processing-tools-softwares
Organising and Storing Data https: //libguides. uta. fi/researchdata/organize Name and organise files: File naming convention should be systematic and consistent. Common elements for a file name are e. g. description of contents, version number and date of creation. Common date convention (see ISO 8601 standard) is YYYY-MM-D General rules of thumbs: Keep the file name short enough Do not use special characters Use under score instead of full stop or empty spaces
Control Versions Keep a single master file of data. Version naming system should be sensible so that audit trail can be tracked. Use ordinal numbers for major changes (v 1, v 2, v 3). The version of a file can also be identified via date recorded in file name. Record your changes!
File Formats To guarantee long-term data access convert data to open standard formats such as: PDF CSV XML Digital file formats used in FSD are listed here
Storage There are several options to store data during the research, for example: disk space services IDA, a national data storage service produced by CSC and funded by the Ministry of Education and Culture EUDAT, infrastructure providing research data services and funded by the European Union's Horizon 2020 programme The cloud
conduct a practical investigation to obtain a qualitative and a quantitative set of data and apply appropriate methods to process, record, store and organise this data Students engage in their Scientific Project Practical or us using a secondary data source the engage in an appropriate practical activity.
assess the impact of making a large data set from scientific sources public, for example: – LHC (Large Hadron Collider) – Kepler Telescope – Human Genome Project Table 1: Examples of scientific experiments that have produced large datasets. The table also indicates some significant discoveries arising from those investigations. Teachers and students can access relevant publications and datasets using the links provided.
Source of the data set Discoveries Relevant publication (s) More information LHC (Large Hadron Collider) Higgs boson New subatomic particles The ATLAS Experiment at the CERN Large Hadron Collider Supersymmetry Information about the ATLAS experiment may be found here. The ATLAS experiment datasets may be accessed here. Kepler Mission Exoplanets Kepler Mission design, realized photometric performance, and early science Information about the Kepler Mission may be found at these websites: Kepler Mission (Harvard) and Kepler Mission (NASA). The Kepler Mission datasets may be accessed here. Human Genome Project Identifying the genetic basis of some diseases. The Sequence of the Human Genome Information on the human genome sequence may be found here. The assembled human genome sequence may be accessed here and here. A genetic blueprint for constructing every human cell. The genetic relationship between humans and other organisms. New Goals for the U. S. Human Genome Project: 19982003
Learning about large data in science The Science Extension syllabus requires students to explore publically available datasets so that their impacts may be evaluated. Students should access and read one or more of the articles listed in the Table, or other academic articles where publicly available datasets from one of these projects were used. They may have to read other articles to understand the impacts of those datasets.
conduct an investigation to access and obtain relevant publicly available data set(s), associated with the proposed hypothesis, for inclusion in the development of the Scientific Research Project
Activity Using the scientific research reported on in the articles (Table 1), assess the impact of making a large data set from scientific sources public. In your response, consider: What do we now know that we would not have known if large datasets were not made public? Could the same discoveries have been made without access to the large datasets? What can the general scientific community achieve with access to large data sets that could not be achieved solely by the organisation collecting the data? Has the partnership between the general scientific community and the organisations collecting the data changed the rate of discovery? Has there been any benefit to society through scientific work being done using publicly available data sets?