Lightning Theory Detection and The Canadian Lightning Detection
. Environment Canada Meteorological Service")


 l Benjamin Franklin (~ 1770’s) First to design")
 l Definition: “A Transient, high-current electric discharge whose")

 * Faint -vely charged channel --”the stepped leader”")
 * The leader is connected to the potential")
 * Second leader can propagate down already established")


 was established in 1998 and")
 l l l The physical size of Canada coupled with the smaller")

 Sensor Location & Type Detection Efficiency Location Accuracy")

 – LPATS is TOA")
")

")
")

")
 l differentiates better between CG")
 detects 2 -4 million Flashes to Ground/Year over")


 20060617_2300 UTC MSC publishes these at www. weatheroffice.")


 damaging lightning is a feature in about 50% of MCCs")


 • Southeast")
 l Total flash rates l Land sea")

. Environment Canada Meteorological Service")
- Slides: 58
Lightning Theory, Detection and The Canadian Lightning Detection Network (CLDN). Environment Canada Meteorological Service of Canada
Introduction This presentation will provide an overview of: l l Basic Lightning Theory Lightning in Canada l l The Canadian Lightning Detection Network (CLDN)… l l Lightning Density Fatalities & Injuries revisited. Lightning “Season” in Canada CLDN will Detect 90%+ of Cloud to Ground Lightning Flashes CLDN Network Topology, CLDN Sensors CLDN Communications, CLDN Web Portal Products & Services for CLDN Clients. l l Real Time Flash Density Maps. Areal Lightning Statistics. CLDN Performance Measurement – Network Status. Lightning Forecasts CLDN will Detect less than 15% of Cloud to Cloud Lightning
Lightning Theory : Historical Background l l l Suggested as a source for life producing molecules Source for ignition of forest fires - determines the composition of trees and plants - e. g. giant sequoias , a selective “predator” “Respected” in many ancient civilizations - thunderbolts, “Thors”day, the thunderbird Destroyed many churches (and bellringers) since the middle ages Explosions - 100 tons of gunpowder in church vault in St. Nazaire, Brescia, 1769 - 3000 killed
Lightning Theory : Historical Background (2) l Benjamin Franklin (~ 1770’s) First to design an experiment to prove that lightning was electrical The lightning rod was the first practical application of electricity
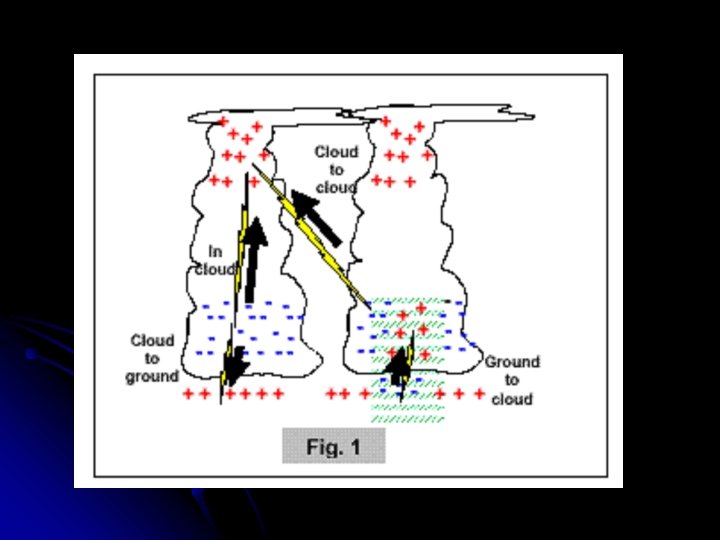
Lightning Theory: The Lightning Discharge (1) l Definition: “A Transient, high-current electric discharge whose path length is measured in Km” l Types of Discharge: Cloud to Ground (CG) and cloud discharges. . . intracloud, intercloud and cloud to air >50% of CB discharges are intracloud. Most interest has been in CG discharges
Electrostatic theory l Cloud electrification appears to require strong updrafts which carry water droplets upward, supercooling them to -10 to -20 C. These collide with ice crystals to form a soft ice-water mixture called graupel l The collisions result in a slight positive charge being transferred to the ice crystals, and a slight negative charge to the graupel l Updrafts drive lighter ice crystals upwards, causing the cloud top to accumulate an increasing positive charge l The heavier negatively charged graupel fall towards the middle and lower portions of the cloud, building up an increasing negative charge l Charge separation and accumulation continue until the electrical potential becomes sufficient to initiate lightning discharges, which occur when the gathering of positive and negative charges forms a sufficiently strong electric field
Lightning Theory: The Discharge Process (1) * Faint -vely charged channel --”the stepped leader” emerges from cloud base and under the influence of the electric field propagates towards the ground in a series of luminous steps 1 microsec and 50 -100 m * Stepped leader approaches the ground with electric field potential relative to ground of ~108 volts causes upward moving streamers from objects on the ground * One of these contacts the stepped leader at 50 -100 m above the ground --then:
Lightning Theory: The Discharge Process (2) * The leader is connected to the potential of the ground * Charge starts flowing to the ground * Current wave propagates as bright pulse up the channel Discharge is called the “Return Stroke” Charge flowing down the channel produces current at the ground of average peak value of 30 k. A. Changes are produced in the electric and magnetic fields. These changes can be detected used to determine position of stroke.
Lightning Theory: The Discharge Process (3) * Second leader can propagate down already established channel a “Dart Leader” - not stepped (no branches) and may be followed by other dart leaders * Each “leader” is called a “stroke” * Combined number strokes constitutes a “Flash” * Average number of strokes per flash ~ 3 * Peak current following subsequent dart leaders usually diminishes hence induced field changes have smaller amplitude * For downward +ve charges there is usually one stroke but currents are usually larger and hence cause more damage * Channel heated to 30, 000 K - expansion generates shockwave Thunder - audible generally up to 25 km
So How Does It Work?
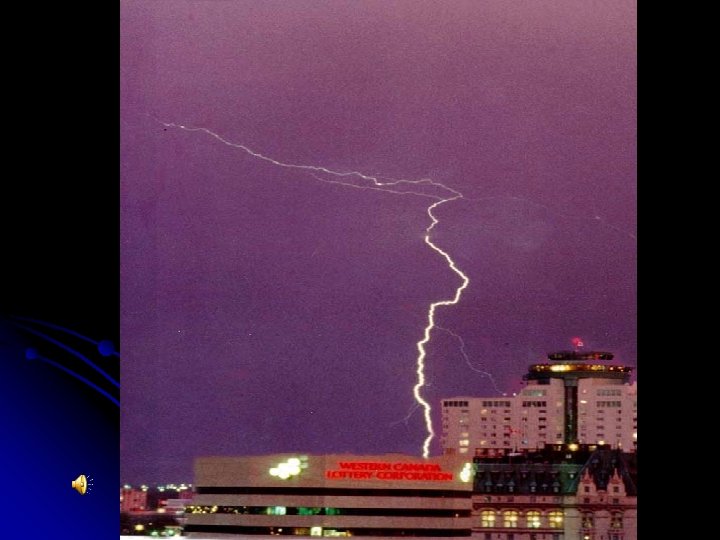
Cloud to Ground Strike
Cities are easy targets
Proof that you don’t have to be the tallest object to be struck
This bolt struck ground from the top of the cloud from about 50, 000 feet. Note change in colour at the bottom
Cloud to Cloud Strikes account for about 80% of all lightning
“Bolt from the Blue”
CLDN - Background ►The Canadian Lightning Detection Network (CLDN) was established in 1998 and now provides lightning detection coverage for over 95% of Canadians.
Background (cont’d) l l l The physical size of Canada coupled with the smaller population and tax base, poses unique challenges for the Meteorological Service of Canada (MSC) when designing, operating and managing monitoring networks such as the CLDN. Canada is approx 10, 000 square kilometers in size, has a population of 32 M (2004) and a comparative GDP of $959 B (2003 - US Dollars) For comparison… Germany is approx 357, 000 sq km in size, has a population of 82 M (2004) and a comparative GDP of $2271 B (2003)
The “N” in CLDN – It’s a Network. l The CLDN and National Lightning Detection Network in the USA (NLDN) consist of 199 sensors gathering lightning data in real time. The data is processed into lightning location solutions and made available to MSC and external users within 30 -60 seconds. l By using a network topology, lightning location solutions are NOT dependent upon any one sensor. The CLDN/NLDN network is highly fault tolerant enabling solutions to be generated 24/7/365 with 99. 5+% availability l The CLDN is fully integrated with the NLDN (USA-Vaisala) l l No Intra Canada or Canada-USA Boundary Conditions (errors) Sensor Quantities l CLDN=83 in Canada owned by MSC (13 LS 7000, 29 IMPACT ES, 41 LPATS IV) l NLDN (USA) =111 owned by Vaisala l Five More IMPACT ES sensors in Alaska contribute to CLDN solutions and we to theirs. (Alaska Fire Svc) to remove boundary conditions either side of 140 W. l North America Total (83+111+5)=(194+5)=199
NALDN (CLDN & NLDN + AK) Sensor Location & Type Detection Efficiency Location Accuracy
How the CLDN Works l l l l 1. Multiple Sensors detect a Lightning Stroke. Often 5 -10 sensors. 2. Sensor immediately uplinks data to Satellite 3. Satellite downloads data to Telesat Hub in Toronto. 4. Data sent by land line to Tucson where all other data about this Stroke from all other sensors is used to calculate the solution location of the Stroke. 5. Solution information sent back to Telesat Hub. 6. Solution information uploaded to Satellite. 7. Solution information broadcast by Satellite to all users. Total time from Stroke to Solution Delivery to client nominally 30 seconds. Seldom more than 60 seconds.
Methods of Lightning Detection • Time of Arrival Sensors (TOA) – LPATS is TOA based • Magnetic Direction Finding (MDF) – IMPACT is MDF and TOA based
LPATS-IV (TOA)
LPATS-IV uses 3 or more TOA sensors to detect and time stamp the wave form generated by a lightning flash l calculates position of strike through spherical geometry l each return stroke is transmitted l l flash=one l or more strokes in Canada only the first return stroke (‘‘flash’’) is plotted
Basic Time Of Arrival (TOA)
IMPACT-ES (MDF/ TOA)
IMPACT-ES l l l l senses EM field radiated by lightning flash 1 k. Hz to 1 MHz magnetic direction finder using relative strength of induced currents in 2 loops MDF distinguishes CG from CC position analyzer triangulates from different MDF sensors TOA using GPS technology TOA can also use ratio of signal strengths on baseline
Basic Direction Finding (MDF)
Advantages/ Disadvantages l l l Magnetic Direction Finding (MDF) l differentiates better between CG and CC l lower detection efficiencies (sensitivity) Time of Arrival Sensors (TOA) l more sensitive l more accurate l can identify both CG and CC but not as good at differentiating hybrid network is best
The Canadian Lightning Detection Network (CLDN) detects 2 -4 million Flashes to Ground/Year over Canada. Flash densities can be described as low to moderate with densities ranging from. 25 to 4 flashes/sq km/year. Approx 9 -10 lightning related deaths & 92 -164 injuries per year. (Updated 2006 from earlier estimates of 3 -8 deaths/year and 80 injuries). Nationally in 2002, 46 -70% of forest fires in Canada were caused by lightning. On average, each year 7631 forest fires consume 2. 8 million hectares of forest. Lightning Density
Lightning “Season” in Canada Using 7 years of CLDN data we are now able to begin to better understand Lightning over Canada and the adjacent areas of the Northern USA, Pacific Ocean & Atlantic Ocean. Although the previous classical Flash Density map is “accurate”, it does not tell the whole story over Canada due to the shorter “season”. Classical density analysis diminishes the importance of Lightning over Canada during the Lightning Season. We have started to analyze the CLDN data in different ways. For example this analysis done by Bill Burrows depicts the Number of Days in the Lightning Season (99% of annual total) and serves to better illustrate the “When” of Lightning in Canada. Note the nearly year round risk over the South Coast of BC and adjacent to the Gulf Stream in Atlantic Canada. Also the length of the season over the Forested areas of Central BC.
Lightning “Season” Start & End Start of the Lightning “Season” defined as the period containing 99% of Lightning (Burrows 2006) End of the Lightning “Season” defined as the period containing 99% of Lightning. (Burrows 2006)
CLDN Web Portal for Clients http: //192. 101. 77. 135/ec/index. php Design Criteria: l l l All products are dynamic with frequent updates (30 -60 minutes). Results viewable On. Line using a standard web browser. Simple to comprehend and use All products must be archived. If we show it we must be able to view it again later. A growing repository of products and services for Clients. l Aerial Statistics updated for geopolitical areas every 10 minutes. l l l Includes derived averages, max, min etc. North America Flash Density Maps (hourly) Lightning Forecasts (updated 2/day) Network Performance Measurement (30 minutes) e. Mail List Server is in beta now. Operational by 20070501
CLDN - Areal Statistics l l l MSC and CLDN clients have a need for areal based lightning statistics in near real time Also of interest to operations managers, media, elected officials etc Geopolitical areas such as Provinces and Territories. Circles around cities and airports. Now available on the CLDN web portal by Year, Month, Day
North America Flash Density Maps (hourly) 20060617_2300 UTC MSC publishes these at www. weatheroffice. ec. gc. ca Clients may host on public web sites. 20060803_0100 UTC The estimated frequency of Lightning is depicted as flashes per 1000 square km* per minute as follows: • Very Frequent (Red) = more than 6 per minute • Frequent (Orange) = 3. 0 -5. 9 per minute • Occasional (Yellow) = 1. 5 -2. 9 per minute • Isolated (Blue) = less than 1. 4 per minute Note*: 1000 square km represents a circle having a radius of 17. 8 km
CLDN Limitations and Capabilities • NOT a total lightning mapper • Excellent CG lightning & survey- level cloud discharge detector and locator • Complements radar and satellite – lightning is direct observation of convection • Topography independent, uniform coverage and nearly instantaneous reporting
Usefulness in Forecast Operations • • Heavy rain Severe thunderstorms Microbursts Tornadoes Hail MCC’s Hurricanes Winter storms
Heavy Rain Maximum rain rate correlated with a high concentration of CG strikes l Local studies can refine this relationship l
Severe Thunderstorms 5 minute flash rates can be used to forecast severe events l Most severe events occur west to northeast of the lightning centroid l Elevated rates of 30 or more positive flashes per hour l Local variations are important l
Microbursts l An intense, localized downdraft of air l spreads on the ground, causing rapid changes in wind direction and speed l area less than 2. 5 miles (4 kilometers) diameter l short duration, usually less than 5 minutes. l Total flash rate peaks several minutes before a microburst reaches the surface
Tornadoes Thunderstorms dominated by positive CG flashes have at least some rotation, i. e. supercells l Peak in CG flash rate just prior to tornado formation, decrease with tornado touchdown l Useful supplement to radar data l
Hail CG flashes begin as hailstones develop aloft l Hail severity correlated with rate of flashing l However, many lightning centres not associated with damaging hail l More lightning activity with cold front hailstorms l
Mesoscale Convective Complex (MCC) damaging lightning is a feature in about 50% of MCCs l as well, lightning tends to be associated with cold IR cloud tops and intense midlevel radar echoes l
Hurricanes Do not produce as much lightning as midlatitude systems l Intense convection, even tornadoes, can occur in outer rain bands prior to rapid hurricane intensification l May be a predictive tool l
Winter Storms Lightning data can be used to monitor convective activity during heavy snow events l ‘‘Snowbursts’’ can give 5 -10 cm per hour l Ice pellets common in CG areas l Radar echoes reach moderate intensity at the same time as CG lightning detected l
CLDN Overall • Important to EC’s Severe Weather Program • Provides high resolution indication of thunderstorm activity, year round
Use of CLDN in Forest Fire Detection in BC Preliminary Findings of Study • Data for Fires that have been classified by BCFS as Lightning initiated have been supplied by BCFS for Prince George, Cariboo and South. East districts for the years 2004 -2006. • EC and Vaisala are jointly funding an analysis of this data comparing lightning classified fire starts to both Flash (operational data BCFS gets now) and Stroke Data. • Highlights and Preliminary Findings are presented below:
BCFS Lightning Classified Fire Locations 2004 -2006 Red dots are fire start locations provided by BCFS for all three years: 2004, 2005, 2006
Flash vs Stroke Historical background. • Flash data was conceived in an era of limited bandwidth. Full CONUS data set at peak lightning rates (network-wide) still fits within 1200 baud VSAT channel. • Flash data was taken into widespread use within forest resource management sector, and became the “de facto” standard. “Flash Density” maps are a common reference point. • Flash data was discovered first, it was “what could be done” in the 70’s & 80’s. Change is coming. • Stroke data may mean slight operational changes to forest resource management sector. • Stroke data provides a richer dataset. More Cloud to Ground Data is better when analyzing lightning caused fires.
Flash vs Stroke – An Example Flash Green circle = 1 km buffer Red circle = 50% probability ellipse Green star = BCFS-provided fire start location Blue dot = Cloud to Ground lightning stroke Stroke By definition a “Flash” is the first stroke in a cluster of 1 or more strokes occurring within a span of not more than 1 second and within a radius of 10 km from the first stroke. Limited to 15 strokes maximum (very rare 15+)
Flash vs Stroke – Pro’s & Con’s Flash Data Advantages. Flash Data Disadvantages Stroke Data Advantages Stroke Data Disadvantages • Still a low bandwidth solution. • Flash Grouping algorithm provides a relatively small area to focus attention on. • Subsequent strokes may be up to 10 km from first stroke. More clues to possible fire start locations. • Ground contact points for subsequent strokes are often different. Fire start location can “hop around. ” • (see paper by Krider/Valine 2002, and paper by Rakov/Uman/Thottappillil 1993) • Subsequent strokes will likely have different peak current and other characteristics, making discrimination between “very likely” and “not so likely” fire starting events potentially easier. • Flash reports first return stroke only. • No information about subsequent strokes. • Takes 2 – 2. 5 times the bandwidth, compared to flash. • May seem like “more noise” to operations folks, at first. • Learning meaningful characteristics of Stroke data may be a challenge.
2006 Lightning Fires “explained” by CLDN Flash vs Stroke Data (preliminary findings) • Southeast makes “sense” given higher sensor density. • Prince George makes sense given fewer sensors to the north. • Stroke Data is better than Flash Data at any given search radius. • Operational users who are prepared to search out to 5 -10 km may not need Stroke Data for operational purposes. • Caution over use of Detection Efficiency and Location Accuracy. They are independently modeled. Prince George Flash r. DE% Stroke r. DE% Fires 10 km 276 94. 20 277 94. 54 293 5 km 253 86. 35 262 89. 42 293 2 km 189 64. 51 213 72. 70 293 1 km 140 47. 78 172 58. 70 293 Flash r. DE% Stroke r. DE% Fires 10 km 227 98. 27 231 100. 00 231 5 km 198 85. 71 206 89. 18 231 2 km 152 65. 80 172 74. 46 231 1 km 115 49. 78 144 62. 34 231 Flash r. DE% Stroke r. DE% Fires 10 km 480 100. 00 480 5 km 472 98. 33 477 99. 38 480 2 km 404 84. 17 427 88. 96 480 1 km 284 59. 17 336 70. 00 480 Caribou Southeast
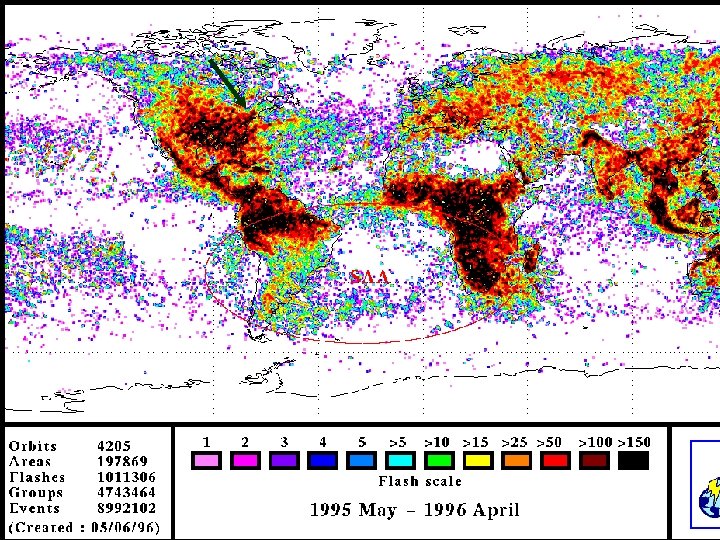
GOES Lightning NASA Lightning Imaging Sensor (LIS) l Total flash rates l Land sea l Day and night l Could be flown on future GOES l
Lightning Forecasts
Lightning Theory, Detection and The Canadian Lightning Detection Network (CLDN). Environment Canada Meteorological Service of Canada