Chapter 13 Taking the Measure of Stars The


 has a parallax of only 0. 769")


 and distance are known, it is straightforward to establish the")


 by mass,")
 Parallax. The half-yearly angular displacement of a star in the")


 But the luminosity of a star can also")


 for the open star cluster NGC 6087 is identical to")

.")

 and Alcor (L).")


 for a spectroscopic binary provides information on the")


. Note that the diagram")


- Slides: 78
Chapter 13 Taking the Measure of Stars The material of Chapter 13 introduces the fundamental ideas about how stars are studied, in particular, how it is possible to learn incredibly detailed information about individual stars simply from the light they emit. 1. Examine how one determines the distance, luminosity, size, mass, temperature, and chemical composition of individual stars. 2. Organize the properties of stars using the classical Hertzsprung-Russell (H-R) diagram, and explore the large range of properties that differentiate one star from another.
Determining distance using triangulation.
The concept of stellar parallax. The angle p is smaller as distance becomes larger.
How astronomers measure parallax angle. They observe star fields 6 months apart and compare the positions of stars with each other.
All stars close enough display parallax. Distance is measured by inverting the parallax angle. Distance = 1/angle.
A new measure of distance is introduced: the parsec. A parsec is the distance at which 1 Astronomical Unit subtends an angle of 1 second of arc (arcsecond). 1 parsec = 3. 26 light years
The image at right demonstrates parallax. The Sun is visible above the streetlight. The reflection in the water shows a virtual image of the Sun and the streetlight. The location of the virtual image is below the surface of the water and thus offers a different vantage point of the streetlight, which appears to be shifted relative to the stationary, background Sun.
The Hipparcos telescope of ESA.
The nearest star (beyond the Sun !) has a parallax of only 0. 769 arcsecond. Parallaxes smaller than 0. 010 arcsecond become increasingly difficult to measure and those smaller than 0. 001 arcsecond are often erroneous. Other techniques are used to derive distances for more distant objects. Other techniques: Proper motion (rate stars move across the sky) Cluster parallax (main-sequence fitting) Spectroscopic parallax (spectrum gives L, T) are some of the few.
The proper motion of a star refers to its annual displacement in the sky relative to a fixed coordinate grid. Proper motion angles are much larger than parallax angles.
Barnard’s Star, an example of a star that has a very large proper motion across the sky. The images were taken a few years apart.
Measuring stellar luminosity using a star’s spectrum. For hot stars the hydrogen lines are broad (wide) in dwarfs but much narrower in giants and supergiants.
The magnitude system. As invented by the astronomer Hipparchus 2200 years ago, it was simply a way to “rank” the stars visible at night. The brightest were ranked as 1 st magnitude, the faintest visible were ranked as 6 th magnitude. In other words, the brightest stars were assigned the smallest number, the faintest the largest number. And 6 divisions were used because of the mysticism about 6, which is the first “perfect number. ” The scheme was only later put on a formal basis in which a brightness difference of 5 magnitudes corresponds to a brightness ratio of 100. Note that the scheme is “inverse logarithmic. ” Magnitudes relate to the logarithm of star brightness, and go the “wrong way. ”
The magnitude system.
Magnitudes for Pleiades stars.
A chart for M 67 used by astronomers to establish the limiting magnitude for their telescope system.
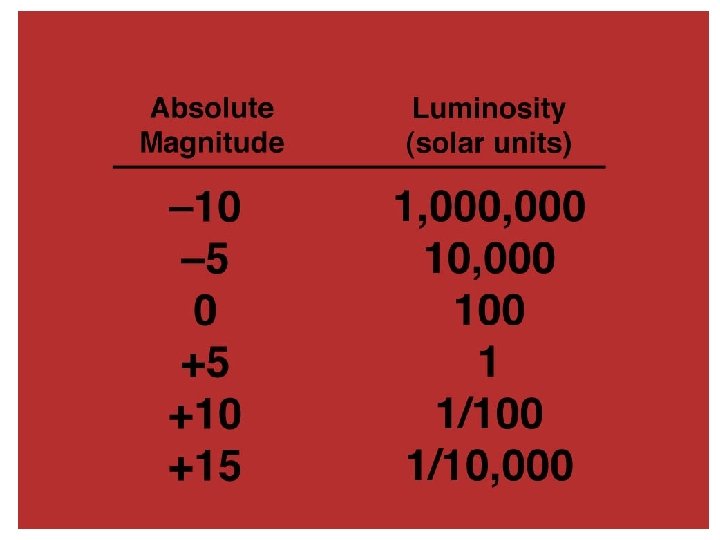
If brightness (in magnitudes) and distance are known, it is straightforward to establish the intrinsic brightness of a star. Astronomers use another magnitude scale for that, called absolute magnitude. Apparent magnitude is designated as m, absolute magnitude as M. Absolute magnitude is defined as the brightness at which an object would appear if placed at a distance of 10 parsecs. As such, M is a measure of a star’s luminosity. Another magnitude used is colour index, the difference between a star’s brightness (in magnitudes) in different colour bands, usually blue and yellow, for example b–y (on the Johnson system it is written B–V).
Recall from Chapter 4 the sequence of spectral types used to establish the surface temperatures of stars.
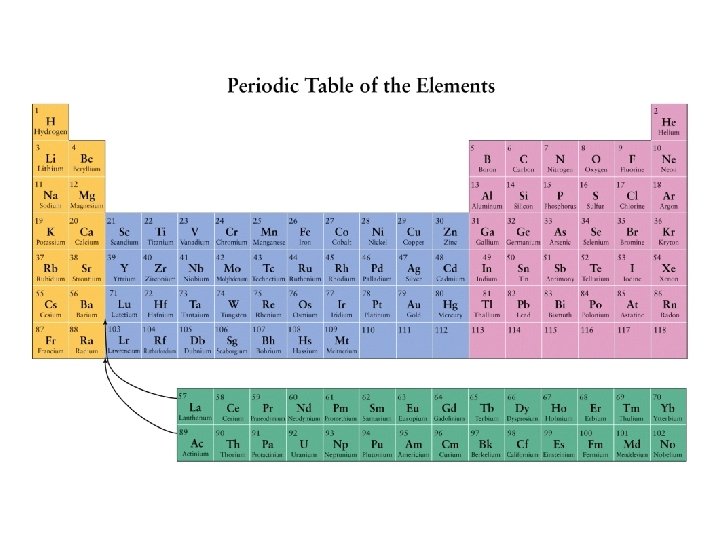
Stellar spectra are also used to measure abundances for the different elements in stars, at least in their outer regions.
Results: Element Hydrogen Helium Oxygen Carbon Neon Nitrogen Iron All others No. Percentage 92. 5% 7. 4% 0. 064% 0. 039% 0. 012% 0. 008% 0. 003% 0. 001% Mass Percentage 74. 5% 23. 7% 0. 82% 0. 37% 0. 19% 0. 09% 0. 16% 0. 03%
Summary on a logarithmic scale. The elements lithium, beryllium, and boron are of extremely low abundance because they are destroyed in star interiors. Even-numbered nuclides come from collisions with helium nuclei (He), so are more common.
Astronomers normally state for simplicity that the universe is 75% hydrogen (H) by mass, 24% helium (He), and 1% everything else. They also designate that “everything else” as “metals, ” even though only a portion of the elements involved are metallic. Another way of stating that is: X = 0. 75, Y = 0. 24, Z = 0. 01. If number abundance is considered instead, the composition of stars and the universe is 92½% hydrogen (H), 7% helium (He), and ~½% metals (everything else).
Astronomical Terminology (so far) Parallax. The half-yearly angular displacement of a star in the sky created by our orbit about the Sun = similar to effects of stereoscopic vision in humans. Parsec. A measure of distance for an object that has a parallax of 1 arcsecond = 3. 26 light years. Magnitude, m. A scale developed by Hipparchus to rank the naked-eye stars in terms of brightness. Luminosity. The rate at which a star emits light, often measured using absolute magnitude. Absolute Magnitude, M. A measure of luminosity, equivalent to the magnitude a star would have if it were 10 parsecs distant. Spectral Sequence. The scheme developed to label stars according to decreasing surface temperature: OBAFGKM (LT). Composition. A measurement of the abundances of the different elements in stars and galaxies.
Sample Questions 1. What would happen to our ability to measure stellar parallax if we were on the planet Mars? What about Venus or Jupiter? Answer: As distance from the Sun increases, a parallax angle of one arcsecond corresponds to a greater and greater distance. From Mars we would be able to measure distance to even further stars, and from Jupiter even more distant stars would be detectable by their parallax. From Venus, however, only closer stars could be measured.
18. The stars Betelgeuse and Rigel are both in the constellation Orion. Betelgeuse appears red in colour and Rigel bluishwhite. To the eye, the two stars appear equally bright. Can you compare the temperature, luminosity, and size of the two stars from just that information? If not, why?
Answer. Betelgeuse is cooler than Rigel, but nothing else can be said about the luminosity or size of the two stars without knowing their distance.
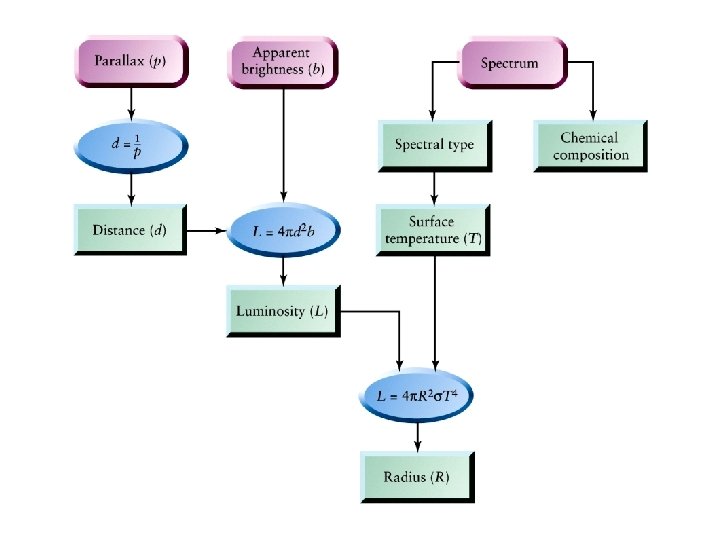
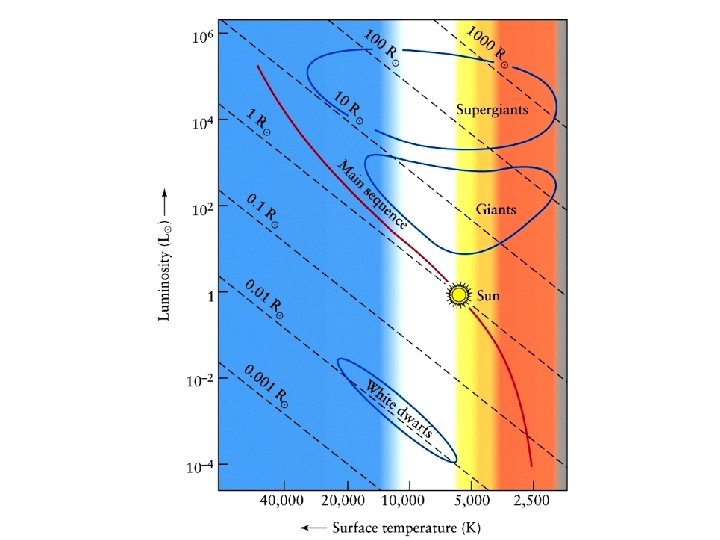
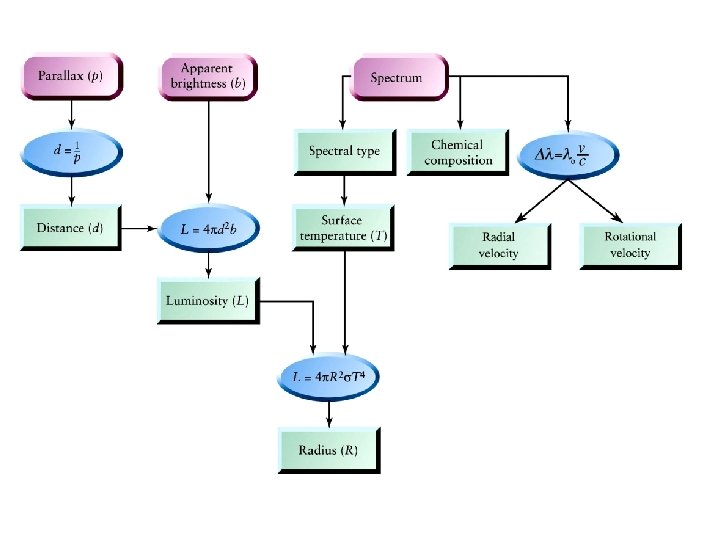
The Stefan-Boltzmann Law: Star Sizes The luminosity of a star is given by the energy radiated per second from every square meter of surface of the star multiplied by the surface area of the star. The surface area of a sphere = 4πR 2 (R is the stellar radius) The radiance of a hot gas = σT 4 (T is temperature measured in K) where σ = Stefan-Boltzmann constant. So the luminosity, L, of a star is often written: L = 4πR 2σT 4
The Stefan-Boltzmann Law: Star Sizes (2) But the luminosity of a star can also be found from its distance and apparent brightness. Namely, distance + apparent brightness = luminosity. That is how absolute magnitude is calculated So, the distance and apparent brightness of a star can be used to infer its size, i. e. its radius, since the star’s temperature can be established from its spectrum. Distance + apparent brightness = luminosity Spectral Type = temperature Luminosity + temperature = size
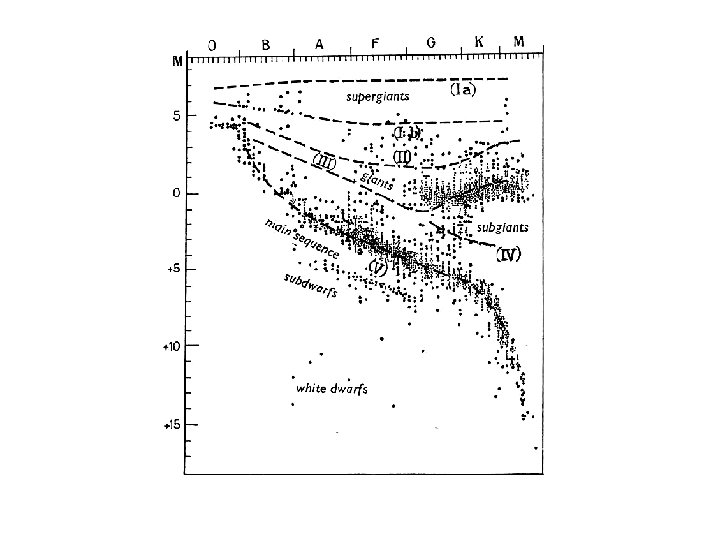
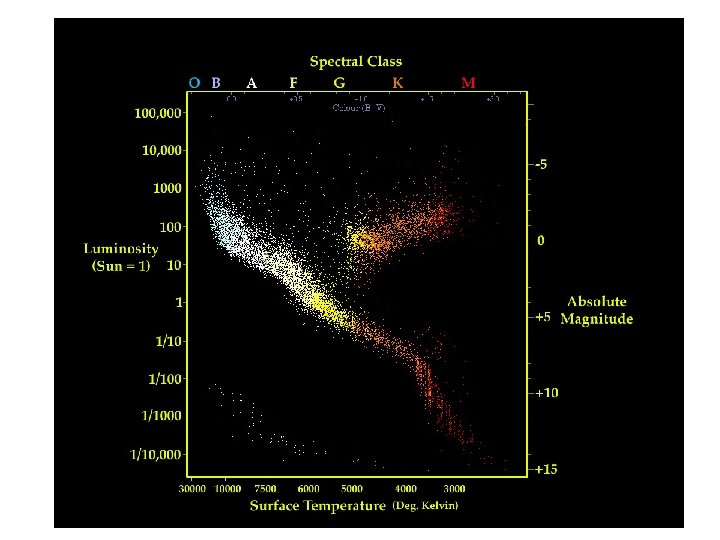
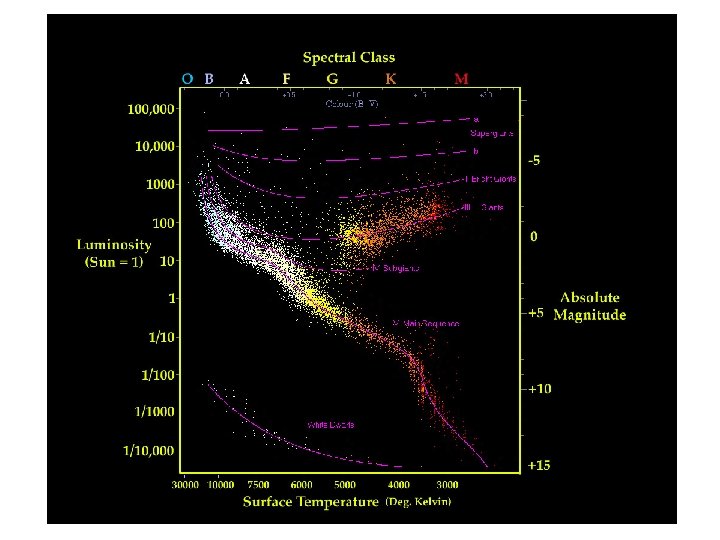
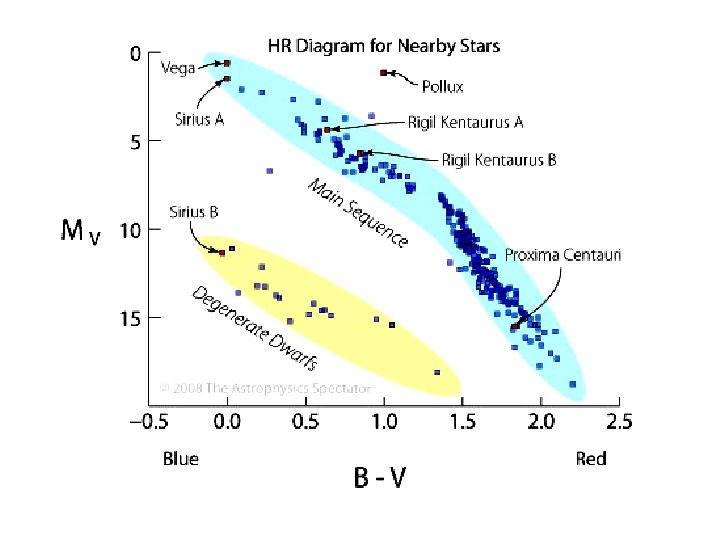
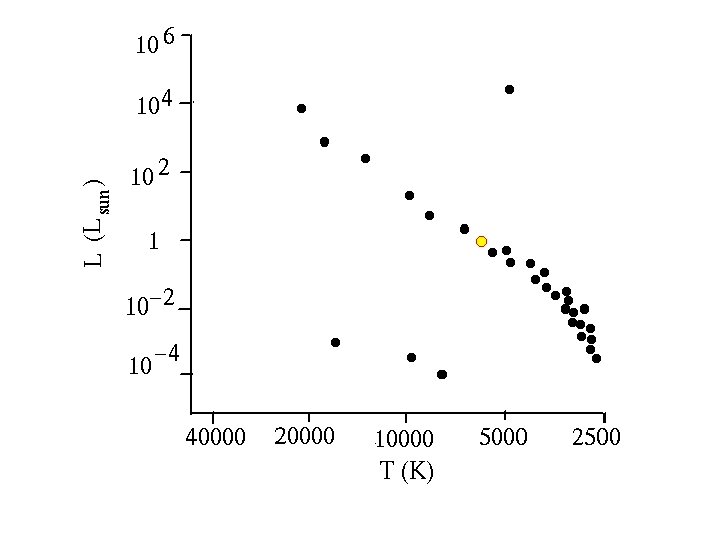
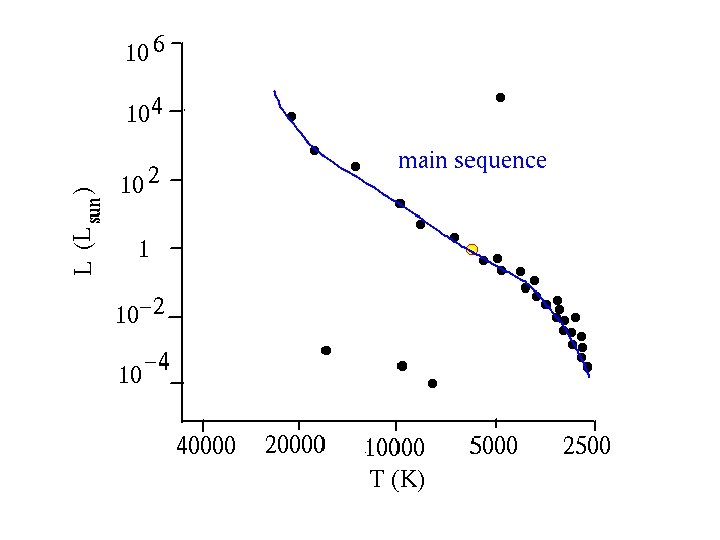
That reasoning is the basis for the Hertzsprung-Russell diagram, H-R diagram for short, which plots absolute magnitude (or luminosity) of a star versus its spectral type (or temperature).
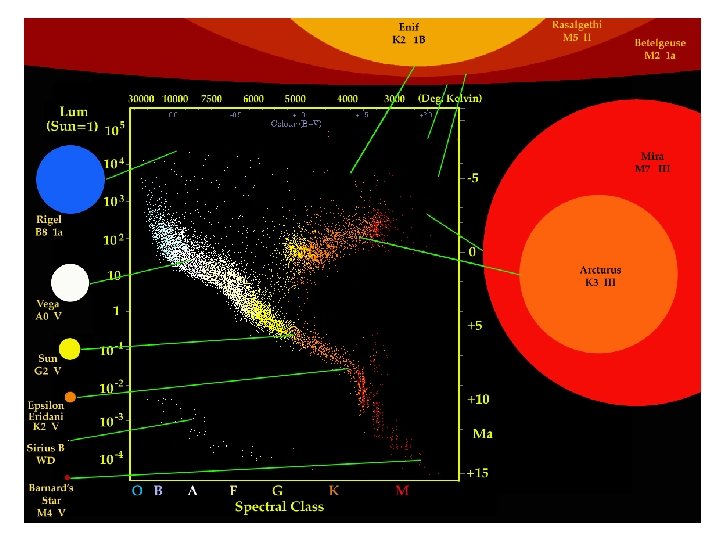
Position in the H-R Diagram is also related to size.
MK scheme of using Roman numerals to designate stellar luminosities: I = supergiant, III = giant, V = dwarf (like the Sun), corresponding to the main sequence in the H -R diagram.
The H-R Diagram simplified.
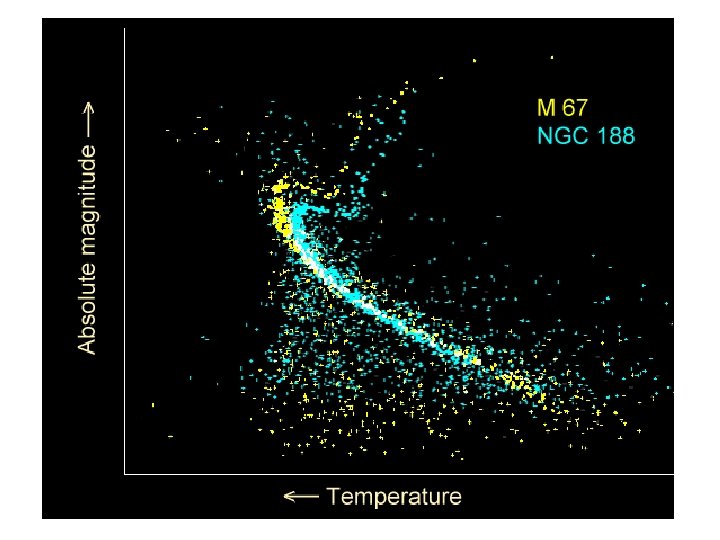
The colour-magnitude diagram (CMD) for the open star cluster NGC 6087 is identical to the H-R diagram for stars in general. Note that most stars lie on the main sequence, very few have evolved “away” from the main sequence. S Nor is a yellow supergiant member of the cluster. Actually it is a pulsating Cepheid variable star.
The distances to star clusters like NGC 6087 and NGC 6830 can be measured, often to better than 5%, by fitting a standard mainsequence to the obvious dwarf stars in the cluster.
Other examples: P Cygni cluster and NGC 2264 (young).
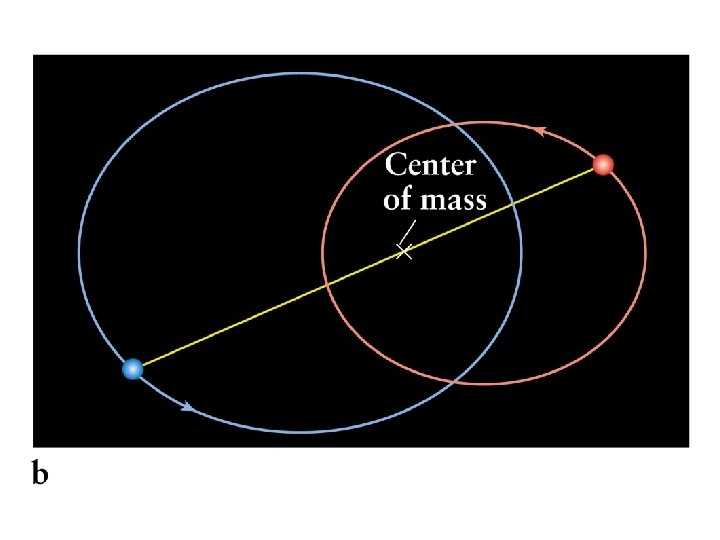
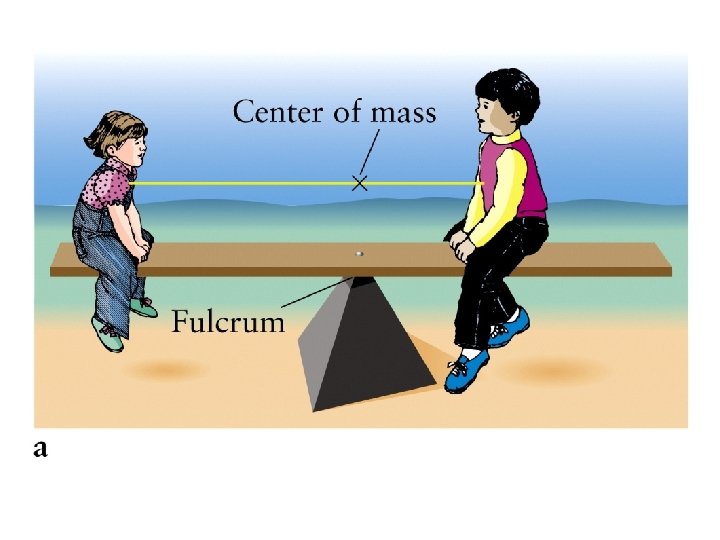
The masses of stars are measured through the analysis of binary star orbits. Radial velocity information is particularly useful for that. Image of a visual binary: Albireo.
A multiple system: Mizar (R) and Alcor (L).
Orbital motion in a visual binary system: ζ UMa.
The orbit of the visual binary 70 Ophiuchi revealed by regular monitoring.
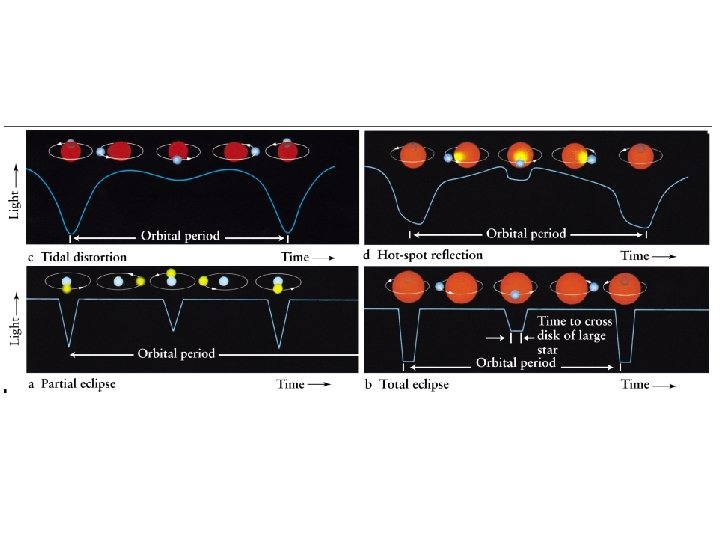
Eclipsing binaries are common. In such systems the orbital plane is close to the line of sight and the orbital period is short, so eclipses (drops in brightness) can be detected regularly. An eclipsing binary system, where one star totally eclipses the other at regular intervals.
An eclipsing binary system in which only partial eclipses occur.
Intensity measures of an eclipsing binary system during total eclipse of the primary star.
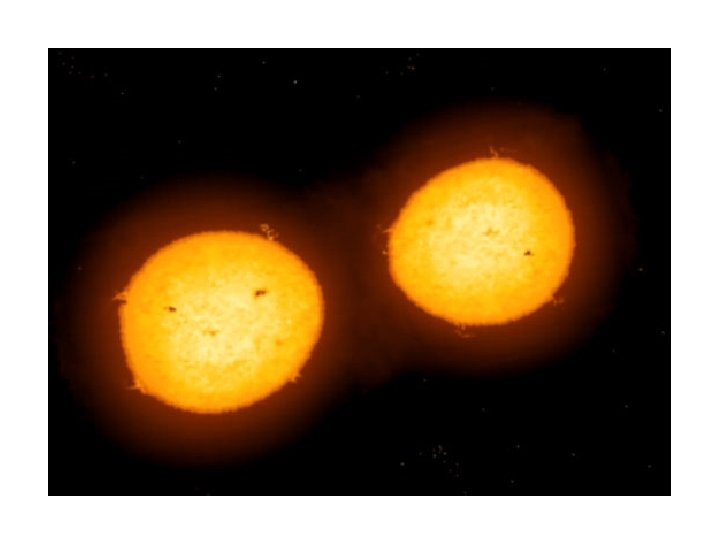
Light curves of eclipsing binaries may also reveal tidal distortions of the two stars caused by their mutual attraction.
Or reveal the presence of hot spots on the cooler star in the system.
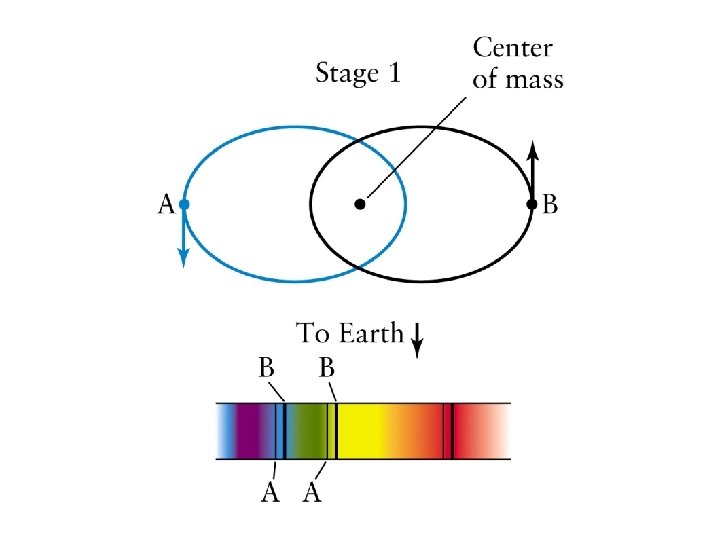
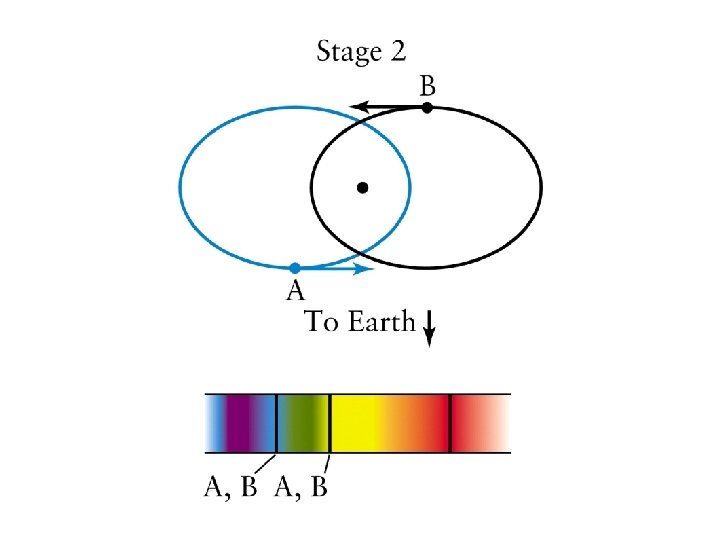
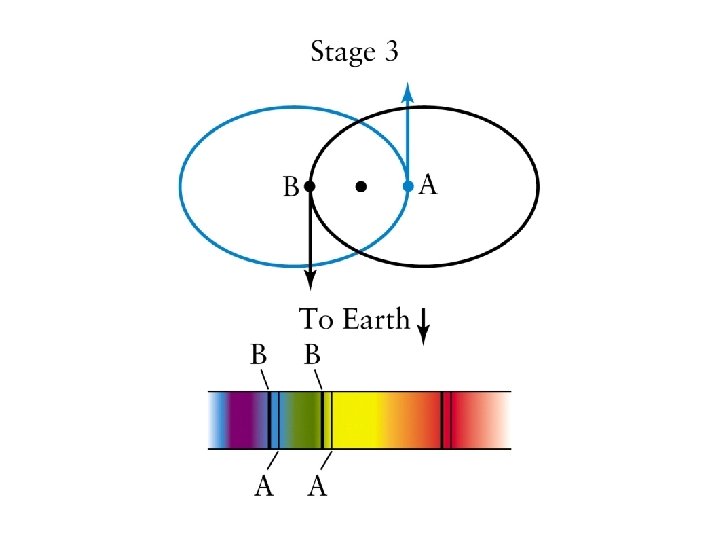
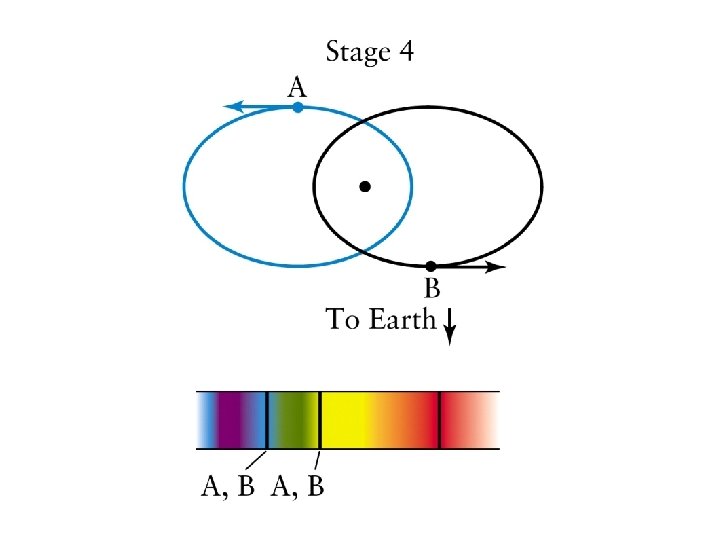
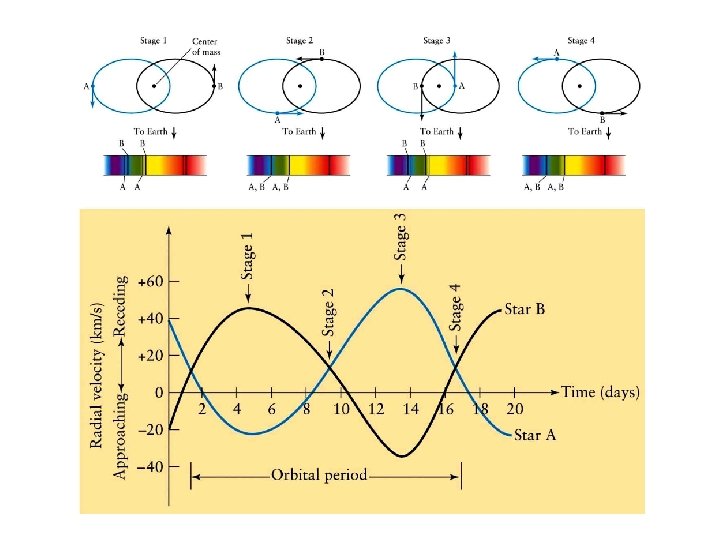
Spectroscopic binaries are among the most useful of binary systems. Binarity is revealed in such systems by the regular variations in the measured radial velocity of the star. The spectral lines of one (or both) stars are revealed through the regular red or blue shifts of their spectral lines. Examples are shown below.
Analysis of the radial velocity curve(s) for a spectroscopic binary provides information on the orbital shape and orientation, but not the orbital inclination to the line of sight.
The “best” systems for giving information on ALL orbital parameters are eclipsing/spectroscopic binaries since orbital inclination is known. From them we obtain information on the masses and luminosities of the two stars in the system. The light curve solution gives the radius and temperature of each star, from which luminosities are derived. Recall that the sum of the masses of the two stars can be found from the semi-major axis of the orbit and the orbital period. Individual masses are found from the orbits of each star relative to the other, and luminosities for visual binaries are derived once the distance is known.
Results: the mass-luminosity relation. The luminosity of a star depends directly on its mass: L ≈ M 4 The relationship applies only to main sequence stars.
The masses of stars along the main sequence in the H-R diagram. Stars of large mass (50 -100 M ) are very hot and luminous: spectral type O. Stars of very small mass (0. 01 -0. 1 M ) are very cool and faint: spectral types M, L, T.
The H-R diagram for bright stars (from the Hipparcos mission). Note that the diagram contains a very large proportion of the most luminous classes of stars.
The proportions of stars of different types.
Astronomical Terminology H-R Diagram. The figure used by Ejnar Hertzsprung and Henry Norris Russell to demonstrate how luminosity relates to temperature in stars. Stefan-Boltzmann Law. The relation describing how a star’s luminosity depends on its surface area and temperature. Dwarf. The term used to describe stars populating the main sequence in a H-R diagram. Giant. A star of 10 -100 R that is more luminous than main-sequence stars. Supergiant. A star of 100 -1000 R that is much more luminous than main-sequence stars. Binary Star. A system of two stars in orbit about each other, designated according to how the orbital motion is detected: visual binary (observed orbital motion), spectroscopic binary (periodic radial velocity shifts), eclipsing binary (mutual eclipses).
Sample Questions 1. Although we think of the Sun as an “average” main-sequence star, it is actually hotter and more luminous than average. Explain. Answer: Pick almost any stellar property to measure (mass, luminosity, size, temperature), and the Sun resides near the geometric mean of the range. However, in terms of absolute numbers of stars, small stars are much more numerous than large stars. In fact, approximately 90 percent of all stars are cooler and less luminous than the Sun.
18. Two stars have the same luminosity but one is larger. Compare their temperatures. Now suppose that the two stars have the same size but one is more luminous. Again, compare their temperatures.
Answer. If two stars have the same luminosity but one is larger, then the larger star must also be cooler. If the two stars have the same size but one is more luminous, then the more luminous star (the brighter one) must be hotter.