1 Preprocessing of FMRI Data f MRI Graduate


 Measured Data Noise Design")
 Task-Related Variability Non-task-related Variability")


 – – From atlas of Talairach")


 After Adjustment to Reference Image Registration courtesy Dr.")


")
 •")


 –")


 Blocked Designs 2) Event-Related Designs a) Periodic Single Trial")


 From Binder et al. , 1999")
 From Huettel et al.")


 Blocked-related Activity (Tonic) Task-Initiation Activity (Tonic) Task-Offset")


- Slides: 99
1. Preprocessing of FMRI Data f. MRI Graduate Course October 22, 2003
What is preprocessing? • Correcting for non-task-related variability in experimental data – Usually done without consideration of experimental design; thus, pre-analysis – Occasionally called post-processing, in reference to being after acquisition • Attempts to remove, rather than model, data variability
Signal, noise, and the General Linear Model Amplitude (solve for) Measured Data Noise Design Model Cf. Boynton et al. , 1996
Signal-Noise-Ratio (SNR) Task-Related Variability Non-task-related Variability
Preprocessing Steps • • Slice Timing Correction Motion Correction Coregistration Normalization Spatial Smoothing Segmentation Region of Interest Identification • Bias field correction
Tools for Preprocessing • • • SPM Brain Voyager Vox. Bo AFNI Custom BIAC scripts
Slice Timing Correction
Why do we correct for slice timing? • Corrects for differences in acquisition time within a TR – Especially important for long TRs (where expected HDR amplitude may vary significantly) – Accuracy of interpolation also decreases with increasing TR • When should it be done? – Before motion correction: interpolates data from (potentially) different voxels • Better for interleaved acquisition – After motion correction: changes in slice of voxels results in changes in time within TR • Better for sequential acquisition
Effects of uncorrected slice timing • • Base Hemodynamic Response Base HDR + Noise Base HDR + Slice Timing Errors Base HDR + Noise + Slice Timing Errors
Base HDR: 2 s TR
Base HDR + Noise r = 0. 77 r = 0. 81 r = 0. 80
Base HDR + Slice Timing Errors r = 0. 92 r = 0. 85 r = 0. 62
HDR + Noise + Slice Timing r = 0. 65 r = 0. 67 r = 0. 19
Interpolation Strategies • Linear interpolation • Spline interpolation • Sinc interpolation
Motion Correction
Head Motion: Good, Bad, …
… and catastrophically bad
Why does head motion introduce problems? A B C
Simulated Head Motion
Severe Head Motion: Simulation Two 4 s movements of 8 mm in -Y direction (during task epochs) Motion
Severe Head Motion: Real Data Two 4 s movements of 8 mm in –Y direction (during task epochs) Motion
Correcting Head Motion • Rigid body transformation – 6 parameters: 3 translation, 3 rotation • Minimization of some cost function – E. g. , sum of squared differences
Effects of Head Motion Correction
Limitations of Motion Correction • Artifact-related limitations – Loss of data at edges of imaging volume – Ghosts in image do not change in same manner as real data • Distortions in f. MRI images – Distortions may be dependent on position in field, not position in head • Intrinsic problems with correction of both slice timing and head motion
Prevention is the best medicine A C B D
Coregistration
Should you Coregister? • Advantages – – Aids in normalization Allows display of activation on anatomical images Allows comparison across modalities Necessary if no coplanar anatomical images • Disadvantages – May severely distort functional data – May reduce correspondence between functional and anatomical images
Normalization
Standardized Spaces • Talairach space (proportional grid system) – – From atlas of Talairach and Tournoux (1988) Based on single subject (60 y, Female, Cadaver) Single hemisphere Related to Brodmann coordinates • Montreal Neurological Institute (MNI) space – Combination of many MRI scans on normal controls • All right-handed subjects – Approximated to Talaraich space • Slightly larger • Taller from AC to top by 5 mm; deeper from AC to bottom by 10 mm – Used by SPM, National f. MRI Database, International Consortium for Brain Mapping
Normalization to Template Normalization Template Normalized Data
Anterior and Posterior Commissures Anterior Commissure Posterior Commissure
Should you normalize? • Advantages – – Allows generalization of results to larger population Improves comparison with other studies Provides coordinate space for reporting results Enables averaging across subjects • Disadvantages – Reduces spatial resolution – May reduce activation strength by subject averaging – Time consuming, potentially problematic • Doing bad normalization is much worse than not normalizing
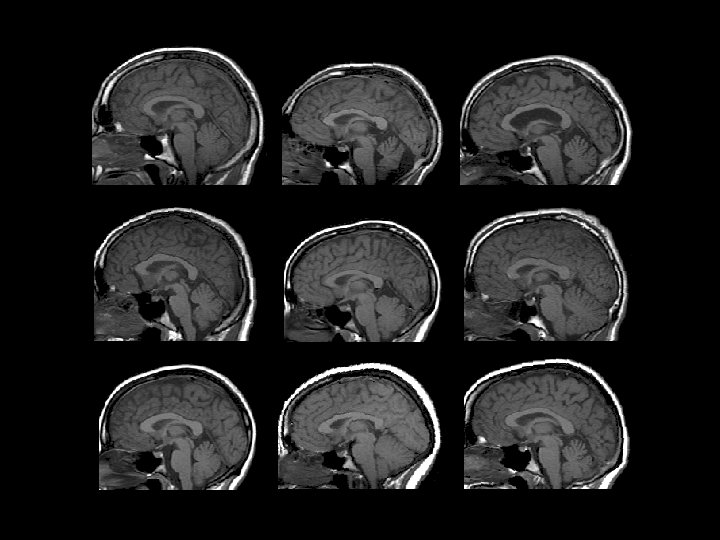
Slice-Based Normalization Before Adjustment (15 Subjects) After Adjustment to Reference Image Registration courtesy Dr. Martin Mc. Keown (BIAC)
Spatial Smoothing
Techniques for Smoothing • Application of Gaussian kernel – Usually expressed in #mm FWHM – “Full Width – Half Maximum” – Typically ~2 times voxel size
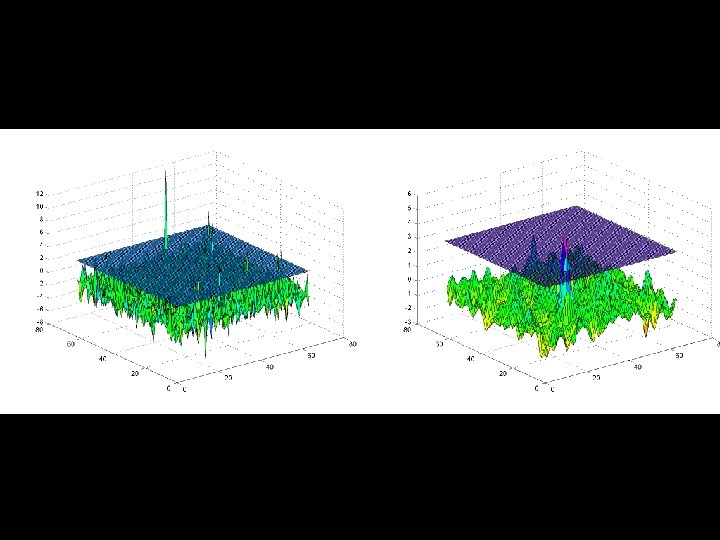
Effects of Smoothing on Activity Unsmoothed Data Smoothed Data (kernel width 5 voxels)
Should you spatially smooth? • Advantages – Increases Signal to Noise Ratio (SNR) • Matched Filter Theorem: Maximum increase in SNR by filter with same shape/size as signal – Reduces number of comparisons • Allows application of Gaussian Field Theory – May improve comparisons across subjects • Signal may be spread widely across cortex, due to intersubject variability • Disadvantages – Reduces spatial resolution – Challenging to smooth accurately if size/shape of signal is not known
Segmentation • Classifies voxels within an image into different anatomical divisions – Gray Matter – White Matter – Cerebro-spinal Fluid (CSF) Image courtesy J. Bizzell & A. Belger
Histogram of Voxel Intensities
Region of Interest Drawing
Why use an ROI-based approach? • Allows direct, unbiased measurement of activity in an anatomical region – Assumes functional divisions tend to follow anatomical divisions • Improves ability to identify topographic changes – Motor mapping (central sulcus) – Social perception mapping (superior temporal sulcus) • Complements voxel-based analyses
Drawing ROIs • Drawing Tools – BIAC software (e. g. , Overlay 2) – Analyze – IRIS/SNAP (G. Gerig) • Reference Works – Print atlases – Online atlases • Analysis Tools – roi_analysis_script. m
ROI Examples
BIAC is studying biological motion and social perception – here by determining how context modulates brain activity in elicited when a subject watches a character shift gaze toward or away from a target.
Additional Resources • SPM website – http: //www. fil. ion. ucl. ac. uk/spm/course/notes 01. html – SPM Manual • Brain viewers – http: //www. bic. mni. mcgill. ca/cgi/icbm_view/
2. Issues in Experimental Design f. MRI Graduate Course October 23, 2003
What is Experimental Design? • Controlling the timing and quality of presented stimuli to influence resulting brain processes • What can we control? – – Experimental comparisons (what is to be measured? ) Stimulus properties (what is presented? ) Stimulus timing (when is it presented? ) Subject instructions (what do subjects do with it? )
Goals of Experimental Design • To maximize the ability to test hypotheses • To facilitate generation of new hypotheses
What are hypotheses? • Statements about the relations between independent and dependent variables. A B C D Hemodynamic Hypotheses Neuronal Hypotheses Psychological Hypotheses
Independent Variables • Aspects of the experimental design that we want to manipulate – Often have multiple levels (e. g. , experimental and control conditions) – Critical design choice lies in determining how to choose stimuli to match independent variable A B C
Dependent Variable: BOLD signal
Causal and non-causal relations between variables A B Is the BOLD response epiphenomenal?
Detection vs. Estimation • Detection: What is active? • Estimation: How does its activity change over time?
Detection • Detection power defined by SNR = a. M/ M = hemodynamic changes (unit) a = measured amplitude = noise standard deviation • Depends greatly on hemodynamic response shape
Estimation • Ability to determine the shape of f. MRI response • Accurate estimation relies on minimization of variance in estimate of HDR at each time point • Efficiency of estimation is generally independent of HDR form
Optimal Experimental Design • Maximizing both Detection and Estimation – Maximal variance in stimulus timing (increases estimation) – Maximal variance in measured signal (increases detection) • Limitations – Refractory effects – Signal saturation
f. MRI Design Types 1) Blocked Designs 2) Event-Related Designs a) Periodic Single Trial b) Jittered Single Trial c) Staggered Single Trial 3) Mixed Designs a) Combination blocked/event-related b) Variable stimulus probability
1. Blocked Designs
What are Blocked Designs? • Blocked designs segregate different cognitive processes into distinct time periods Task A Task B Task A REST Task B REST
PET Designs • Measurements done following injection of radioactive bolus • Uses total activity throughout task interval (~30 s) • Blocked designs necessary – Task 1 = Injection 1 – Task 2 = Injection 2
Choosing Length of Blocks • Longer block lengths allow for stability of extended responses – Hemodynamic response saturates following extended stimulation • After about 10 s, activation reaches max – Many tasks require extended intervals • Processing may differ throughout the task period • Shorter block lengths allow for more transitions – Task-related variability increases (relative to non-task) with increasing numbers of transitions • Periodic blocks may result in aliasing of other variance in the data – Example: if the person breathes at a regular rate of 1 breath/5 sec, and the blocks occur every 10 s
Effects of Block Interval upon HDR 40 s 20 s 15 s 10 s 8 s 6 s 4 s 2 s
What baseline should you choose? • Task A vs. Task B – Example: Squeezing Right Hand vs. Left Hand – Allows you to distinguish differential activation between conditions – Does not allow identification of activity common to both tasks • Can control for uninteresting activity • Task A vs. No-task – Example: Squeezing Right Hand vs. Rest – Shows you activity associated with task – May introduce unwanted results
Interpreting Baseline Activity From Gusnard & Raichle, 2001
Non-Task Processing • In many experiments, activation is greater in baseline conditions than in task conditions! – Requires interpretations of significant activation • Suggests the idea of baseline/resting mental processes – – – Emotional processes Gathering/evaluation about the world around you Awareness (of self) Online monitoring of sensory information Daydreaming
From Shulman et al. , 1997 (PET data) From Binder et al. , 1999
From Huettel et al. , 2002 (Baseline > Target Detection) From Huettel et al. , 2001 (Change Detection)
Power in Blocked Designs 1. Summation of responses results in large variance Single, unit amplitude HDR, convolved by 1, 2, 4 , 8, 12, or 16 events (1 s apart).
HDR Estimation: Blocked Designs
Power in Blocked Designs 2. Transitions between blocks Simulation of single run with either 2 or 10 blocks.
Power in Blocked Designs 2. Transitions between blocks Addition of linear drift within run.
Power in Blocked Designs 2. Transitions between blocks Addition of noise (SNR = 0. 67)
Limitations of Blocked Designs • Very sensitive to signal drift – Sensitive to head motion, especially when only a few blocks are used. • Poor choice of baseline may preclude meaningful conclusions • Many tasks cannot be conducted repeatedly • Difficult to estimate the HDR
2. Event-Related Designs
What are Event-Related Designs? • Event-related designs associate brain processes with discrete events, which may occur at any point in the scanning session. time
Why use event-related designs? • Some experimental tasks are naturally event-related • Allows studying of trial effects • Simple analyses – Selective averaging – No assumptions of linearity required
Event-Related and Blocked Designs give Similar Results A B C
2 a. Periodic Single Trial Designs • Stimulus events presented infrequently with long interstimulus intervals 500 ms 18 s
Trial Spacing Effects: Periodic Designs 20 sec 12 sec 8 sec 4 sec
ISI: Interstimulus Interval SD: Stimulus Duration From Bandettini and Cox, 2000
2 b. Jittered Single Trial Designs • Varying the timing of trials within a run
Randomization = Jittering Dale & Buckner, 1997
Extracting different task components A B
Effects of Jittering on Stimulus Variance
Effects of ISI on Power Birn et al, 2002
2 c. Staggered Single Trial • By presenting stimuli at different timings, relative to a TR, you can achieve sub-TR resolution • Significant cost in number of trials presented – Resulting loss in experimental power • Very sensitive to scanner drift and other sources of variability
+0 s Two HDR epochs sampled at a 3 s TR. +1 s Each row is sampled at a different phase. +2 s
+0 s Two of the phases are normal. +1 s +2 s But, one has a change in one trial (e. g. , head motion)
Post-Hoc Sorting of Trials Data from old/new episodic memory test. From Konishi, et al. , 2000
Limitations of Event-Related Designs • Differential effects of interstimulus interval – Long intervals do not optimally increase stimulus variance – Short intervals may result in refractory effects • Detection ability dependent on form of HDR • Length of “event” may not be known
3. Mixed Designs
3 a. Combination Blocked/Event • Both blocked and event-related design aspects are used (for different purposes) – Blocked design is used to evaluate state-dependent effects – Event-related design is used to evaluate item-related effects • Analyses are conducted largely independently between the two measures – Cognitive processes are assumed to be independent
Mixed Blocked/Event-related Design … Target-related Activity (Phasic) Blocked-related Activity (Tonic) Task-Initiation Activity (Tonic) Task-Offset Activity (Tonic) …
Mixed designs Donaldson et al. , 2001
3 b. Variable Stimulus Probability • Stimulus probability is varied in a blocked fashion – Appears similar to the combination design • Mixed design used to maximize experimental power for single design • Assumes that processes of interest do not vary as a function of stimulus timing – Cognitive processing – Refractory effects
Random and Semi-Random Designs From Liu et al. , 2001
Summary of Experiment Design • Main Issues to Consider – What design constraints are induced by my task? – What am I trying to measure? – What sorts of non-task-related variability do I want to avoid? • Rules of thumb – Blocked Designs: • Powerful for detecting activation • Useful for examining state changes – Event-Related Designs: • Powerful for estimating time course of activity • Allows determination of baseline activity • Best for post hoc trial sorting – Mixed Designs • Best combination of detection and estimation • Much more complicated analyses