
FMRI Analysis Experiment Design Scanning PreProcessing Individual Subject
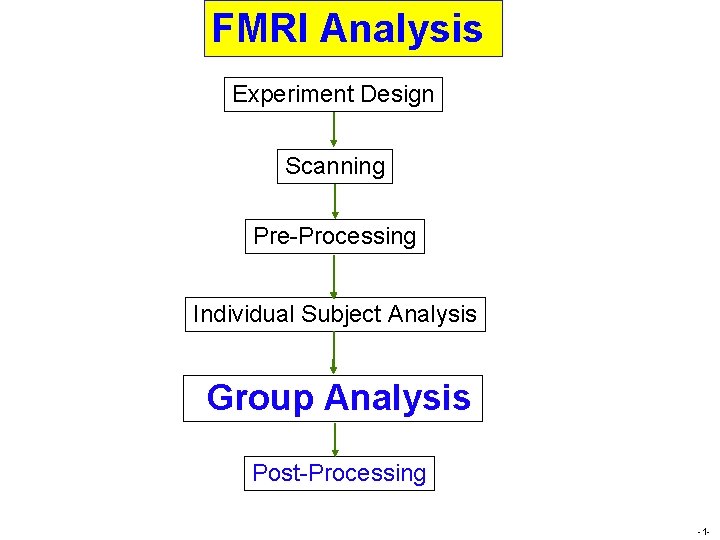
FMRI Analysis Experiment Design Scanning Pre-Processing Individual Subject Analysis Group Analysis Post-Processing -1 -
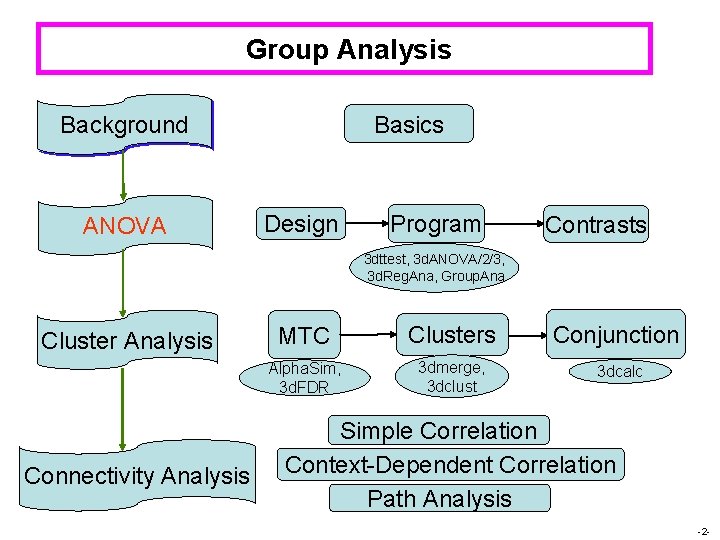
Group Analysis Basics Background ANOVA Design Program Contrasts 3 dttest, 3 d. ANOVA/2/3, 3 d. Reg. Ana, Group. Ana Cluster Analysis Connectivity Analysis MTC Clusters Conjunction Alpha. Sim, 3 d. FDR 3 dmerge, 3 dclust 3 dcalc Simple Correlation Context-Dependent Correlation Path Analysis -2 -
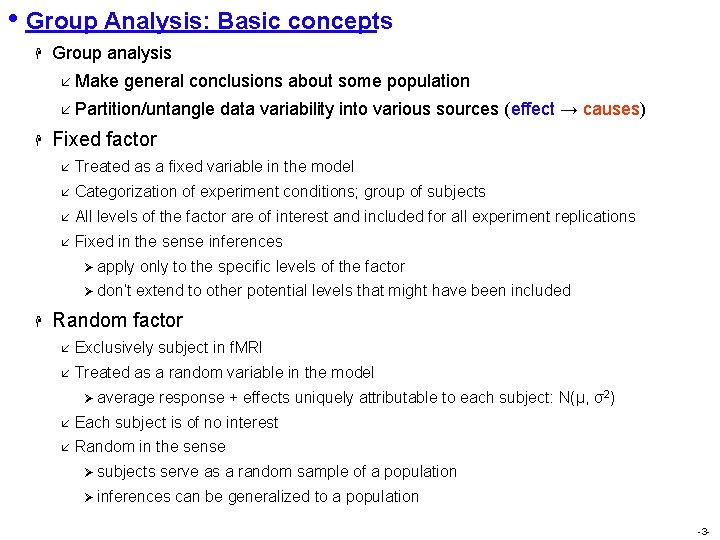
• Group Analysis: Basic concepts H Group analysis å Make general conclusions about some population å Partition/untangle data variability into various sources (effect → causes) H Fixed factor å Treated as a fixed variable in the model å Categorization of experiment conditions; group of subjects å All levels of the factor are of interest and included for all experiment replications å Fixed in the sense inferences Ø apply only to the specific levels of the factor Ø don’t extend to other potential levels that might have been included H Random factor å Exclusively subject in f. MRI å Treated as a random variable in the model Ø average response + effects uniquely attributable to each subject: N(μ, σ2) å Each subject is of no interest å Random in the sense Ø subjects serve as a random sample of a population Ø inferences can be generalized to a population -3 -
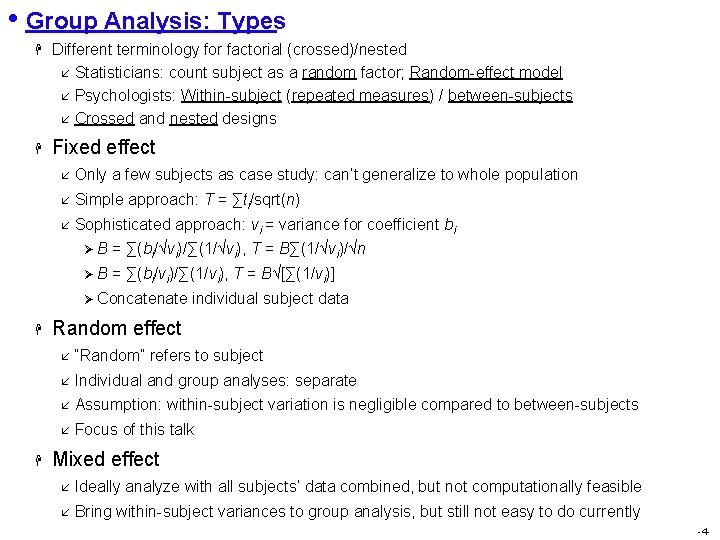
• Group Analysis: Types H Different terminology for factorial (crossed)/nested å Statisticians: count subject as a random factor; Random-effect model å Psychologists: Within-subject (repeated measures) / between-subjects å Crossed and nested designs H Fixed effect å Only a few subjects as case study: can’t generalize to whole population å Simple approach: T = ∑ti/sqrt(n) å Sophisticated approach: vi = variance for coefficient bi Ø B = ∑(bi/√vi)/∑(1/√vi), T = B∑(1/√vi)/√n Ø B = ∑(bi/vi)/∑(1/vi), T = B√[∑(1/vi)] Ø Concatenate individual subject data H H Random effect å “Random” refers to subject å Individual and group analyses: separate å Assumption: within-subject variation is negligible compared to between-subjects å Focus of this talk Mixed effect å Ideally analyze with all subjects’ data combined, but not computationally feasible å Bring within-subject variances to group analysis, but still not easy to do currently -4 -
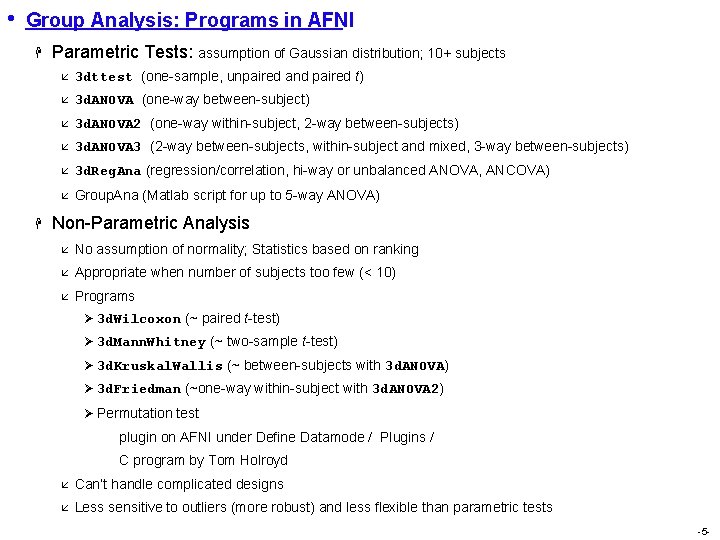
• Group Analysis: Programs in AFNI H H Parametric Tests: assumption of Gaussian distribution; 10+ subjects å 3 dttest (one-sample, unpaired and paired t) å 3 d. ANOVA (one-way between-subject) å 3 d. ANOVA 2 (one-way within-subject, 2 -way between-subjects) å 3 d. ANOVA 3 (2 -way between-subjects, within-subject and mixed, 3 -way between-subjects) å 3 d. Reg. Ana (regression/correlation, hi-way or unbalanced ANOVA, ANCOVA) å Group. Ana (Matlab script for up to 5 -way ANOVA) Non-Parametric Analysis å No assumption of normality; Statistics based on ranking å Appropriate when number of subjects too few (< 10) å Programs Ø 3 d. Wilcoxon (~ paired t-test) Ø 3 d. Mann. Whitney (~ two-sample t-test) Ø 3 d. Kruskal. Wallis (~ between-subjects with 3 d. ANOVA) Ø 3 d. Friedman (~one-way within-subject with 3 d. ANOVA 2) Ø Permutation test plugin on AFNI under Define Datamode / Plugins / C program by Tom Holroyd å Can’t handle complicated designs å Less sensitive to outliers (more robust) and less flexible than parametric tests -5 -

• Group Analysis: Overview H H How many subjects? å Power/efficiency: proportional to √n; n > 10 å Balance: Equal number of subjects across groups if possible Input å Common brain in tlrc space (resolution doesn’t have to be 1 x 1 x 1 mm 3 ) å % signal change (not statistics) or normalized variables Ø HRF magnitude: Regression coefficients Ø Contrasts H Design å Number of factors å Number of levels for each factor å Within-subject or repeated-measures vs. between-subjects Ø Fixed (factors of interest) vs. random (subject) Ø Nesting: Balanced? å Which program? H Contrasts and trend analysis H Thresholding: One- or two-tail? -6 -
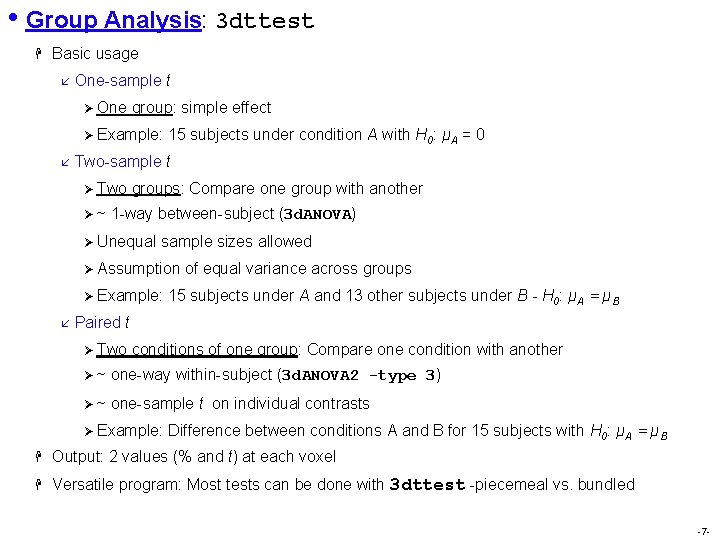
• Group Analysis: 3 dttest H Basic usage å One-sample t Ø One group: simple effect Ø Example: 15 subjects under condition A with H 0: μ A = 0 å Two-sample t Ø Two groups: Compare one group with another Ø ~ 1 -way between-subject (3 d. ANOVA) Ø Unequal sample sizes allowed Ø Assumption of equal variance across groups Ø Example: 15 subjects under A and 13 other subjects under B - H 0: μ A = μ B å Paired t Ø Two conditions of one group: Compare one condition with another Ø ~ one-way within-subject (3 d. ANOVA 2 -type 3) Ø ~ one-sample t on individual contrasts Ø Example: Difference between conditions A and B for 15 subjects with H 0: μ A = μ B H Output: 2 values (% and t) at each voxel H Versatile program: Most tests can be done with 3 dttest -piecemeal vs. bundled -7 -
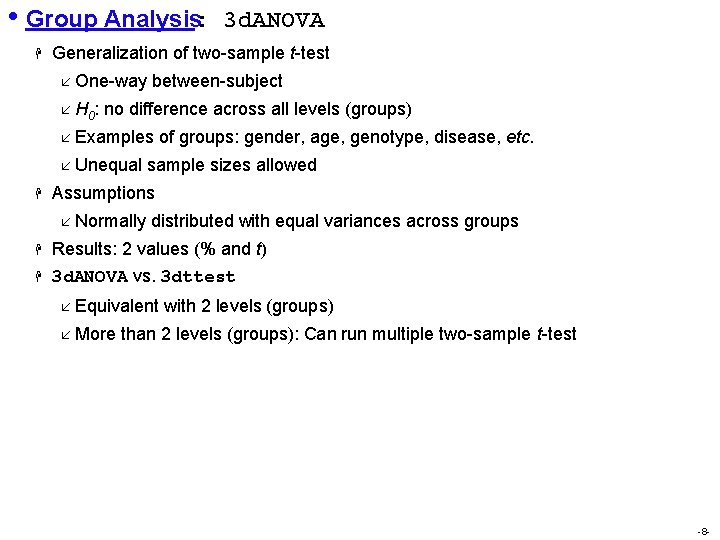
• Group Analysis: H 3 d. ANOVA Generalization of two-sample t-test å One-way between-subject å H 0: no difference across all levels (groups) å Examples of groups: gender, age, genotype, disease, etc. å Unequal sample sizes allowed H Assumptions å Normally distributed with equal variances across groups H H Results: 2 values (% and t) 3 d. ANOVA vs. 3 dttest å Equivalent with 2 levels (groups) å More than 2 levels (groups): Can run multiple two-sample t-test -8 -
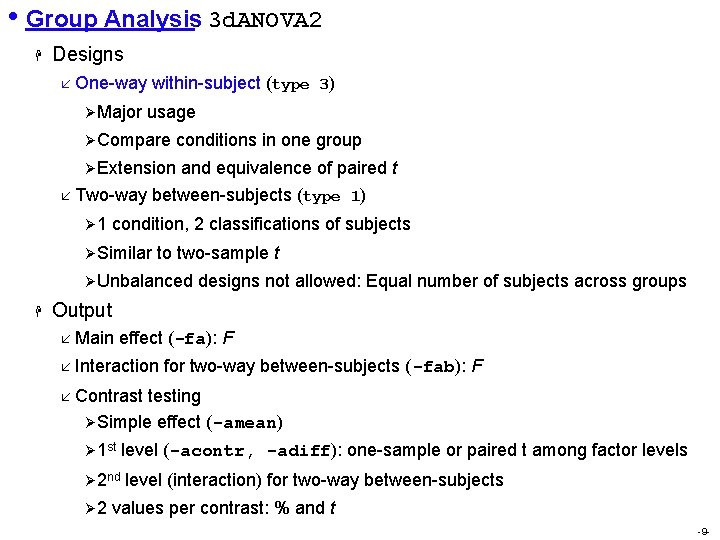
• Group Analysis: 3 d. ANOVA 2 H Designs å One-way within-subject (type 3) Ø Major usage Ø Compare conditions in one group Ø Extension and equivalence of paired t å Two-way between-subjects (type 1) Ø 1 condition, 2 classifications of subjects Ø Similar to two-sample t Ø Unbalanced designs not allowed: Equal number of subjects across groups H Output å Main effect (-fa): F å Interaction for two-way between-subjects (-fab): F å Contrast testing Ø Simple effect (-amean) Ø 1 st level (-acontr, -adiff): one-sample or paired t among factor levels Ø 2 nd level (interaction) for two-way between-subjects Ø 2 values per contrast: % and t -9 -
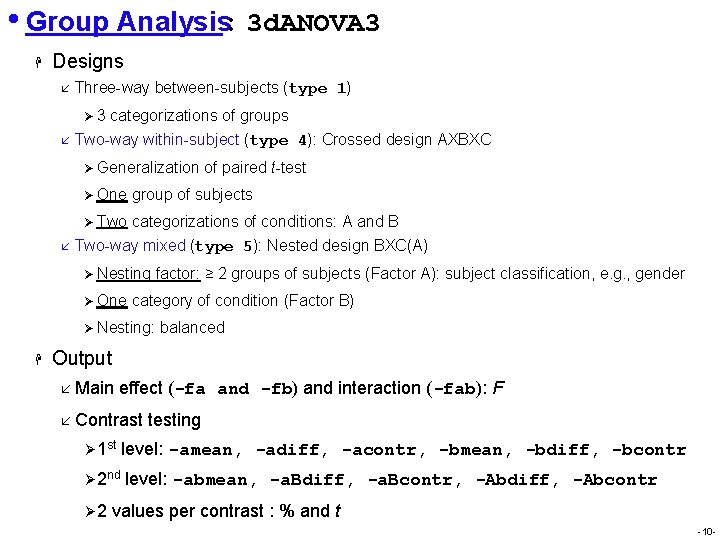
• Group Analysis: 3 d. ANOVA 3 H Designs å Three-way between-subjects (type 1) Ø 3 categorizations of groups å Two-way within-subject (type 4): Crossed design AXBXC Ø Generalization of paired t-test Ø One group of subjects Ø Two categorizations of conditions: A and B å Two-way mixed (type 5): Nested design BXC(A) Ø Nesting factor: ≥ 2 groups of subjects (Factor A): subject classification, e. g. , gender Ø One category of condition (Factor B) Ø Nesting: balanced H Output å Main effect (-fa and -fb) and interaction (-fab): F å Contrast testing Ø 1 st level: -amean, -adiff, -acontr, -bmean, -bdiff, -bcontr Ø 2 nd level: -abmean, -a. Bdiff, -a. Bcontr, -Abdiff, -Abcontr Ø 2 values per contrast : % and t -10 -
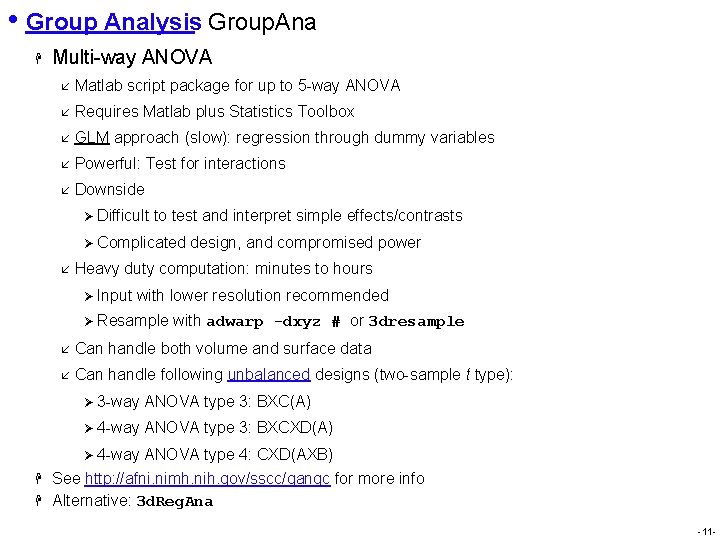
• Group Analysis: Group. Ana H Multi-way ANOVA å Matlab script package for up to 5 -way ANOVA å Requires Matlab plus Statistics Toolbox å GLM approach (slow): regression through dummy variables å Powerful: Test for interactions å Downside Ø Difficult to test and interpret simple effects/contrasts Ø Complicated design, and compromised power å Heavy duty computation: minutes to hours Ø Input with lower resolution recommended Ø Resample with adwarp -dxyz # or 3 dresample å Can handle both volume and surface data å Can handle following unbalanced designs (two-sample t type): Ø 3 -way ANOVA type 3: BXC(A) Ø 4 -way ANOVA type 3: BXCXD(A) Ø 4 -way ANOVA type 4: CXD(AXB) H H See http: //afni. nimh. nih. gov/sscc/gangc for more info Alternative: 3 d. Reg. Ana -11 -
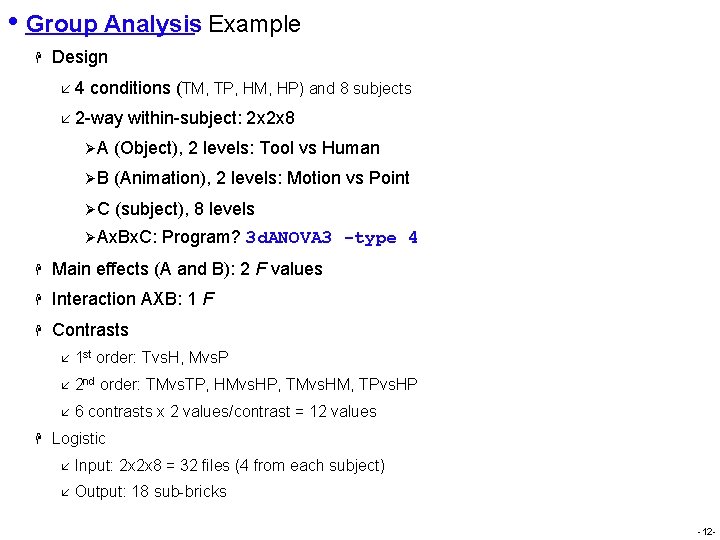
• Group Analysis: Example H Design å 4 conditions (TM, TP, HM, HP) and 8 subjects å 2 -way within-subject: 2 x 2 x 8 Ø A (Object), 2 levels: Tool vs Human Ø B (Animation), 2 levels: Motion vs Point Ø C (subject), 8 levels Ø Ax. Bx. C: Program? 3 d. ANOVA 3 H Main effects (A and B): 2 F values H Interaction AXB: 1 F H Contrasts H -type 4 å 1 st order: Tvs. H, Mvs. P å 2 nd order: TMvs. TP, HMvs. HP, TMvs. HM, TPvs. HP å 6 contrasts x 2 values/contrast = 12 values Logistic å Input: 2 x 2 x 8 = 32 files (4 from each subject) å Output: 18 sub-bricks -12 -
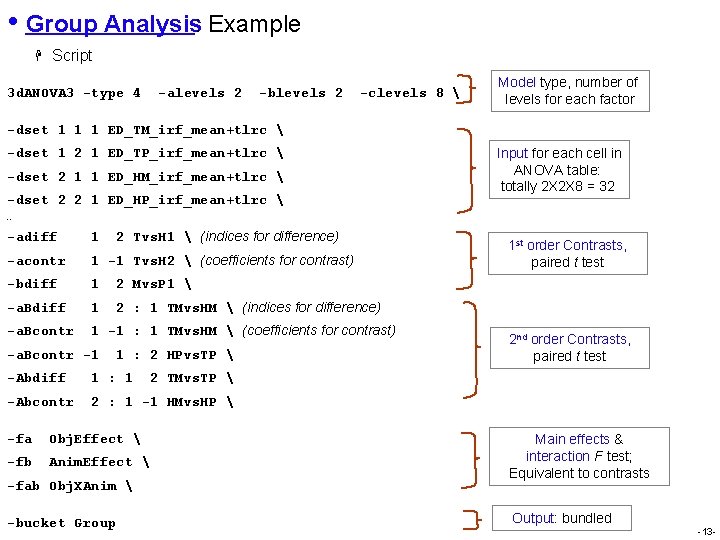
• Group Analysis: Example H Script 3 d. ANOVA 3 -type 4 -alevels 2 -blevels 2 -clevels 8 Model type, number of levels for each factor -dset 1 1 1 ED_TM_irf_mean+tlrc -dset 1 2 1 ED_TP_irf_mean+tlrc -dset 2 1 1 ED_HM_irf_mean+tlrc -dset 2 2 1 ED_HP_irf_mean+tlrc Input for each cell in ANOVA table: totally 2 X 2 X 8 = 32 … 2 Tvs. H 1 (indices for difference) -adiff 1 -acontr 1 -1 Tvs. H 2 (coefficients for contrast) -bdiff 1 2 Mvs. P 1 -a. Bdiff 1 2 : 1 TMvs. HM (indices for difference) -a. Bcontr 1 -1 : 1 TMvs. HM (coefficients for contrast) -a. Bcontr -1 1 : 2 HPvs. TP -Abdiff 1 : 1 -Abcontr 2 : 1 -1 HMvs. HP Obj. Effect -fb Anim. Effect -bucket Group 2 nd order Contrasts, paired t test 2 TMvs. TP -fab Obj. XAnim 1 st order Contrasts, paired t test Main effects & interaction F test; Equivalent to contrasts Output: bundled -13 -

• Group Analysis: Example H Alternative approaches å Group. Ana å 3 d. Reg. Ana å Paired t: 6 tests Ø Program: 3 dttest -paired Ø For TM vs HM: 16 (2 x 8) input files (β coefficients: %) from each subject 3 dttest -paired -prefix TMvs. HM -set 1 ED_TM_irf_mean+tlrc. . . ZS_TM_irf_mean+tlrc -set 2 ED_HM_irf_mean+tlrc. . . ZS_HM_irf_mean+tlrc å One-sample t : 6 tests Ø Program: 3 dttest Ø For TM vs HM: 8 input files (contrasts: %) from each subject 3 dttest -prefix TMvs. HM -base 1 0 -set 2 ED_TMvs. HM_irf_mean+tlrc. . . ZS_TMvs. HM_irf_mean+tlrc -14 -
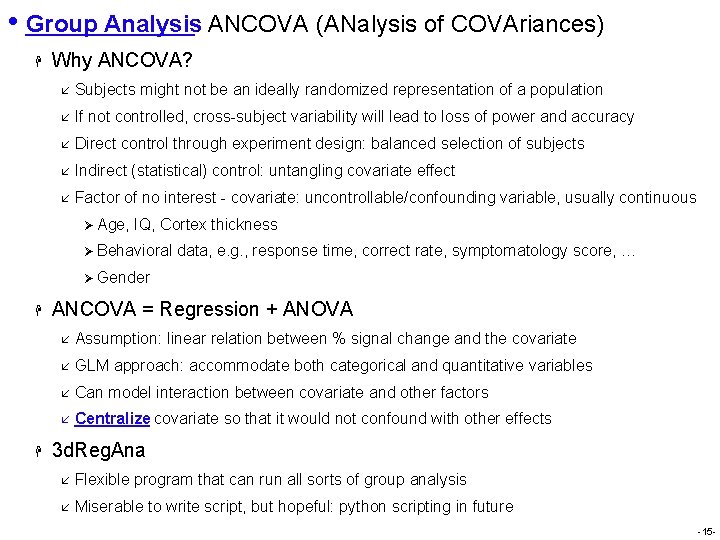
• Group Analysis: ANCOVA (ANalysis of COVAriances) H Why ANCOVA? å Subjects might not be an ideally randomized representation of a population å If not controlled, cross-subject variability will lead to loss of power and accuracy å Direct control through experiment design: balanced selection of subjects å Indirect (statistical) control: untangling covariate effect å Factor of no interest - covariate: uncontrollable/confounding variable, usually continuous Ø Age, IQ, Cortex thickness Ø Behavioral data, e. g. , response time, correct rate, symptomatology score, … Ø Gender H H ANCOVA = Regression + ANOVA å Assumption: linear relation between % signal change and the covariate å GLM approach: accommodate both categorical and quantitative variables å Can model interaction between covariate and other factors å Centralize covariate so that it would not confound with other effects 3 d. Reg. Ana å Flexible program that can run all sorts of group analysis å Miserable to write script, but hopeful: python scripting in future -15 -
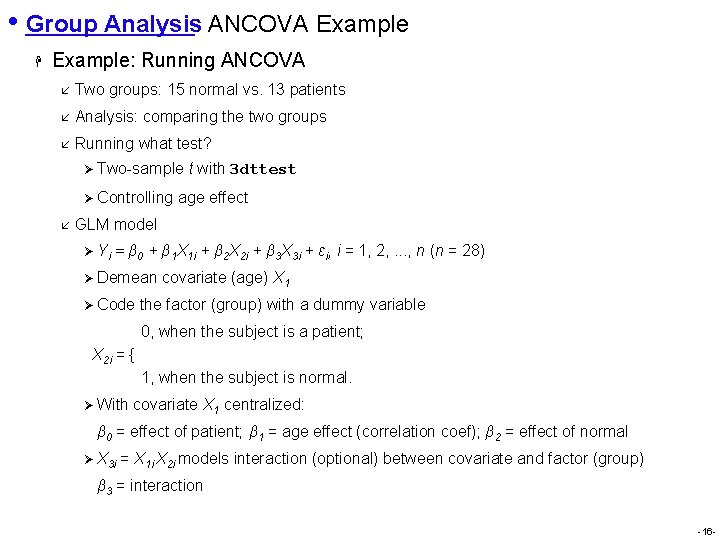
• Group Analysis: ANCOVA Example H Example: Running ANCOVA å Two groups: 15 normal vs. 13 patients å Analysis: comparing the two groups å Running what test? Ø Two-sample t with 3 dttest Ø Controlling age effect å GLM model Ø Yi = β 0 + β 1 X 1 i + β 2 X 2 i + β 3 X 3 i + εi, i = 1, 2, . . . , n (n = 28) Ø Demean covariate (age) X 1 Ø Code the factor (group) with a dummy variable 0, when the subject is a patient; X 2 i = { 1, when the subject is normal. Ø With covariate X 1 centralized: β 0 = effect of patient; β 1 = age effect (correlation coef); β 2 = effect of normal Ø X 3 i = X 1 i X 2 i models interaction (optional) between covariate and factor (group) β 3 = interaction -16 -
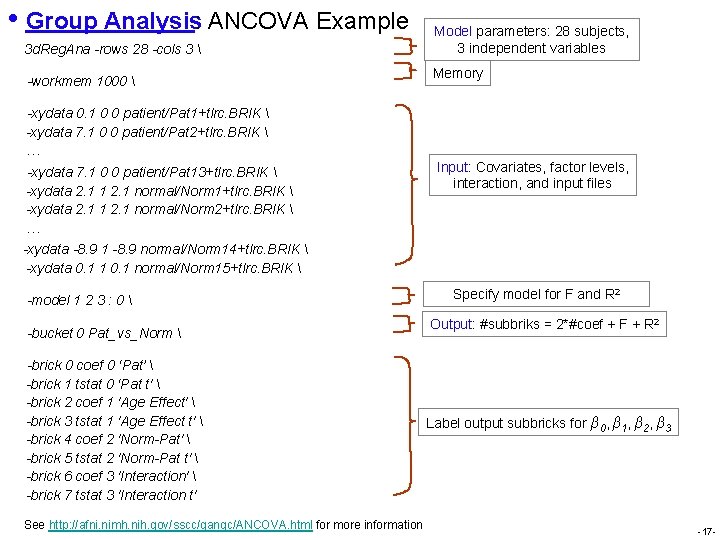
• Group Analysis: ANCOVA Example 3 d. Reg. Ana -rows 28 -cols 3 -workmem 1000 Model parameters: 28 subjects, 3 independent variables Memory -xydata 0. 1 0 0 patient/Pat 1+tlrc. BRIK -xydata 7. 1 0 0 patient/Pat 2+tlrc. BRIK … -xydata 7. 1 0 0 patient/Pat 13+tlrc. BRIK -xydata 2. 1 1 2. 1 normal/Norm 1+tlrc. BRIK -xydata 2. 1 1 2. 1 normal/Norm 2+tlrc. BRIK … Input: Covariates, factor levels, interaction, and input files -xydata -8. 9 1 -8. 9 normal/Norm 14+tlrc. BRIK -xydata 0. 1 1 0. 1 normal/Norm 15+tlrc. BRIK -model 1 2 3 : 0 -bucket 0 Pat_vs_Norm -brick 0 coef 0 ‘Pat’ -brick 1 tstat 0 ‘Pat t' -brick 2 coef 1 'Age Effect' -brick 3 tstat 1 'Age Effect t' -brick 4 coef 2 'Norm-Pat' -brick 5 tstat 2 'Norm-Pat t' -brick 6 coef 3 'Interaction' -brick 7 tstat 3 'Interaction t' See http: //afni. nimh. nih. gov/sscc/gangc/ANCOVA. html for more information Specify model for F and R 2 Output: #subbriks = 2*#coef + F + R 2 Label output subbricks for β 0, β 1, β 2, β 3 -17 -
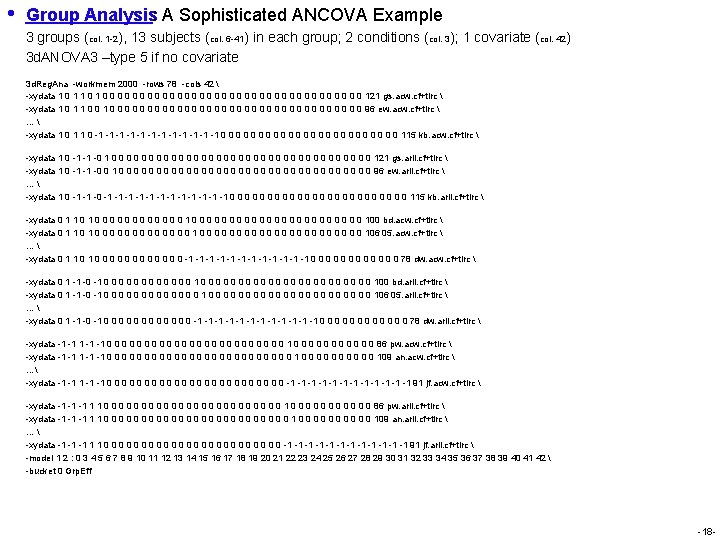
• Group Analysis: A Sophisticated ANCOVA Example 3 groups (col. 1 -2), 13 subjects (col. 6 -41) in each group; 2 conditions (col. 3); 1 covariate (col. 42) 3 d. ANOVA 3 –type 5 if no covariate 3 d. Reg. Ana -workmem 2000 -rows 78 -cols 42 -xydata 1 0 1 0 0 0 0 0 0 0 0 0 121 gs. acw. cf+tlrc -xydata 1 0 1 1 0 0 0 0 0 0 0 0 0 96 ew. acw. cf+tlrc … -xydata 1 0 1 1 0 -1 -1 -1 0 0 0 0 0 0 115 kb. acw. cf+tlrc -xydata 1 0 -1 -1 -0 1 0 0 0 0 0 0 0 0 0 121 gs. aril. cf+tlrc -xydata 1 0 -1 -1 -0 0 1 0 0 0 0 0 0 0 0 0 96 ew. aril. cf+tlrc … -xydata 1 0 -1 -1 -1 -1 0 0 0 0 0 0 115 kb. aril. cf+tlrc -xydata 0 1 1 0 0 0 0 0 0 0 0 0 0 0 0 100 bd. acw. cf+tlrc -xydata 0 1 1 0 0 0 0 0 0 0 0 0 0 0 106 05. acw. cf+tlrc … -xydata 0 1 1 0 0 0 0 -1 -1 -1 0 0 0 78 dw. acw. cf+tlrc -xydata 0 1 -1 -0 -1 0 0 0 0 0 0 0 0 0 100 bd. aril. cf+tlrc -xydata 0 1 -1 -0 -1 0 0 0 0 0 0 0 0 0 106 05. aril. cf+tlrc … -xydata 0 1 -1 -0 -1 0 0 0 -1 -1 -1 0 0 0 78 dw. aril. cf+tlrc -xydata -1 -1 -1 0 0 0 0 0 0 1 0 0 0 86 pw. acw. cf+tlrc -xydata -1 -1 -1 0 0 0 0 0 0 0 1 0 0 0 0 0 109 an. acw. cf+tlrc … -xydata -1 -1 -1 0 0 0 0 0 0 -1 -1 -1 91 jf. acw. cf+tlrc -xydata -1 -1 -1 1 1 0 0 0 0 0 0 1 0 0 0 86 pw. aril. cf+tlrc -xydata -1 -1 -1 1 1 0 0 0 0 0 0 0 1 0 0 0 0 0 109 an. aril. cf+tlrc … -xydata -1 -1 -1 1 1 0 0 0 0 0 0 -1 -1 -1 91 jf. aril. cf+tlrc -model 1 2 : 0 3 4 5 6 7 8 9 10 11 12 13 14 15 16 17 18 19 20 21 22 23 24 25 26 27 28 29 30 31 32 33 34 35 36 37 38 39 40 41 42 -bucket 0 Grp. Eff -18 -
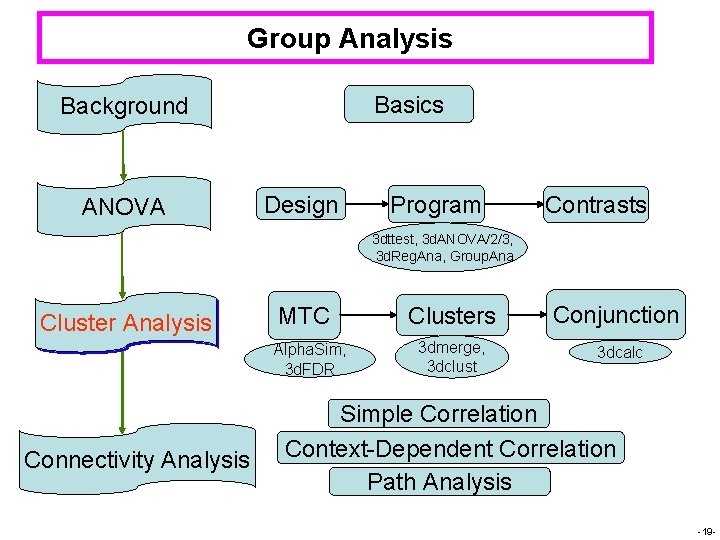
Group Analysis Basics Background ANOVA Design Program Contrasts 3 dttest, 3 d. ANOVA/2/3, 3 d. Reg. Ana, Group. Ana Cluster Analysis MTC Alpha. Sim, 3 d. FDR Connectivity Analysis Clusters Conjunction 3 dmerge, 3 dclust 3 dcalc Simple Correlation Context-Dependent Correlation Path Analysis -19 -
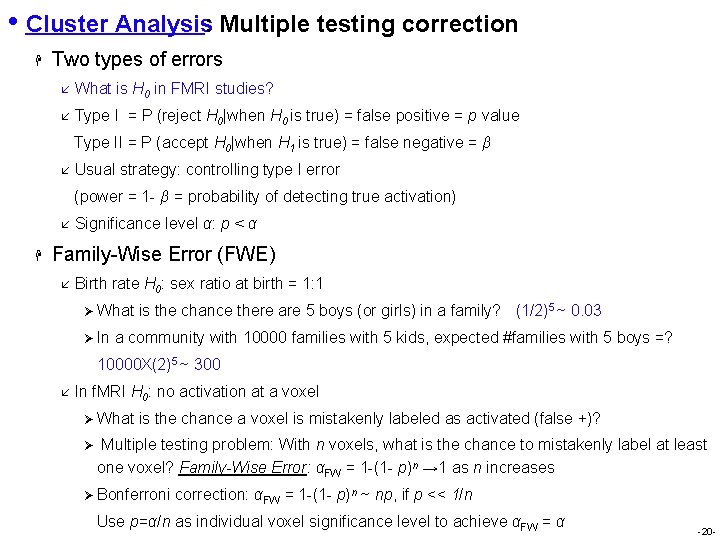
• Cluster Analysis: Multiple testing correction H Two types of errors å What is H 0 in FMRI studies? å Type I = P (reject H 0|when H 0 is true) = false positive = p value Type II = P (accept H 0|when H 1 is true) = false negative = β å Usual strategy: controlling type I error (power = 1 - β = probability of detecting true activation) å H Significance level α: p < α Family-Wise Error (FWE) å Birth rate H 0: sex ratio at birth = 1: 1 Ø What is the chance there are 5 boys (or girls) in a family? (1/2)5 ~ 0. 03 Ø In a community with 10000 families with 5 kids, expected #families with 5 boys =? 10000 X(2)5 ~ 300 å In f. MRI H 0: no activation at a voxel Ø What is the chance a voxel is mistakenly labeled as activated (false +)? Ø Multiple testing problem: With n voxels, what is the chance to mistakenly label at least one voxel? Family-Wise Error: αFW = 1 -(1 - p)n → 1 as n increases Ø Bonferroni correction: αFW = 1 -(1 - p)n ~ np, if p << 1/n Use p=α/n as individual voxel significance level to achieve αFW = α -20 -
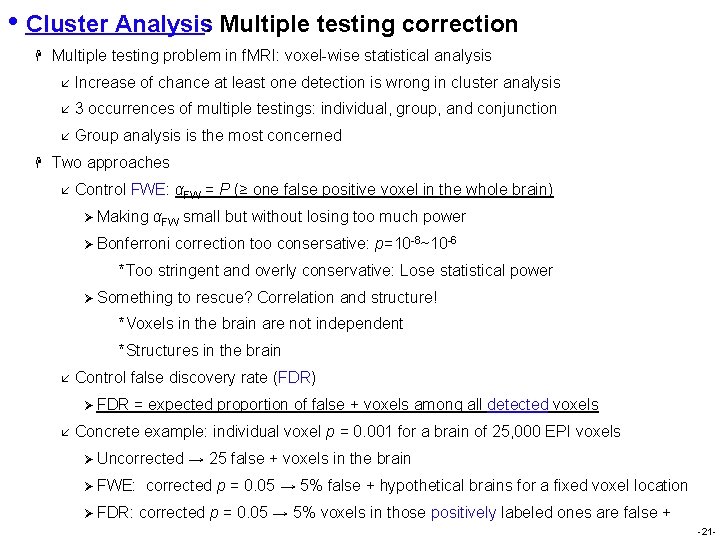
• Cluster Analysis: Multiple testing correction H H Multiple testing problem in f. MRI: voxel-wise statistical analysis å Increase of chance at least one detection is wrong in cluster analysis å 3 occurrences of multiple testings: individual, group, and conjunction å Group analysis is the most concerned Two approaches å Control FWE: αFW = P (≥ one false positive voxel in the whole brain) Ø Making αFW small but without losing too much power Ø Bonferroni correction too consersative: p=10 -8~10 -6 *Too stringent and overly conservative: Lose statistical power Ø Something to rescue? Correlation and structure! *Voxels in the brain are not independent *Structures in the brain å Control false discovery rate (FDR) Ø FDR = expected proportion of false + voxels among all detected voxels å Concrete example: individual voxel p = 0. 001 for a brain of 25, 000 EPI voxels Ø Uncorrected → 25 false + voxels in the brain Ø FWE: corrected p = 0. 05 → 5% false + hypothetical brains for a fixed voxel location Ø FDR: corrected p = 0. 05 → 5% voxels in those positively labeled ones are false + -21 -
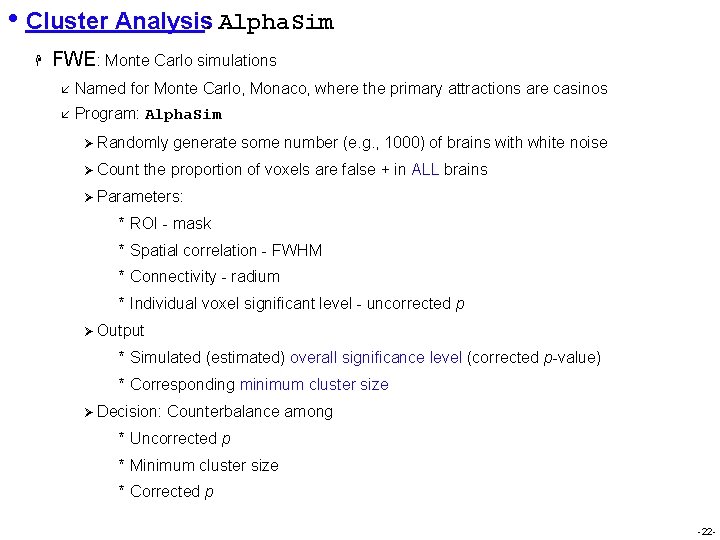
• Cluster Analysis: Alpha. Sim H FWE: Monte Carlo simulations å Named for Monte Carlo, Monaco, where the primary attractions are casinos å Program: Alpha. Sim Ø Randomly generate some number (e. g. , 1000) of brains with white noise Ø Count the proportion of voxels are false + in ALL brains Ø Parameters: * ROI - mask * Spatial correlation - FWHM * Connectivity - radium * Individual voxel significant level - uncorrected p Ø Output * Simulated (estimated) overall significance level (corrected p-value) * Corresponding minimum cluster size Ø Decision: Counterbalance among * Uncorrected p * Minimum cluster size * Corrected p -22 -
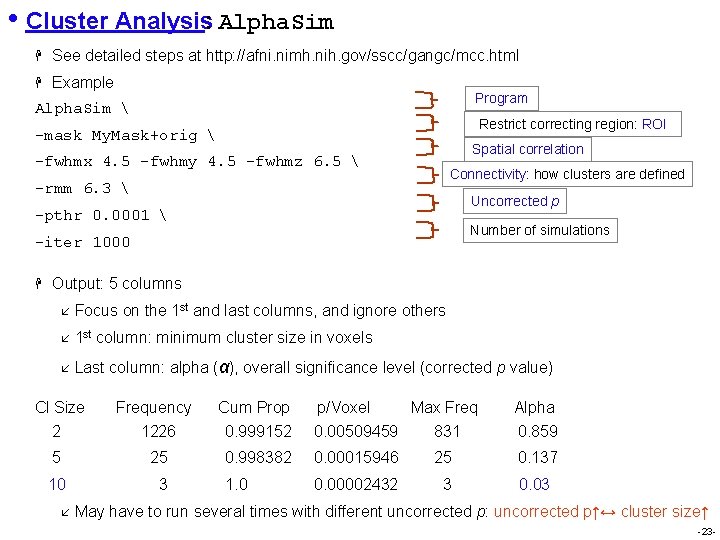
• Cluster Analysis: Alpha. Sim H See detailed steps at http: //afni. nimh. nih. gov/sscc/gangc/mcc. html H Example Alpha. Sim -mask My. Mask+orig -fwhmx 4. 5 -fwhmy 4. 5 -fwhmz 6. 5 -rmm 6. 3 -pthr 0. 0001 -iter 1000 H Program Restrict correcting region: ROI Spatial correlation Connectivity: how clusters are defined Uncorrected p Number of simulations Output: 5 columns å Focus on the 1 st and last columns, and ignore others å 1 st column: minimum cluster size in voxels å Last column: alpha (α), overall significance level (corrected p value) Cl Size Frequency Cum Prop p/Voxel Max Freq Alpha 2 1226 0. 999152 0. 00509459 831 0. 859 5 25 0. 998382 0. 00015946 25 0. 137 10 3 1. 0 0. 00002432 3 0. 03 å May have to run several times with different uncorrected p: uncorrected p↑↔ cluster size↑ -23 -
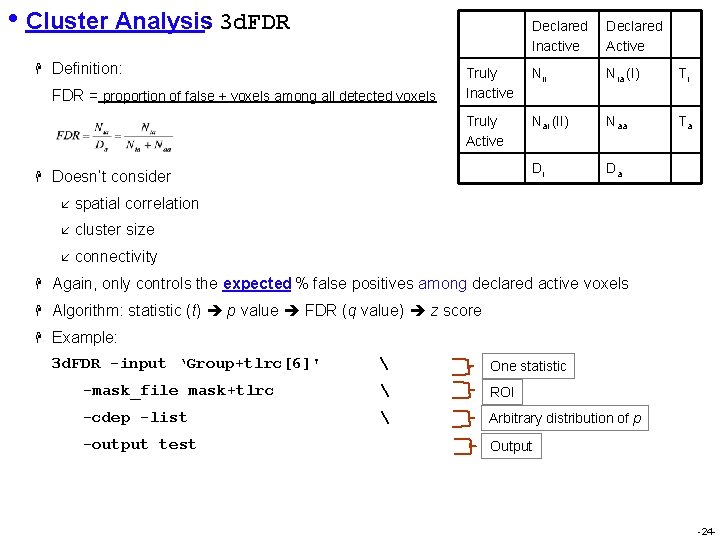
• Cluster Analysis: 3 d. FDR H Definition: FDR = proportion of false + voxels among all detected voxels H Declared Inactive Declared Active Truly Inactive Nii Nia (I) Ti Truly Active Nai (II) Naa Ta Di Da Doesn’t consider å spatial correlation å cluster size å connectivity H Again, only controls the expected % false positives among declared active voxels H Algorithm: statistic (t) p value FDR (q value) z score H Example: 3 d. FDR -input ‘Group+tlrc[6]' One statistic -mask_file mask+tlrc ROI -cdep -list Arbitrary distribution of p -output test Output -24 -
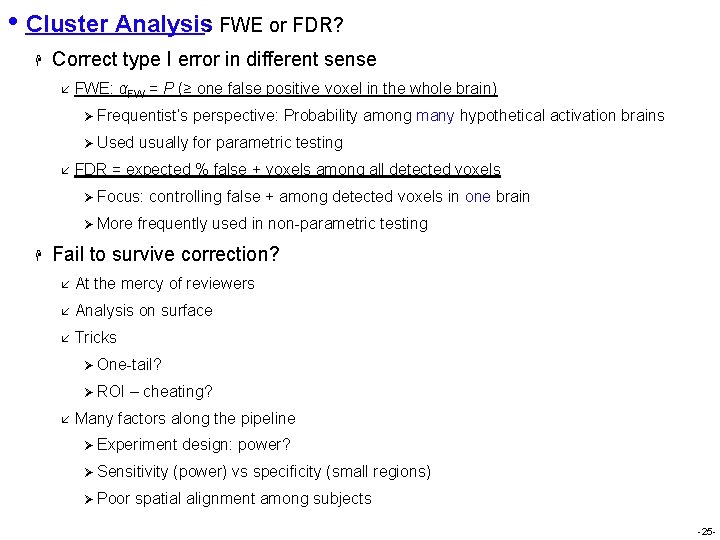
• Cluster Analysis: FWE or FDR? H Correct type I error in different sense å FWE: αFW = P (≥ one false positive voxel in the whole brain) Ø Frequentist’s perspective: Probability among many hypothetical activation brains Ø Used usually for parametric testing å FDR = expected % false + voxels among all detected voxels Ø Focus: controlling false + among detected voxels in one brain Ø More frequently used in non-parametric testing H Fail to survive correction? å At the mercy of reviewers å Analysis on surface å Tricks Ø One-tail? Ø ROI – cheating? å Many factors along the pipeline Ø Experiment design: power? Ø Sensitivity (power) vs specificity (small regions) Ø Poor spatial alignment among subjects -25 -
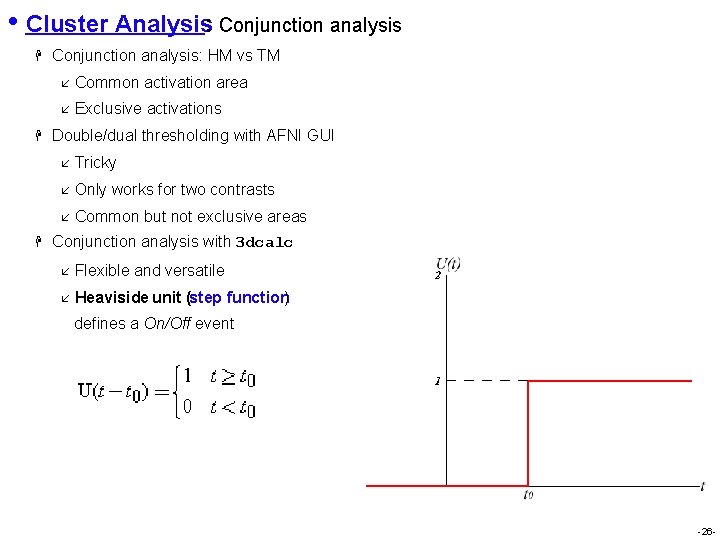
• Cluster Analysis: Conjunction analysis H H H Conjunction analysis: HM vs TM å Common activation area å Exclusive activations Double/dual thresholding with AFNI GUI å Tricky å Only works for two contrasts å Common but not exclusive areas Conjunction analysis with 3 dcalc å Flexible and versatile å Heaviside unit (step function) defines a On/Off event -26 -
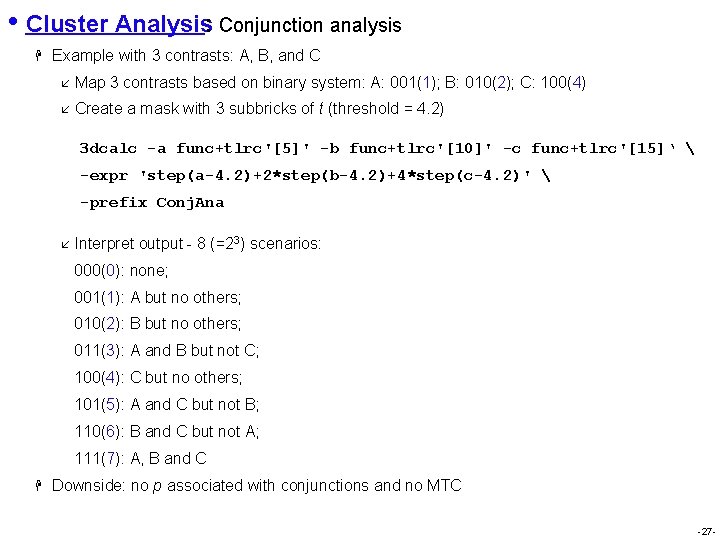
• Cluster Analysis: Conjunction analysis H Example with 3 contrasts: A, B, and C å Map 3 contrasts based on binary system: A: 001(1); B: 010(2); C: 100(4) å Create a mask with 3 subbricks of t (threshold = 4. 2) 3 dcalc -a func+tlrc'[5]' -b func+tlrc'[10]' -c func+tlrc'[15]‘ -expr 'step(a-4. 2)+2*step(b-4. 2)+4*step(c-4. 2)' -prefix Conj. Ana å Interpret output - 8 (=23) scenarios: 000(0): none; 001(1): A but no others; 010(2): B but no others; 011(3): A and B but not C; 100(4): C but no others; 101(5): A and C but not B; 110(6): B and C but not A; 111(7): A, B and C H Downside: no p associated with conjunctions and no MTC -27 -
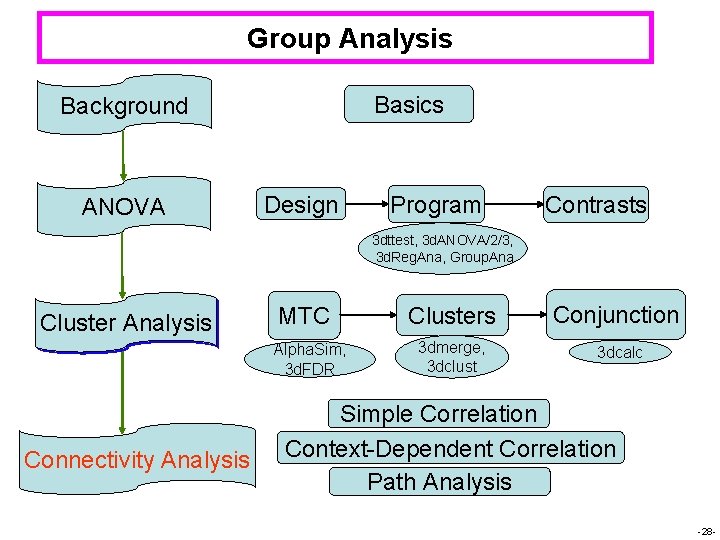
Group Analysis Basics Background ANOVA Design Program Contrasts 3 dttest, 3 d. ANOVA/2/3, 3 d. Reg. Ana, Group. Ana Cluster Analysis MTC Alpha. Sim, 3 d. FDR Connectivity Analysis Clusters Conjunction 3 dmerge, 3 dclust 3 dcalc Simple Correlation Context-Dependent Correlation Path Analysis -28 -
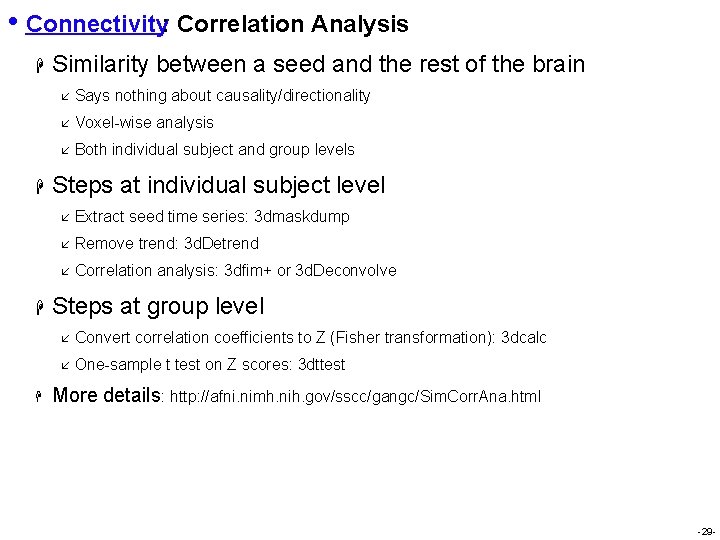
• Connectivity: Correlation Analysis H H Similarity between a seed and the rest of the brain å Says nothing about causality/directionality å Voxel-wise analysis å Both individual subject and group levels Steps at individual subject level å Extract seed time series: 3 dmaskdump å Remove trend: 3 d. Detrend å Correlation analysis: 3 dfim+ or 3 d. Deconvolve Steps at group level å Convert correlation coefficients to Z (Fisher transformation): 3 dcalc å One-sample t test on Z scores: 3 dttest More details: http: //afni. nimh. nih. gov/sscc/gangc/Sim. Corr. Ana. html -29 -
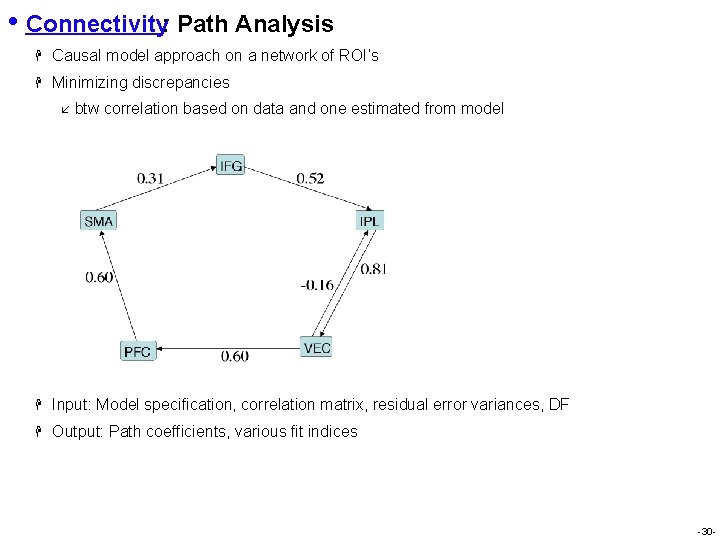
• Connectivity: Path Analysis H Causal model approach on a network of ROI’s H Minimizing discrepancies å btw correlation based on data and one estimated from model H Input: Model specification, correlation matrix, residual error variances, DF H Output: Path coefficients, various fit indices -30 -
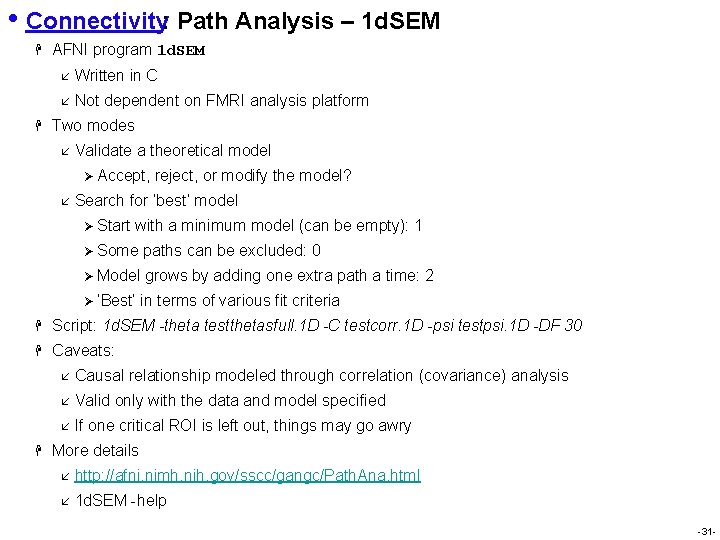
• Connectivity: Path Analysis – 1 d. SEM H H AFNI program 1 d. SEM å Written in C å Not dependent on FMRI analysis platform Two modes å Validate a theoretical model Ø Accept, reject, or modify the model? å Search for ‘best’ model Ø Start with a minimum model (can be empty): 1 Ø Some paths can be excluded: 0 Ø Model grows by adding one extra path a time: 2 Ø ‘Best’ in terms of various fit criteria H Script: 1 d. SEM -theta testthetasfull. 1 D -C testcorr. 1 D -psi testpsi. 1 D -DF 30 H Caveats: H å Causal relationship modeled through correlation (covariance) analysis å Valid only with the data and model specified å If one critical ROI is left out, things may go awry More details å http: //afni. nimh. nih. gov/sscc/gangc/Path. Ana. html å 1 d. SEM -help -31 -
• Need Help? ☼Command with “-help” Ø 3 d. ANOVA 3 -help ☼Manuals Ø http: //afni. nimh. nih. gov/afni/doc/manual/ ☼Web Ø http: //afni. nimh. nih. gov/sscc/gangc ☼Examples: How. To#5 Ø http: //afni. nimh. nih. gov/afni/doc/howto/ ☼Message board Ø http: //afni. nimh. nih. gov/afni/community/board/ ☼Appointment ØContact us @1 -800 -NIH-AFNI -32 -
- Slides: 32