CUSTOMER VALUES VALUE PROPOSITION Value Nomics MRI SCAN


 to 1 (worst)")


 to 1 (worst) are filled in. NO")


- Slides: 33
CUSTOMER VALUES VALUE PROPOSITION Value. Nomics MRI SCAN enhancing the competitiveness of a sector in global markets CEDIS – Centre for competitiveness www. cedis. nl
Value. Nomics In this presentation, we will explain 1. The basics of competitiveness 2. Stakeholder mapping for a sector 3. The theory behind the MRI scan, a competitiveness assessment 4. The process of execution of the MRI scan 5. The construction of the FSI matrix, the building block for a sector strategy and action plan
Value. Nomics • Valuenomics is a new concept on trade development and –promotion • It is designed for business support organizations and governmental institutions • Focus is on understanding and enhancing “competitiveness”
CUSTOMER VALUES VALUE PROPOSITION MRI SCAN • The MRI SCAN is Valuenomics’ powerful tool to measure a sector’s competitivenss on global markets • It is the building block for sector strategies • Its focus is on the value proposition, but this time on mesoeconomic level –the sector
1. Basics of competitiveness
COST VALUE Reference to competitivensss assumes As customers, we do not buy based on cost competitiveness only cost alone. We buy “value” COMPETITION CUSTOMERS Cost competitiveness forces us to Value is as perceived by the customer. focus on the competition This brings the focus on the customer
COMPARATIVE ADVANTAGES COMPETITIVE ADVANTAGES Competitiveness is based on the ability to create value for customers. Value is created through. . . TECHNOLOGY = Creating new, developing or adapting existing products PRODUCTION = Transformation of inputs into a final product LOGISTICS = All in-bound, in-house, out-bound movement of goods MARKETING = Attracting new and retaining existing customers SERVICE = All pre/after sales support, personalization of processes MINDS = People with a higher education and/or creativity MONEY = Financial resources or financing MAN POWER = Skilled, proficient or experienced workers METHODS = Business processes, like quality assurance MATERIALS = Raw materials, seeds, ingredients a/o
From a historical perspective, the importance of the competitive advantages has changed. . . TECHNOLOGY PRODUCTION LOGISTICS 1900 - 2000 1950 MARKETING SERVICE
2. Stakeholder mapping
CENTRAL BANK The first step BODIES, is. REGULATORY to. AGENCIES identify the LOCAL GOVERNMENTS stakeholders that have an impact on RECRUITMENT the competitiveness of the sector. . . SERVICES MINISTRY OF FINANCIAL SERVICES AGRICULTURE RESEARCH INST CERTIFICATION MINISTRY OF INDUSTRY REGIONAL BSO’s MINISTRY OF TRADE MINISTRY OF TOURISM DRIVERS SECTORAL BSO’s FUNCIONAL BSO’s/ NGO’s MINISTRY OF ECONOMICS MATERIALS SUPPLIERS TRADERS BUYERS WHOLESALE RETAILERS GROWERS ENABLERS MINISTRY OF FINANCE TECHNOLOGY SUPPLIERS ACTORS MANUFACTURERS PRODUCERS PACKERS MIDDLE MEN PROCESSORS ICT SERVICES MINISTRY OF PLANNING MANUFACTURERS PRODUCERS DISTRIBUTORS PACKERS ASSEMBLERS IMPORTERS EXPORTERS KNOWLEDGE INSTITUTES LOGISTICAL SERVICES INT. AGENCIES DONORS KNOWLEDGE INSTITUTES TRADE SUPPORT INSTITUTE PORTS CUSTOMS Each of these stakeholders have a role in the system that makes up for the value proposition of the sector
POST HARVEST The second step is the mapping i. e. establishing the relevance of each stakeholder from the private and public sector in the three value creating domains. MARKETING PRE HARVEST PUBLIC Following is an example of stakeholder mapping in the Tanzanian coffee sector……. PRIVATE
CU FG CBA TCB TPRI PA FG -Farmer Groups CU - Cooperatives, Unions CA - Cafe Africa TGCA MINAG MTIM MARKETING PRIVATE TACRI LOCAL GOVERNMENTS POST HARVEST PRE HARVEST PUBLIC CA TACOBA MNC TPRI - Tanzania Pest Research Institute TACRI - Tanzania Coffee Research Institute TCGA -Tanzania Coffee Growers Association (dormant) CBA - Cherry Buyer’s Association CA - Cafe Africa TCA - Tanzania Coffee Association TACOBA -Tanzania Coffee Buyers Association MINAG - Ministry of Agriculture TCB - Tanzania Coffee Board MTIM - Ministry of Trade, Industry and Marketing PA - Port Authorities
3. MRI scan – theory
On each crossroad we assess the competitiveness of the sector on 5 criteria Y ACTORS MINDS The MRI MONEY MAN POWER METHODS MATERIALS MINDS scan is a matrix. MONEY MAN POWER METHODS MATERIALS On the vertical axis, we list the stakeholders of the sector ……. MINDS MONEY MAN POWER METHODS MATERIALS ENABLERS REPORTS REPRESENTATION READINESS RANGE ROBUSTNESS DRIVERS INCENTIVES INFRASTRUCTURE INITIATIVE INSTITUTIONS INSTRUCTION INCENTIVES INFRASTRUCTURE On the horizontal axis, we list the INITIATIVE three main value adding domains…. . INSTITUTIONS INSTRUCTION DEVELOPMENT PRODUCTION REPORTS REPRESENTATION READINESS RANGE ROBUSTNESS MARKETING X
The MRI scan starts with the. . . Analysis of the ACTORS We assess ACTOR’s peformance in the M 5 analysis
Analysis of the ENABLERS We assess the performance of ENABLERS in the R 5 analysis
Analysis of the DRIVERS We assess the performance of DRIVERS in the I 5 analysis
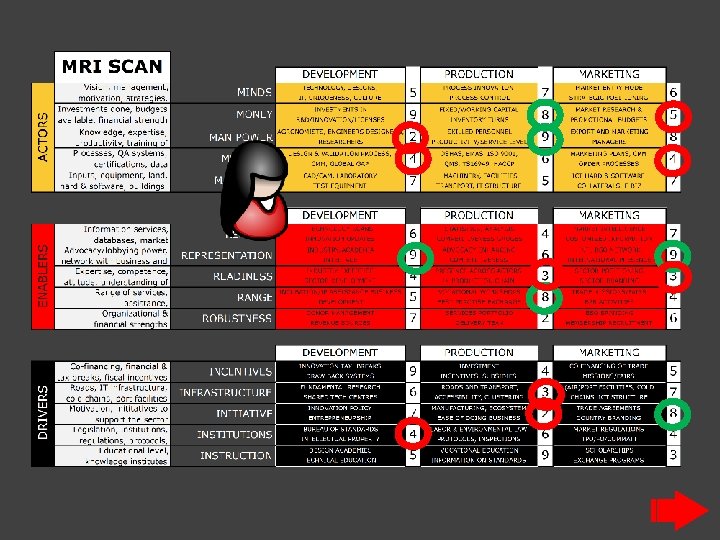
MRI SCAN
The scoring process consists of 1. Individual scores from 10 (best) to 1 (worst) 2. Averige scores for each criterion 3. Consolidated competitiveness score, calculated through the formula : C= x y z 3 2 where C = competitiveness of the sector x = average score of ACTORS y = average score of ENABLERS z = average score of DRIVERS
C= x y z = 38. 573 3 2
4. Process of the MRI scan
Execution of the MRI scan. . Invite representatives from companies - THE ACTORS . . . from BSO’s - THE ENABLERS . . . and government - THE DRIVERS for a self assessment. . .
All participants fill in the MRI – scorecard. . . . INDIVIDUALLY
In each column, scores from 10 (best) to 1 (worst) are filled in. NO REPETITIVE SCORES IN COLUMNS
Scores are then processed into one consolidated sheet. . . discussed and agreed upon
The competitiveness score of the sector is calculated through the following formula in which C = competitiveness x = average score of ACTORS y = average score of ENABLERS z = average score of DRIVERS C= x y z 3 2
But more important than the total score. . . are the scores on each of the elements . . . since they precisely indicate what the value proposition of the sector is (the high scores). . . and reveal the biggest challenges of the sector (the low scores)
5. Construct of FSI matrix
The FSI matrix is a practical tool, FEASIBILITY • required What are chances we can that successfully this atthe this stage that to ensure efforts do are not SPEED wasted "trying to do everything”. The low scores of the MRI • How quick can we do this ? scan are used to construct the solution design for the IMPACT • What is the impact on the export figures for the sector ? constraints, prioritized by three criteria: FOR EACH CRITERION, SCORES FROM 10 TO 1 ARE GIVEN SCORES ARE ADDED UP AND ACTIONS ARE SORTED
Example of an FSI matrix for the tourism sector in Rwanda
What are the advantages of this methodology versus the traditional value chain analysis ? • • • Consensus amongst all stakeholders Clear value proposition/branding “First things first” implementation Practical/action driven sector strategy Action holders : who does what ?
www. valuemagics. com