Effect of Flip Angle Error for T 1
- Slides: 15
Effect of Flip Angle Error for T 1 Bias Correction in MRI Fat Fraction Estimation March 22, 2011 Issac Yang Supervisor: Charles Mc. Kenzie, Ph. D Department of Medical Biophysics University of Western Ontario
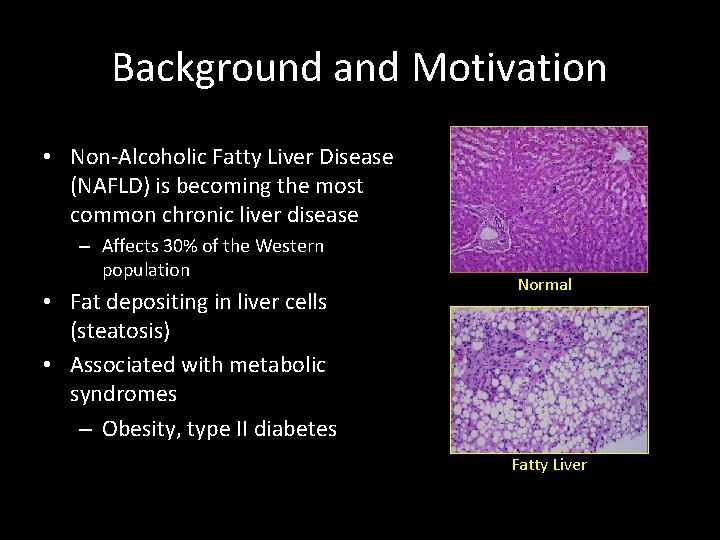
Background and Motivation • Non-Alcoholic Fatty Liver Disease (NAFLD) is becoming the most common chronic liver disease – Affects 30% of the Western population • Fat depositing in liver cells (steatosis) • Associated with metabolic syndromes – Obesity, type II diabetes Normal Fatty Liver
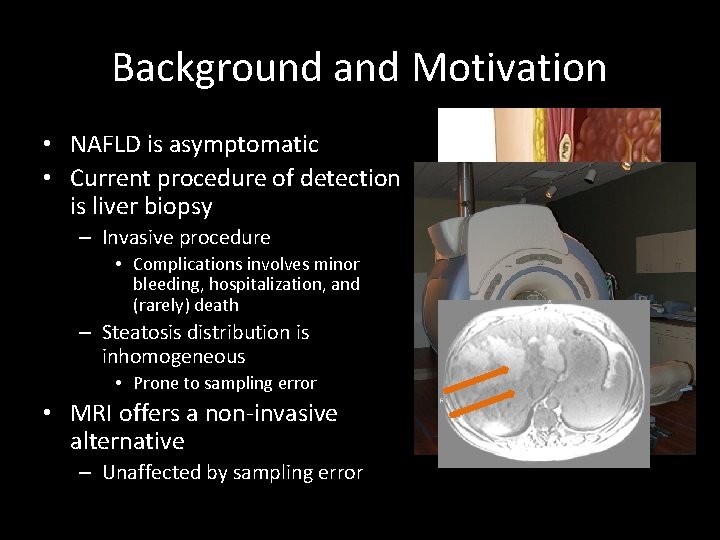
Background and Motivation • NAFLD is asymptomatic • Current procedure of detection is liver biopsy – Invasive procedure • Complications involves minor bleeding, hospitalization, and (rarely) death – Steatosis distribution is inhomogeneous • Prone to sampling error • MRI offers a non-invasive alternative – Unaffected by sampling error
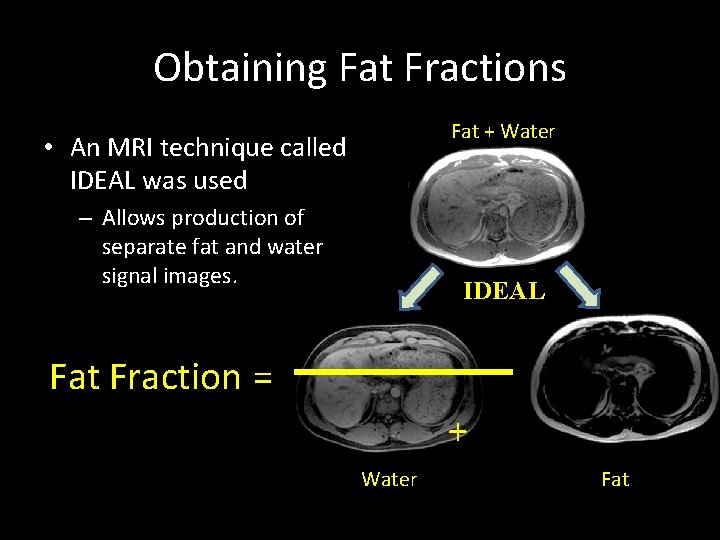
Obtaining Fat Fractions Fat + Water • An MRI technique called IDEAL was used – Allows production of separate fat and water signal images. IDEAL Fat Fraction = + Water Fat
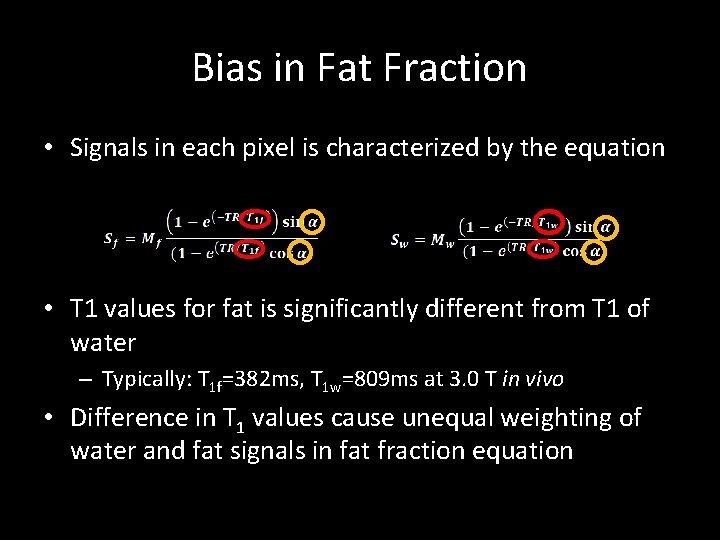
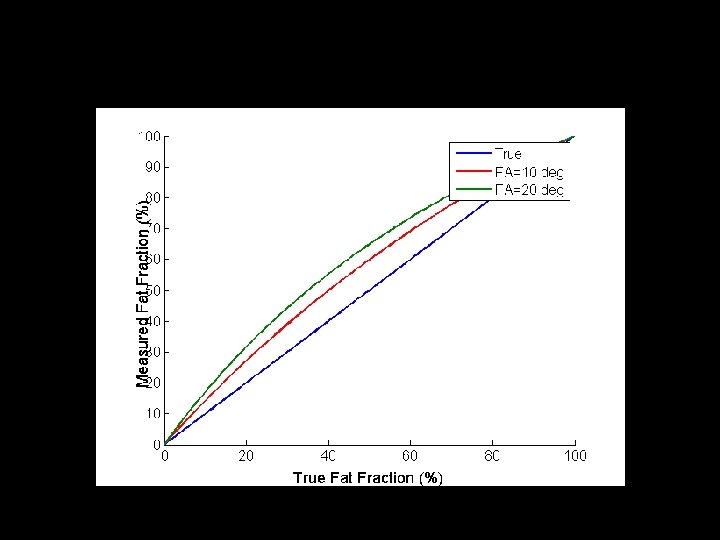
Bias in Fat Fraction • Signals in each pixel is characterized by the equation • T 1 values for fat is significantly different from T 1 of water – Typically: T 1 f=382 ms, T 1 w=809 ms at 3. 0 T in vivo • Difference in T 1 values cause unequal weighting of water and fat signals in fat fraction equation
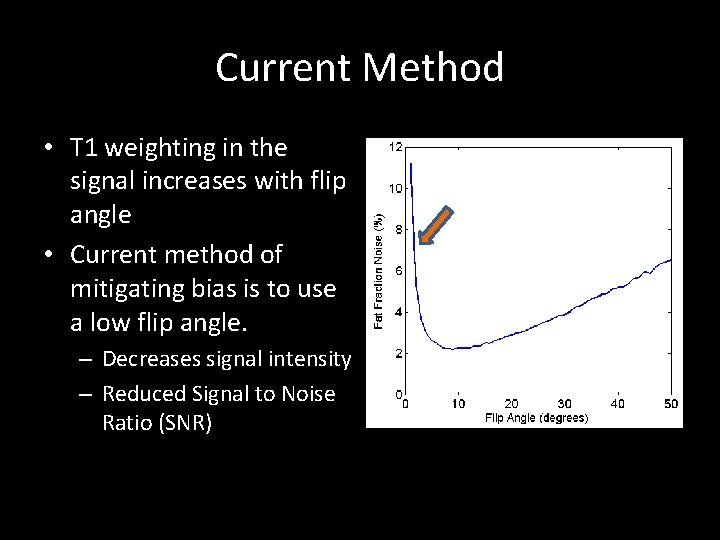
Current Method • T 1 weighting in the signal increases with flip angle • Current method of mitigating bias is to use a low flip angle. – Decreases signal intensity – Reduced Signal to Noise Ratio (SNR)
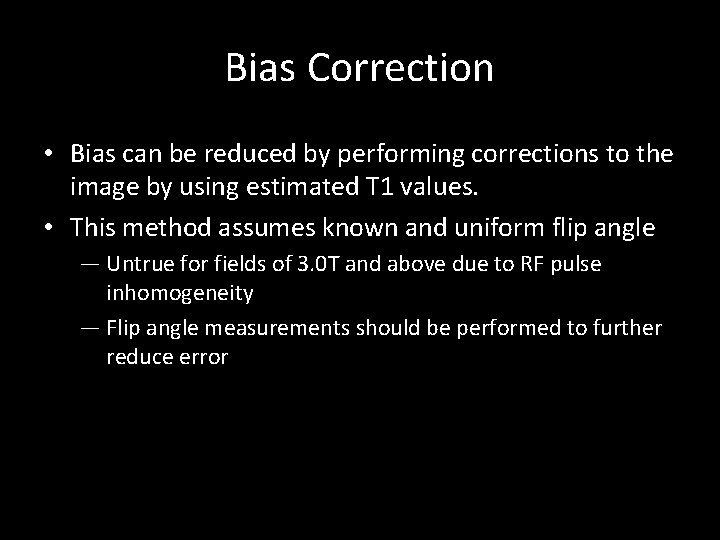
Bias Correction • Bias can be reduced by performing corrections to the image by using estimated T 1 values. • This method assumes known and uniform flip angle — Untrue for fields of 3. 0 T and above due to RF pulse inhomogeneity — Flip angle measurements should be performed to further reduce error
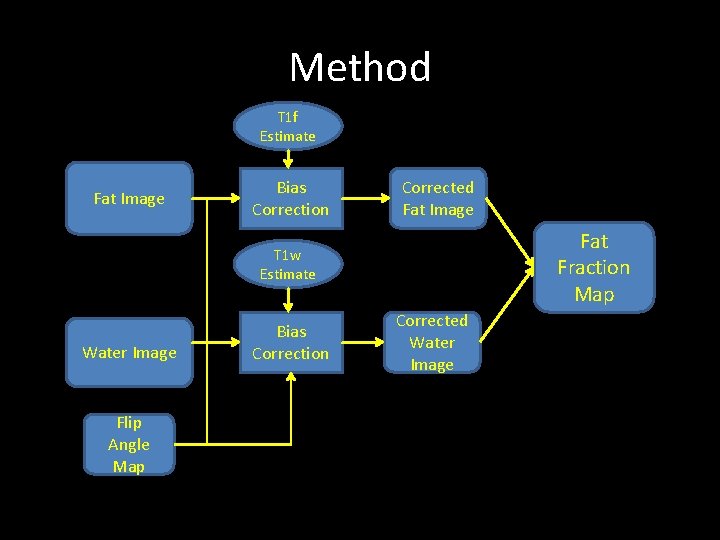
Method T 1 f Estimate Fat Image Bias Correction Corrected Fat Image Fat Fraction Map T 1 w Estimate Water Image Flip Angle Map Bias Correction Corrected Water Image
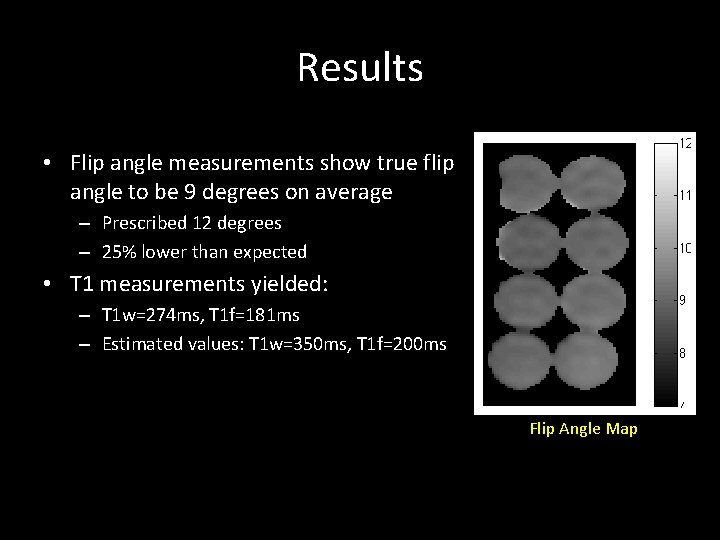
Results • Flip angle measurements show true flip angle to be 9 degrees on average – Prescribed 12 degrees – 25% lower than expected • T 1 measurements yielded: – T 1 w=274 ms, T 1 f=181 ms – Estimated values: T 1 w=350 ms, T 1 f=200 ms Flip Angle Map
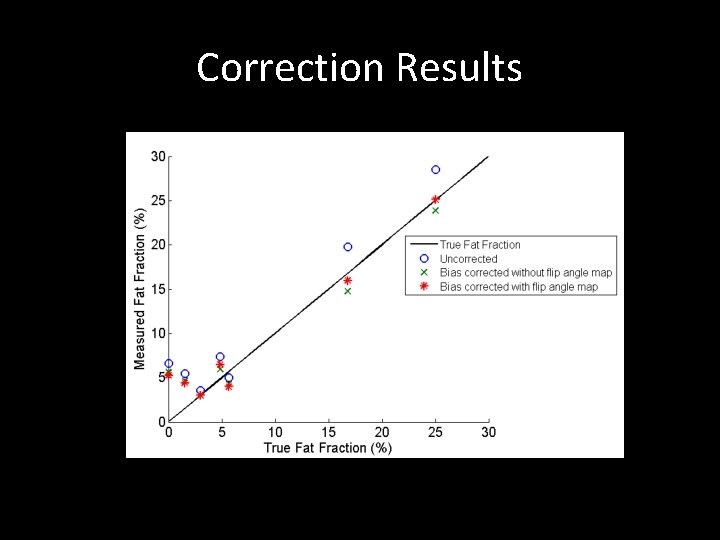
Correction Results
Discussion • Measured fat fractions was brought closer to the true fat fraction value for phantoms
Conclusion • Experiments suggest that including flip angle mapping into imaging protocol would decrease fat fraction bias
Acknowledgement Mc. Kenzie Lab Dr. Charles Mc. Kenzie Dr. Trevor Wade Dr. Lanette Friesen-Waldner Bartha Lab Dr. Robert Bartha Dr. John Drozd Jacob Penner Curtis Wiens Bryan Addeman Yifan Cui Samantha Flood
Thank You For Your Attention Questions?