Ultrasonic Testing Shokoh manesh asghar Hammori amin supervisor


 REFRACTION The sound is refracted due to differences in")


 90 Shear wave refracted")


 display The Horizontal axis")


")


 Block")


- Slides: 125
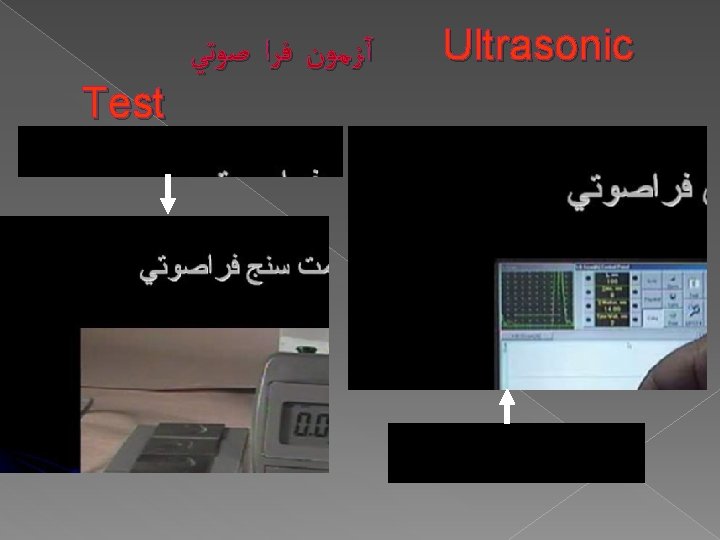
ﺩﺍﻧﺸگﺎﻩ آﺰﺍﺩﻭﺍﺣﺪﺍﻫﻮﺍﺯ ﺩﺍﻧﺸکﺪﻩ ﻓﻨی ﻭﻣﻬﻨﺪﺳی Ultrasonic Testing Shokoh manesh asghar & Hammori amin supervisor: Dr Moeinifar
Introduction to Nondestructive Testing
• • • Six Most Common NDT Methods Visual Liquid Penetrant Magnetic Ultrasonic Eddy Current X-ray
Sound Wavelength : The distance required to complete a cycle › Measured in Meter or mm Frequency : The number of cycles per unit time › Measured in Hertz (Hz) or Cycles per second (cps) Velocity : How quick the sound travels Distance per unit time › Measured in meter / second (m / sec)
Wavelength Velocity Frequency
Sound Waves Sound waves are the vibration of particles in solids liquids or gases Particles vibrate about a mean position In order to vibrate they require mass and resistance to change One cycle
Properties of a sound wave Sound cannot travel in vacuum Sound energy to be transmitted / transferred from one particle to another SOLID LIQUID GAS
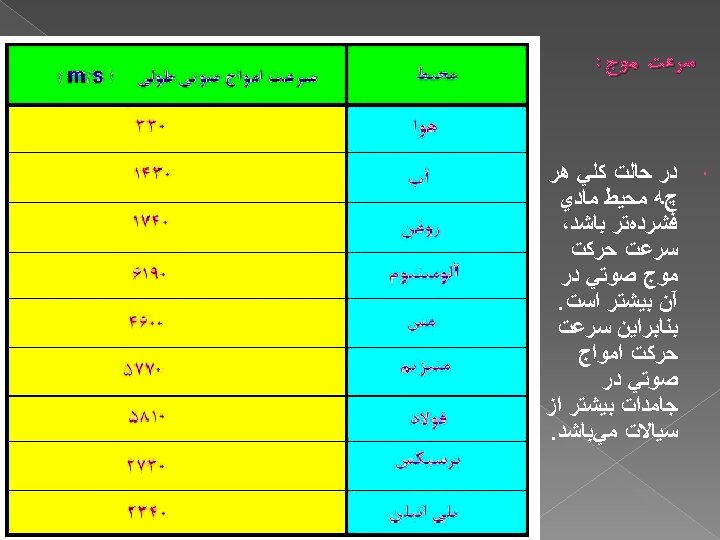
Velocity The velocity of sound in a particular material is CONSTANT It is the product of DENSITY and ELASTICITY of the material � It will NOT change if frequency changes � Only the wavelength changes � Examples: V Compression in steel : 5960 m/s V Compression in water : 1470 m/s V Compression in air : 330 m/s � � 5 M Hz STEEL WATER AIR
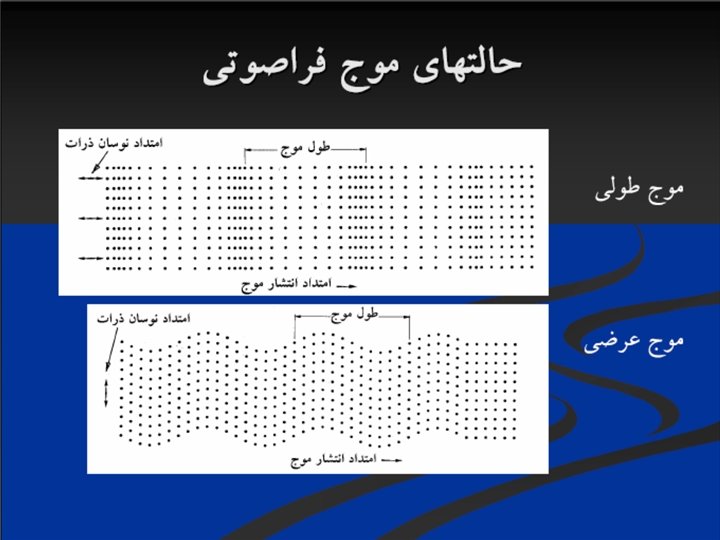
Sound Waveforms Sound travels in different waveforms in different conditions • Compression wave • Shear wave • Surface wave • Lamb wave
Compression / Longitudinal Vibration and propagation in the same direction / parallel Travel in solids, liquids and gases Particle vibration Propagation
Shear / Transverse � Vibration at right angles / perpendicular to direction of propagation � Travel in solids only � Velocity 1/2 compression (same material) Particle vibration Propagation
Compression v Shear Frequency 0. 5 MHz 1 MHz 2 MHz 4 MHz 6 MHZ Compression 11. 8 5. 9 2. 95 1. 48 0. 98 Shear • 6. 5 • 3. 2 • 1. 6 • 0. 8 • 0. 54 The smaller the wavelength the better the sensitivity
Sound travelling through a material � Velocity varies according to the material Compression waves Shear waves • Steel 5960 m/sec • Steel 3245 m/sec • Water 1470 m/sec • Water NA • Air 344 m/sec • Air NA • Copper 4700 m/sec • Copper 2330 m/sec
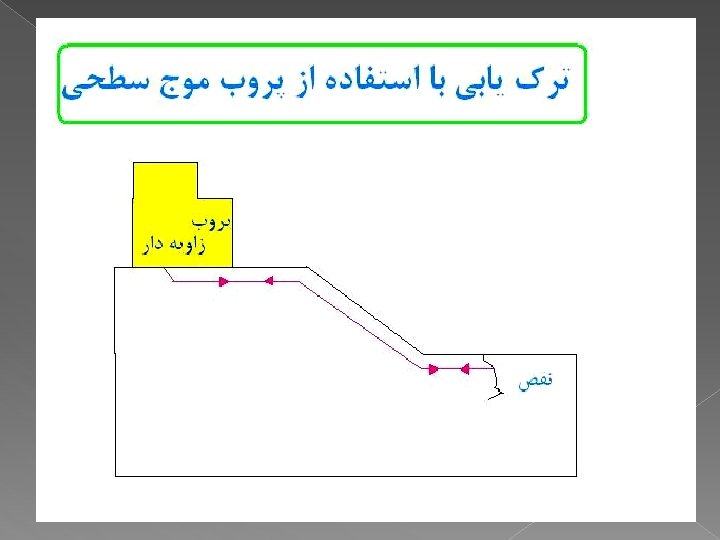
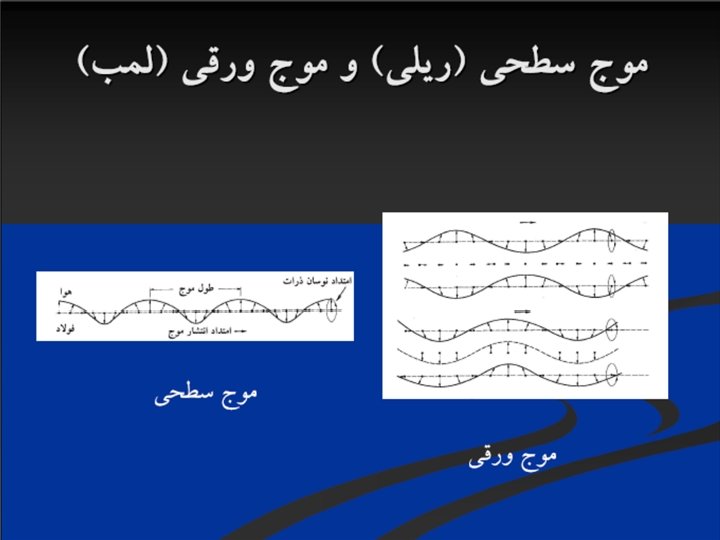
Surface Wave Elliptical vibration Velocity 8% less than shear Penetrate one wavelength deep Easily dampened by heavy grease or wet finger Follows curves but reflected by sharp corners or surface cracks
Lamb / Plate Wave Produced by the manipulation of surface waves and others Used mainly to test very thin materials / plates Velocity varies with plate thickness and frequencies SYMETRIC ASSYMETRIC
Ultrasonic Sound : mechanical vibration What is Ultrasonic? Very High Frequency sound – above 20 KHz 20, 000 cps
Acoustic Spectrum Sonic / Audible Human 16 Hz - 20 k. Hz 0 10 100 1 K Ultrasonic > 20 k. Hz = 20, 000 Hz 10 K 100 K 1 M 100 m Ultrasonic Testing 0. 5 MHz - 50 MHz Ultrasonic : Sound with frequency above 20 KHz
Frequency 1 second 1 cycle per 1 second = 1 Hertz : Number of cycles per second 1 second 3 cycle per 1 second = 3 Hertz 1 second 18 cycle per 1 second = 18 Hertz THE HIGHER THE FREQUENCY THE SMALLER THE WAVELENGTH
Pg 21 Frequency 1 Hz = 1 cycle per second 1 Kilohertz = 1 KHz = 1000 Hz 1 Megahertz = 1 MHz = 1000 000 Hz 20 KHz = 20 000 Hz 5 M Hz = 5 000 Hz
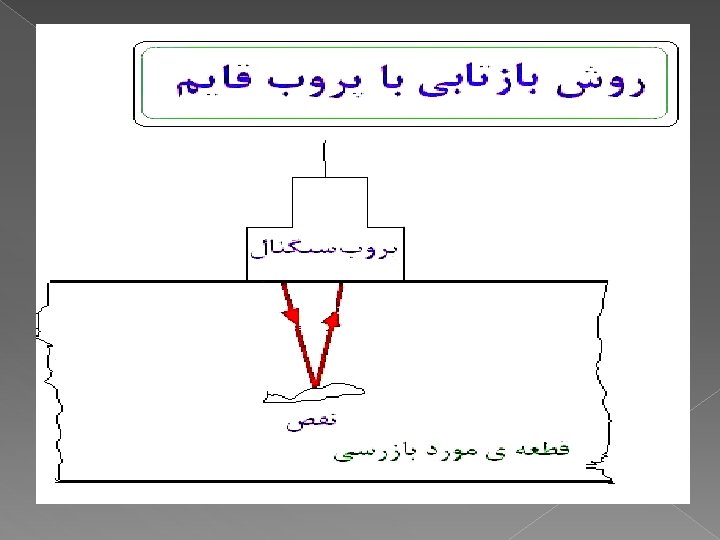
Ultrasonic Inspection defect echo initial pulse Back wall echo Material Thk defect 0 Compression Probe 10 20 30 40 CRT Display 50
Basic Principles of Ultrasonic Testing The distance the sound traveled can be displayed on the Flaw Detector The screen can be calibrated to give accurate readings of the distance Signal from the backwall Bottom / Backwall
Basic Principles of Ultrasonic Testing The presence of a Defect in the material shows up on the screen of the flaw detector with a less distance than the bottom of the material The BWE signal Defect
0 10 20 30 40 50 60 60 mm The depth of the defect can be read with reference to the marker on the screen
Thickness / depth measurement The closer the reflector to the surface, the signal will be more to the left of the screen B C 30 A 46 68 The thickness is read from the screen C B A The THINNER the material the less distance the sound travel
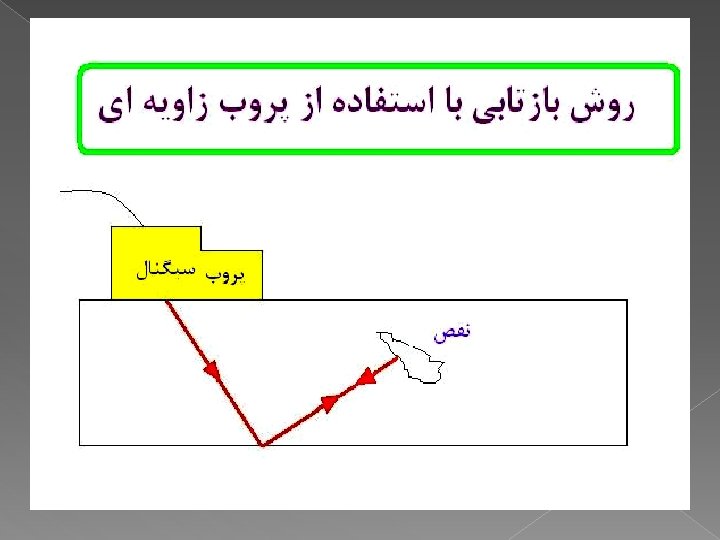
Ultrasonic Inspection initial pulse defect echo Surface distance defect sound path 0 Angle Probe 10 20 30 40 CRT Display 50
The Sound Beam Dead Zone Near Zone or Fresnel Zone Far Zone or Fraunhofer Zone
The Sound Beam NZ FZ Main Beam Intensity varies Exponential Decay Distance
The side lobes has multi minute main beams Two identical defects may give different amplitudes of signals Near Zone Side Lobes The main beam or the centre beam has the highest intensity of sound energy Main Lobe Main Beam Any reflector hit by the main beam will reflect the high amount of energy
Sound Beam Near Zone � Thickness measurement � Detection of defects � Sizing of large defects only Far Zone Thickness measurement Defect detection Sizing of all defects Near zone length as small as possible balanced against acceptable minimum detectable defect size
Near Zone
Near Zone What is the near zone length of a 5 MHz compression probe with a crystal diameter of 10 mm in steel?
Near Zone The bigger the diameter the bigger the near zone The higher the frequency the bigger the near zone The lower the velocity the bigger the near zone
Which of the above probes has the longest Near Zone ? 1 M Hz 5 M Hz
Beam Spread � In the far zone sound pulses spread out as they move away from the crystal /2
Beam Spread Edge, K=1. 22 20 d. B, K=1. 08 6 d. B, K=0. 56 Beam axis or Main Beam
Beam Spread � What is the beam spread of a 10 mm, 5 MHz compression wave probe in steel?
Which of the above probes has the Largest Beam Spread ? 1 M Hz 5 M Hz
Beam Spread The bigger the diameter the smaller the beam spread The higher the frequency the smaller the beam spread Which has the larger beam spread, a compression or a shear wave probe?
Ultrasonic Pulse A short pulse of electricity is applied to a piezo-electric crystal � The crystal begins to vibration increases to maximum amplitude and then decays � Maximum 10% of Maximum Pulse length
Pulse Length
Pulse Length The longer the pulse, the more penetrating the sound The shorter the pulse the better the sensitivity and resolution Short pulse, 1 or 2 cycles Long pulse 12 cycles
Pulse Length
Ideal Pulse Length 5 cycles for weld testing
Resolution RESOLUTION in Pulse Echo Testing is the ability to separate echoes from two or more closely spaced reflectors. RESOLUTION is strongly affected by Pulse Length: Short Pulse Length - GOOD RESOLUTION Long Pulse Length - POOR RESOLUTION is an extremely important property in WELD TESTING because the ability to separate ROOT GEOMETRY echoes from ROOT CRACK or LACK OF ROOT FUSION echoes largely determines the effectiveness of Pulse Echo UT in the testing of single sided welds.
Resolution Good resolution
Resolution Poor resolution
Scatter The bigger the grain size the worse the problem The higher the frequency of the probe the worse the problem 1 MHz 5 MHz
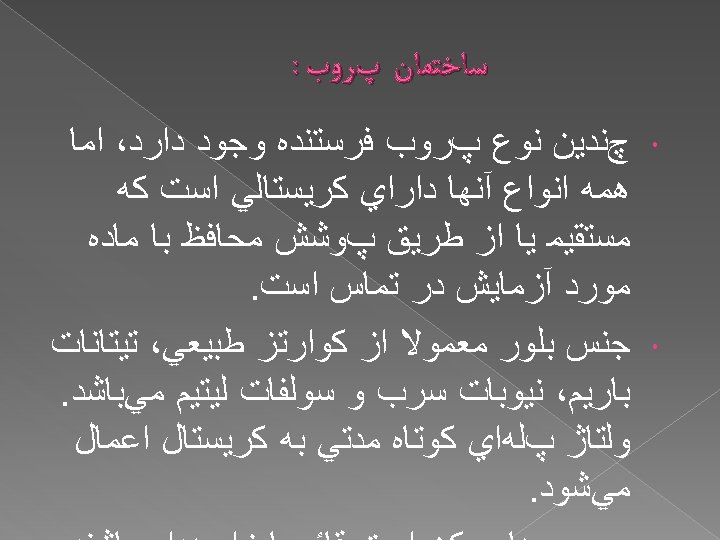
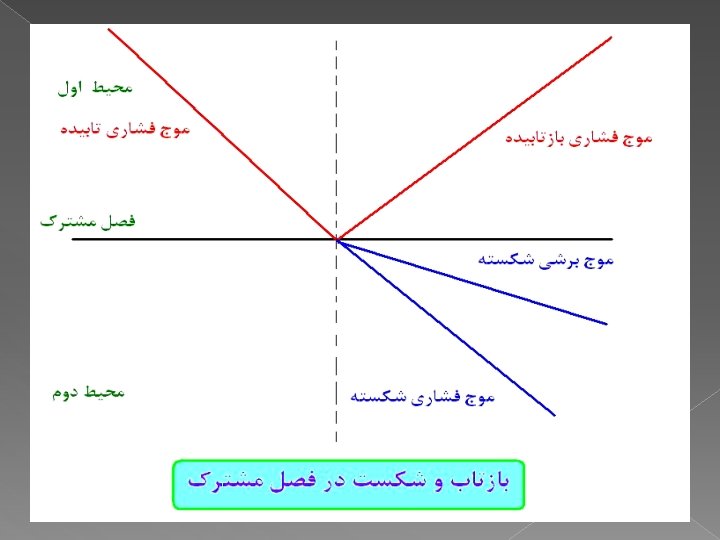
Inclined incidence(not at 0 o) REFRACTION The sound is refracted due to differences in sound velocity in the 2 materials
Snell’s Law C 20 Perspex Steel 48. 3 C
Snell’s Law C 15 Perspex Steel 34. 4 C
Snell’s Law C 20 Perspex Steel 48. 3 24 C S
1 st Critical Angle C 27. 4 Compression wave refracted at 90 degrees C 33 S
2 nd Critical Angle C C 57 S (Surface Wave) 90 Shear wave refracted at 90 degrees Shear wave becomes a surface wave
1 st Critical Angle Calculation C 27. 2 Perspex C Steel S
2 nd Critical Angle Calculation C C 57. 4 Perspex Steel S
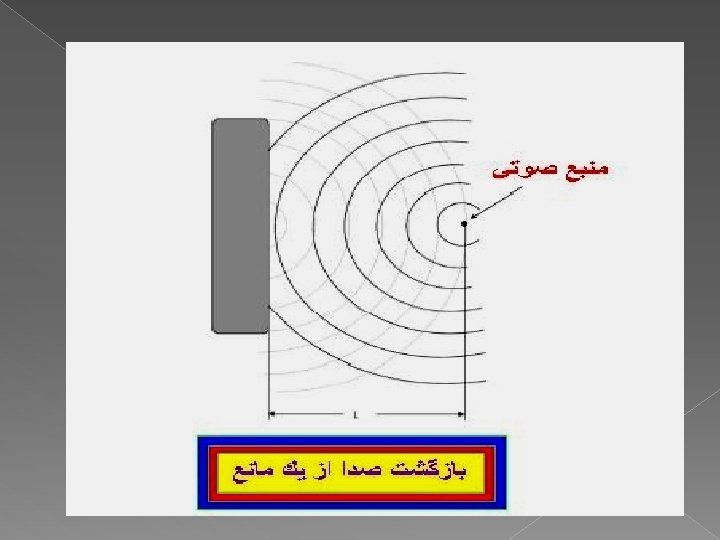
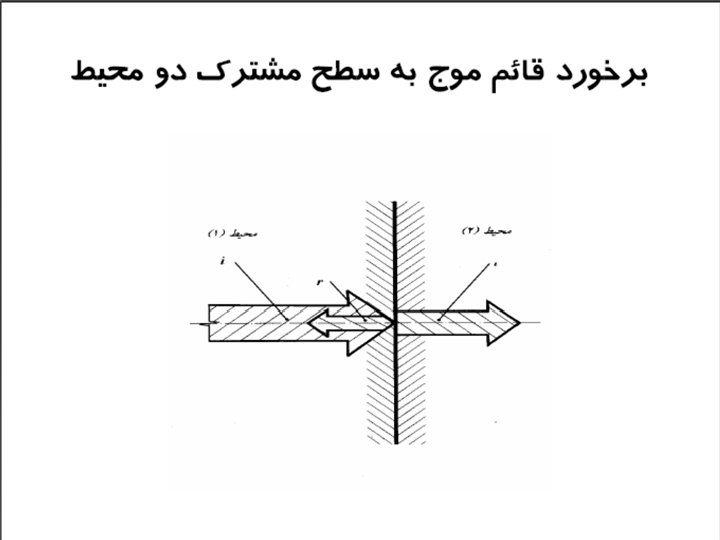
Sound at an Interface Sound will be either transmitted across or reflected back Reflected Interface Transmitted How much is reflected and transmitted depends upon the relative acoustic impedance of the 2 materials
Acoustic Impedance Definition The Resistance to the passage of sound within a material • Measured in kg / m 2 x sec Formula = Density , V = Velocity • • Steel Water Air Perspex 46. 7 x 10⁶ 1. 48 x 106 0. 0041 x 106 3. 2 x 10⁶
% Sound Reflected at an Interface % Sound Reflected + % Sound Transmitted = 100% Therefore % Sound Transmitted = 100% - % Sound Reflected
How much sound is reflected at a steel to water interface? • Z 1 (Steel) = 46. 7 x 10⁶ • Z 2 (Water) =1. 48 x 106 0. 93856 ´ 100 = 88. 09% reflected 2
How much sound transmitted? 100 % - the reflected sound Example : Steel to water 100 % - 88 % ( REFLECTED) = 12 % TRANSMITTED The BIGGER the Acoustic Impedance Ratio or Difference between the two materials: More sound REFLECTED than transmitted.
Air Steel Large Acoustic Impedance Ratio Air Large Acoustic Impedance Ratio Aluminum Steel No Acoustic Impedance Difference Small Acoustic Impedance Difference
Interface Behaviour Similarly: At an Steel - Air interface 99. 96% of the incident sound is reflected At a Steel - Perspex interface 75. 99% of the incident sound is reflected
2 signals at 20% and 40% FSH. What is the difference between them in d. B’s?
2 signals at 10% and 100% FSH. What is the difference between them in d. B’s?
Amplitude ratios in decibels 2: 1 4: 1 5: 1 100 : 1 = = = 6 b. B 12 d. B 14 d. B 20 d. B 40 d. B
SIZING METHODS 0 O PROBE There are four main sizing techniques used with 0 o probes: • 6 d. B drop • Maximum Amplitude • Equalisation • DGS
6 d. B Drop For sizing large planar reflectors only Signal / echo reduced to half the height Example: › › 100% to 50% 80% to 40% 70% to 35% 20% to 10% › Centre of probe marked representing the edge of defect.
6 d. B Drop Defect BWE The back wall echo reduced as some part of the beam now striking the defect Plan View The echo of the defect has NOT yet maximise as the whole beam Not yet striking the defect
6 d. B Drop Defect Now the whole beam is on the defect Back wall echo is now may be reduced or disappeared Plan View
6 d. B Drop Defect BWE The probe is moved back until the echo is reduced by half of it’s original height At this point the probe centre beam is directly on the edge of the defect Plan View The probe is then removed and the centre is marked, and repeat to size the whole defect
Maximum Amplitude Technique For sizing multifaceted defect – eg. crack Not very accurate Small probe movement
Maximum Amplitude Multifaceted defect : crack The whole probe beam is on the defect At this point, multipoint of the defect reflect the sound to the probe The echo (signal) show as a few peaks
Maximum Amplitude Multifaceted defect : crack The probe is moved out of the defect, the signal disappeared If the edge of the beam strike the edge of the defect, a very small echo appears If the probe is moved into the defect, the signals height increase One of the peak maximised At this point the MAIN BEAM is directly at the edge of the defect
Maximum Amplitude Remember: The peak which maximised does not have to be the tallest or the first one Length The probe is to be moved to the other end of the defect The signals will flactuate as the beam hits the different faces of the defects The probe is moved back into the defect and to observe a peak of the signal maximises Mark the point under the centre of the probe which indicates the edge of the defect The length of the defect is measured
Equalization Technique The equalization technique can ONLY be used if the defect is halfway the thickness At this point the whole beam is on the back wall At this point the whole beam is on the defect At the edge of the defect, half of the beam is on the defect, and another half is on the back wall Defect BWE The BWE is at it maximum The Defect echo is at it maximum The defect echo is at equal height as the back wall The point is marked as the edge of defect
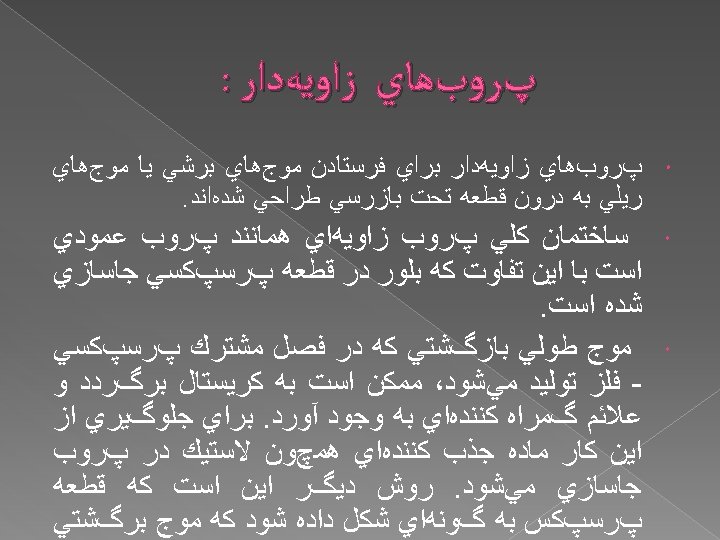
Ultrasonic Displays � A scan The CRT (Cathode Ray Tube) display The Horizontal axis : Represents time base / path length / distance / depth The Vertical axis : beam Represent the amount of sound energy returned to the crystal
Ultrasonic Displays B scan The End View Display B
Ultrasonic Displays C scan The Plan View Display C
Ultrasonic Displays D scan The Side View Display D
Ultrasonic Test Methods Pulse Echo Through Transmission with Reflection (pulse echo techniques where the transmitter is separate from the receiver - e. g. tandem testing, time of flight)
Pulse Echo Technique Single probe sends and receives sound Gives an indication of defect depth and dimensions
Using Ultrasound for Testing: PULSE ECHO
Using Ultrasound for Testing: PULSE ECHO
Using Ultrasound for Testing: PULSE ECHO
Using Ultrasound for Testing: PULSE ECHO
Through Transmission Testing Transmitting and receiving probes on opposite sides of the specimen Pulsed or Continuous sound Presence of defect indicated by reduction in transmission signal No indication of defect location Easily automated Commonly integrated into plate rolling mills - lamination testing
Through Transmission Technique Transmitting and receiving probes on opposite sides of the specimen Presence of defect indicated by reduction in transmission signal No indication of defect location Tx Rx
Transmission with Reflection T Also known as: Tandem Technique or Pitch and Catch Technique R
Transmission with Reflection T R TANDEM TESTING
Gap Scanning Probe held a fixed distance above the surface (1 or 2 mm) Couplant is fed into the gap
Immersion Testing Component is placed in a water filled tank Item is scanned with a probe at a fixed distance above the surface
Immersion Testing
Immersion Testing Water path distance Front surface Defect Water path distance Back surface
Using Ultrasound for Testing PULSE ECHO
ULTRASONIC EXAMINATION OF WELDS 40 450 BACK GOUGE DOUBLE SIDED “T” JOINT 40 450
ULTRASONIC EXAMINATION OF WELDS COVERAGE OF FUSION FACES COVERAGE OF WELD VOLUME 100 (appro x. ) 0 0
ULTRASONIC EXAMINATION OF WELDS COVERAGE OF FUSION FACES 0 45 COVERAGE OF WELD VOLUME
SCANNING FOR TRANSVERSE IMPERFECTIONS 0 45
SCANNING FOR TRANSVERSE IMPERFECTIONS
THREADLIKE DEFECTS, POINT DEFECTS AND FLAT PLANAR DEFECTS ORIENTATED NEARNORMAL TO THE BEAM AXIS ALL PRODUCE AN ECHO RESPONSE WHICH HAS A SINGLE PEAK:
THESE DEFECTS CAN BE DIFFERENTIATED BETWEEN BY OBSERVING THE ECHO DYNAMIC BEHAVIOUR IN LENGTH AND DEPTH SCANS: POINT THREADLIKE PLANAR (NEAR NORMAL INCIDENCE) DEPTH SCAN LENGTH SCAN NOTE: THE RESPONSE FROM A PLANAR DEFECT WILL BE STRONGLY AFFECTED BY PROBE ANGLE WHILE THAT FROM A THREADLIKE REFLECTOR WILL REMAIN ALMOST UNCHANGED IF A DIFFERENT PROBE ANGLE IS
THE ECHO RESPONSE FROM A LARGE SLAG INCLUSION OR A ROUGH CRACK IS LIKELY TO HAVE MULTIPLE PEAKS:
SOMETIMES IT WILL BE POSSIBLE TO DIFFERENTIATE BETWEEN THESE 2 DEFECTS SIMPLY BY PLOTTING THEIR POSITION WITHIN THE WELD ZONE: A. PROBABLE SLAG, POSSIBLE CENTRELINE CRACK B. PROBABLE HAZ CRACK
IN CASE “A” IT WILL BE DIFFICULT TO DETERMINE WHETHER THE DEFECT IS SLAG OR A CRACK. “ROTATIONAL” OR “ORBITAL” PROBE MOVEMENTS MAY HELP: ORBITAL ROTATIONAL
TYPICAL ECHO DYNAMIC PATTERNS CRACK ORBITA L SCAN ROTATIONA L SCAN SLAG
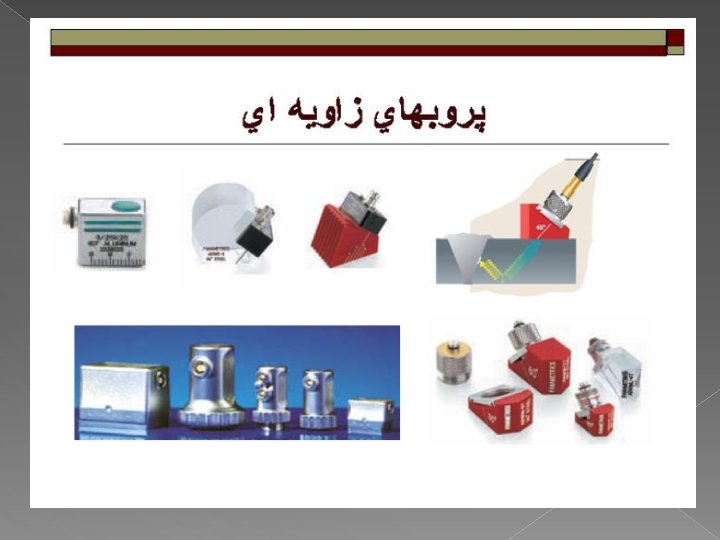
Calibration Blocks and Their Usage § I. I. W (International Institute of Welding) Block / V 1 / A 2 Block 300 mm 5 mm 100 mm 50 mm Dia Perspex 10 mm 91 mm 85 mm 100 mm 1. 5 mm Dia 35 mm 15 mm 200 mm 23 mm USES Compressio nal Shear 25 mm
A 4 / V 2 / DIN 54/122 / KIDNEY BLOCK R 25 12. 5 mm or 20 mm R 50 1. 5 OR 5 mm dia. hole PLAN VIEW USES a) Compressional Probes i. Calibration This block can be purchased having a thickness of either 12. 5 mm 20 mm. b)or. Shear Probes i. Calibration When aiming at 25 mm radius, signals occur at 25, 100, 175, 250, etc. ii. Index Point at 50 mm radius, signals occur at 50, 125, 200, When aiming 275, etc. Aiming at 25 mm or 50 mm radius, maximise signal and mark iii. index. Probe Angle By maximising echo from either 1. 5 mm or 5 mm diameter hole and read on side of test block.