Evidencebased librarianship Dr Ali Rashidi Not All Science

Evidence-based librarianship Dr. Ali Rashidi

Not All Science is the Same Good Science • • Improved diagnosis, treatment Understanding of disease Wealth generation Progress in general Bad Science • Dead end • Papers which end in the trash • Electronic documents lost in cyberspace Roberto Romero, AJOG, 2016.

The science of ‘trashing’ a paper Unimportant issue Unoriginal Hypothesis not tested Badly written Different type of study required Conflict of interest Compromised original protocol Unjustified conclusion Poor statistics Sample size too small

Why do we evaluate scientific output • • • Internation al National Institutional SPLIT IN NEEDS Faculty SPLIT IN NEEDS Researchers • • Grant Allocations Policy Decisions Benchmarking Promotion Collection management Funding allocations Research Hiring Making the right investment

Bibliometrics The application of mathematics and statistical methods to assess science as an informational process Nalimov VV, Mulchenko BM. Measurement of science: study of the development of science as an information process. Washington, DC: Foreign Technology Division, 1971

Measuring Productivity in Science w Option 1: Number of papers published n n This matrix emphasizes quantity (vs. quality) What if most of papers are not important or have no influence in science or medicine? w Option 2: Attempt to measure quality n Has the paper been cited by others? n Has the paper influenced the field? Roberto Romero, AJOG, 2016.

Why are Citations Important? w “Attention is the mode of payment in science” w “Money is not the main motive for engaging in science” w “Success in science is rewarded with attention” w Citations = attention Franck G. Science 1999; 286, 5437: 53 -55

Conclusion w “Citations are the fee paid through transfer of some of the attention earned by the citing author, to the cited author” Franck G. Science 1999; 286, 5437: 53 -55

Eugene Garfield, Ph. D w Informational scientist w Proposed citation indices in 1955 w Journal Impact Factor in 1960 w Institute for Scientific Information (ISI) w Journal of Citation Reports w Web of Science/Knowledge w Purchased by Thomson Reuters http: //garfield. library. upenn. edu/

Birth of the Science Citation Index Science. 1955; 122: 108 -11

Journal Impact Factor Science. 1972; 178: 471 -9.

Definition of the Impact Factor of a Journal Impact Factor = No of citations to all articles published in a particular year (e. g. 2015) Total No of “citable items” published in the 2 previous years (e. g. 2013 and 2014) "Citable items" for this calculation are usually original articles or reviews; not Editorials, Viewpoints, Abstracts or Letters to the Editor. Roberto Romero, AJOG, 2016.

ISI Impact Factor A= total cites in 1992 B= 1992 cites to articles published in 1990 -91 (this is a subset of A)* C= number of articles published in 1990 -91 D= B/C = 1992 impact factor

Journal of Citation Reports

Journal Citation Reports 2014 Abbreviated Journal Title Impact Factor 1 HUM REPROD UPDATE 10. 165 6625 10. 818 60 2 OBSTET GYNECOL 5. 175 26836 5. 098 282 3 AM J OBSTET GYNECOL 4. 704 33839 4. 142 364 4 FERTIL STERIL 4. 59 31236 4. 255 490 5 HUM REPROD 4. 569 28113 4. 729 304 6 ULTRASOUND OBST GYN 3. 853 9248 3. 584 186 7 GYNECOL ONCOL 3. 774 19159 3. 843 408 8 MOL HUM REPROD 3. 747 5078 3. 956 111 9 BJOG-INT J OBSTET GY 3. 448 13139 3. 726 223 10 MENOPAUSE 3. 361 4260 3. 159 156 Rank {2014} Total 5 -Year Impact Cites Factor {2014} Articles Journal of Citation Reports

Impact Factor Interpretation w Journals with a high impact factor are considered more prestigious than journals with a lower impact factor w A paper published in AJOG has an average probability of being cited 4. 7 times in the next 2 years w Impact Factor: How Many People Read My Article? Roberto Romero, AJOG, 2016.

The Impact Factor Variability and Journal Size Mean Change in IF 06 -07 40% 30% 20% 10% 0% -10% -20% -30% -40% <35 35 -69 70 -150 >150 Journal Size Number of Articles per Year Amin M, Mabe MA. Medicina (B Aires). 2003; 63: 347 -54.

Journal Citation Reports 2014 Abbreviated Journal Title Impact Factor 1 HUM REPROD UPDATE 10. 165 6625 10. 818 60 2 OBSTET GYNECOL 5. 175 26836 5. 098 282 3 AM J OBSTET GYNECOL 4. 704 33839 4. 142 364 4 FERTIL STERIL 4. 59 31236 4. 255 490 5 HUM REPROD 4. 569 28113 4. 729 304 6 ULTRASOUND OBST GYN 3. 853 9248 3. 584 186 7 GYNECOL ONCOL 3. 774 19159 3. 843 408 8 MOL HUM REPROD 3. 747 5078 3. 956 111 9 BJOG-INT J OBSTET GY 3. 448 13139 3. 726 223 10 MENOPAUSE 3. 361 4260 3. 159 156 Rank {2014} Total 5 -Year Impact Cites Factor {2014} Articles Journal of Citation Reports

Eigenfactor Score: A Sophisticated Measure of Journal Prestige w A journal's Eigenfactor score is measured as its importance to the scientific community. Scores are scaled so that the sum of all journal scores is 100. In 2006, Nature had the highest score of 1. 992. w Percentage of weighted citations received by a journal compared to all 6, 000 journals analyzed from the 2004 Journal of Citation Reports dataset. w Instead of each citation to a journal being counted as 1, each citation received by a journal is instead assigned a value greater or lesser than 1 based on the Eigenfactor of the citing journal Courtesy of David Tempest

Eigenfactor Score w Generally identifies journals that have most impact in their subject areas (Eigenfactor: How Many People Read this Journal? ) w Bigger and highly cited journals will tend to be at the top of rankings according to Eigenfactor w Exclusion of journal self-citations in the calculation of the Eigenfactor minimises citation practices of some journals, but will penalize journals that serve small niches w Review Journals are de-emphasised in Eigenfactor score Courtesy of David Tempest

Eigenfactor Score Abbreviated Journal Title Eigenfactor Score 1 FERTIL STERIL 0. 05759 2 OBSTET GYNECOL 0. 04815 3 AM J OBSTET GYNECOL 0. 04773 4 HUM REPROD 0. 04172 5 GYNECOL ONCOL 0. 03311 6 BJOG-INT J OBSTET GY 0. 02324 7 ULTRASOUND OBST GYN 0. 01839 8 HUM REPROD UPDATE 0. 01442 9 MENOPAUSE 0. 01063 10 MOL HUM REPROD 0. 00804 Rank Journal of Citation Reports

Journal vs. Author Roberto Romero, AJOG, 2016.

www-physics. ucsd. edu Professor Jorge E. Hirsch Proc Natl Acad Sci U S A. 2005; 102: 16569 -72.

H-Index w Rates a scientist’s performance based on his/her career publications, as measured by the lifetime number of citations each article receives w Depends on both quantity (number of publications) and quality (number of citations) of a scientist’s publications Roberto Romero, AJOG, 2016.

H-Index w Definition: “A scientist has index h if h of their N papers have at least h citations each, and the other (N – h) papers have no more than h citations each. ” w Translation of definition: If you list all of an author’s publications in descending order of the number of citations received to date, their h-index is 10 if at least 10 papers have each received 10 or more citations.

H-index example Author A Doc 1 2 3 4 5 6 7 8 9 Cit 55 45 20 10 5 4 3 2 1 Author B Doc 1 2 3 4 Cit 25 20 9 6 27

H-index example Author X has 5 published articles: Article 1, citations 5 Article 2, citations 10 Article 3, citations 100 Article 4, citations 6 Article 5, citations 4 The H-index of X is 4: there are 4 papers with at least 4 citations each.

How to Calculate Your H-Index Roberto Romero, AJOG, 2016.

scholar. google. com

Step 1: Profile https: //www. wageningenur. nl

Step 2: Articles https: //www. wageningenur. nl

Step 3: Updates https: //www. wageningenur. nl

Other Indicators of Journal Prestige: Citation Classics Roberto Romero, AJOG, 2016.

The g-index w Suggested in 2006 by Leo Egghe. w The index is calculated based on the distribution of citations received by a given researcher's publications.
![The g-index w G-Index is calculated this way: "[Given a set of articles] ranked](http://slidetodoc.com/presentation_image/5c96874e06720830e104f59856319359/image-36.jpg "The g-index w G-Index is calculated this way: \"[Given a set of articles] ranked")
The g-index w G-Index is calculated this way: "[Given a set of articles] ranked in decreasing order of the number of citations that they received, the GIndex is the (unique) largest number such that the top g articles received (together) at least g^2 citations. "

The g-index
ﺭﺗﺒﻪ( ﻣﻘﺎﻟﻪ ﺟﻤﻊ ﻛﻞ ﺍﺳﺘﻨﺎﺩ g 2 22 1")
ﺗﻌﺪﺍﺩ ﺍﺳﺘﻨﺎﺩ g ﺗﻌﺪﺍﺩ )ﺭﺗﺒﻪ( ﻣﻘﺎﻟﻪ ﺟﻤﻊ ﻛﻞ ﺍﺳﺘﻨﺎﺩ g 2 22 1 17 2 39 4 17 3 56 9 15 4 71 16 10 5 81 25 9 6 90 36 Hi## 7 HI## 7 97 49 6 8 103 64 4 9 107 81 3 Gi ## 10 100 2 11 112 121 2 12 114 144

i 10 -Index Created by Google Scholar and used in Google's My Citations feature. i 10 -Index = the number of publications with at least 10 citations. This very simple measure is only used by Google Scholar, and is another way to help gauge the productivity of a scholar. Advantages of i 10 -Index Very simple and straightforward to calculate My Citations in Google Scholar is free and easy to use Disadvantages of i 10 -Index Used only in Google Scholar

Field-Weighted Citation Impact takes into account the differences in research behavior across disciplines. (Connect to Sci. Val) w w w w Sourced from Sci. Val, this metric indicates how the number of citations received by a researchers publications compares with the average number of citations received by all other similar publications indexed in the Scopus database. A Field-Weighted Citation Impact of 1. 00 indicates that the publications have been cited at world average for similar publications. A Field-Weighted Citation Impact of greater than 1. 00 indicates that the publications have been cited more than would be expected based on the world average for similar publications, for example a score of 1. 44 means that the outputs have been cited 44% more times than expected. A Field-Weighted Citation Impact of less than 1. 00 indicates that the publications have been cited less that would be expected based on the world average for similar publications, for example a score of 0. 85 means 15% less cited than world average. Similar publications are those publications in the Scopus database that have the same publication year, publication type and discipline. Field-Weighted Citation Impact refers to citations received in the year of publication plus the following 3 years. Field-Weighted Citation Impact metrics are useful to benchmark regardless of differences in size, disciplinary profile, age and publication type composition, and provide and useful way to evaluate the prestige of a researcher’s citation performance.
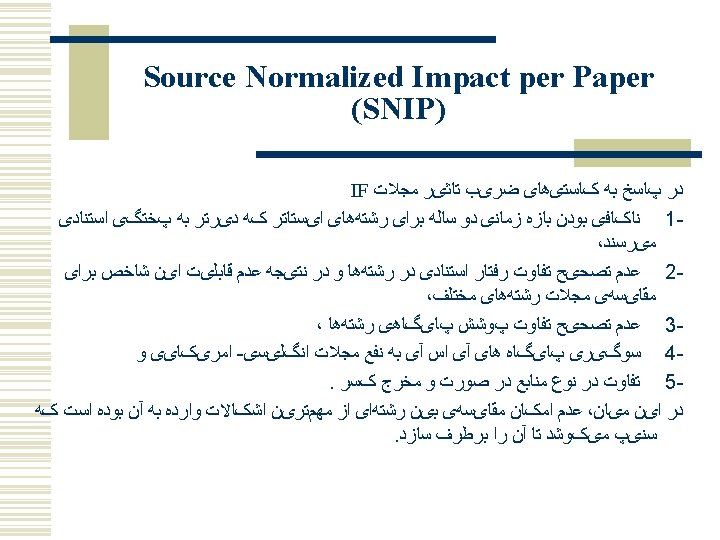
 SNIP was created by Professor Henk Moed at")
Source Normalized Impact per Paper (SNIP) SNIP was created by Professor Henk Moed at the Centre for Science and Technology Studies (CTWS), University of Leiden. It measures contextual citation impact by weighting citations based on the total number of citations in a subject field, using Scopus data. Or, as stated by the CTWS, “SNIP corrects for differences in citation practices between scientific fields, thereby allowing for more accurate between-field comparisons of citation impact. ”

Citation Databases w Web of Science w Scopus w Google Scholar
 n Other indicators")
Other Tools Available w Other bibliometric indicators: Journal Citation Reports (JCR) n Other indicators databases (national, essential, university, institutional) n ISIHighly. Cited. com n
 Wo. S SCOPUS Google")
Wo. S and Scopus: Subject Coverage (% of total records) Wo. S SCOPUS Google Scholar ?

Web of Science w Covers around 9, 000 journal titles and 200 book series divided between SCI, SSCI and A&HCI. w Electronic back files available to 1900 for SCI and mid- 50 s for SSCI and mid-70 s for A&HCI. w Very good coverage of sciences; patchy on “softer” sciences, social sciences and arts and humanities. w US and English-language biased. w Full coverage of citations. w Name disambiguation tool. w Limited downloading options.

Scopus w Positioning itself as an alternative to ISI w More journals from smaller publishers and open access (+15, 000 journals; 750 conf proceedings) w Source data back to 1960. w Excellent for physical and biological sciences; poor for social sciences; does not cover humanities or arts. w Better international coverage (60% of titles are non-US) w Back to 1996 ! (e. g. citation data for the last decade only) w Not “cover to cover” and not up to date w Easy to use in searching for source publications; clumsy in searching cited publications. w Citation tracker works up to 1000 records only. w Limited downloading options.

What is Scopus? w w w w +15, 200 titles from more than 4, 000 publishers +1, 000+ Open Access journals +500 Conference Proceedings 400 M web pages 21 M patents Repositories Digital Archives 48

What is Scopus? 240 million scholarly Web items, E-prints, theses, dissertations, 13 M patents Focused 15, 100 titles web STM & information World’s Social scienc Largest es Abstract & Citation Database 4, 000 Academic publisher library s sources Fastest route to Full. Text 49 15% Elsevier sources 85% other publishers
 4,")
Scopus Coverage 15, 100 Unique titles 5, 900 Life & Health (100% Medline) 4, 500 Chemistry Physics Engineering 2, 500 Biological Agricultural Environmental 2, 700 Social Sciences Psychology Economics

International distribution of titles 6872 806 5336 1390 189 198 251 51

Geographical spread of Scopus content 52

Iranian Titles indexed in Scopus • • Iranian Biomedical Journal Archives of Iranian Medicine Daru Iranian Journal of Diabetes and Lipid Disorders Iranian Journal of Medical Sciences Iranian Journal of Public Health Journal of Medicinal Plants Yakhteh 53

Google Scholar w w w w Better coverage for all citations as it retrieve web ! More coverage of references also gray literature ! Coverage and scope? Inclusion criteria? Very limited search options No separate cited author search Back to 1990 NOT more ! Free!

The H-Graphs in Scopus v A more comprehensive way evaluating an author v Using Author Search, Scopus give us three different graphs Ø Ø Ø H-Index Graph of given Author No of Author Papers (Articles) per year No of Author Citations per year

No of articles No of citations h-index plot 56

The h-index w Plots citations per article w Incision = h-index w Shows low & highly citedby counts w Completely transparent w The date range can change Practical Interpretation: Promotion, Evaluation, Funding, Tenure, Benchmarking 57

Author articles history w Shows level of activity w Shows peaks and troths in publication history w Can change the date range Practical Interpretation: Promotion, Evaluation, Funding, Tenure, Benchmarking 58

Author Cited-by’s w Shows level of activity w Shows highs & lows w Can change the date range w Time lag! Practical Interpretation: Promotion, Evaluation, Funding, Tenure, Benchmarking 59

How to calculate h-index through Scopus w There is two way to calculate it according to the way you want: w If you want it for an Author: n Search the Author, It will calculate it Automatically for you. w If you want it for a group of Papers n Search them & then use the track citation & sort them out to count & calculate it Manually.

The Hirsch Index: For a Group of Papers § Run an author search § Sort result by citations, clicking on Cited by § Scroll down the new display of results until the ranking number is equal or less than the number of citations. § That ranking number is the Hirsch Index for that author. 61

Author Identifier functionality • Author Identifier enables Scopus users to avoid two major problems which affect most A&I databases: n n How to distinguish between an author’s articles and those of another author sharing the same name? How to group an author’s articles together when his or her name has been recorded in different ways? • With other databases, these problems can result in retrieving incomplete or inaccurate results.

Calculating the H-index: For a Group of Papers

Indicators of quality as measured using published outputs w Number of publications w Citation counts to these publications (adjusted for selfcitations) -what “window” should be used? 4, 5, 10 years? w Citations per publication w Percentage of uncited papers w Impact factors (of publishing journals) w Diffusion factor (of citing journals) – profile of users of research (who, where, when and what) w “Impact factor” of a scholar - Hirsh index (h index) n n (numbers of papers with this number of citations). Your h index =75 if you wrote at least 75 papers with 75 citations each. Note: These should not be seen as “absolute” numbers but always seen in the context of the discipline, research type, institution profile, seniority of a researcher, etc.
 2) 3) Conduct a General")
Calculating h-index using Thomson ISI Web of Science 1) 2) 3) Conduct a General Search Automatic: click on “Citation Report”, or, Manual: sort by “Times Cited”

CWTS Journal Indicators SJR : Scientific Journal Rankings – SCImago Journal Metrics - Scopus. com CWTS Leiden Ranking 2016

My h-index is bigger than yours! Edward Witten Physicist h=132 But more people know who I am! Stephen Hawking Physicist h=62

Researcher. ID http: //www. researcherid. com

Google Scholar Citation Service http: //scholar. google. com/citations

Examples of Scientific Social Networks http: //www. researchgate. net/ n http: //www. mendeley. com/ n http: //www. linkedin. com n http: //www. academia. edu/ n https: //orcid. org/ n https: //www. mysciencework. com/#worldscientific-community n http: //www. scholaruniverse. com/ n

Researchgate

Mendeley

Academia
")
ORCi. D (Open Researcher & Contributor ID)

My. Science. Work

scholaruniverse

iam. Researcher http: //www. iamresearcher. com

i. AMscientist http: //www. iamscientist. com

- Slides: 79