Titrimetric Analysis Titrations Taking Advantage of Stoichiometric Reactions


 Graph showing how the concentration of one of the")
 Three distinct regions in titration curve Ø Before,")


 1) using a ruler, draw lines that follow")
 3) using a ruler, measure the distance between")
 5) draw a vertical line from the equivalence")


 S 2")


 or turbidity")


 Use Absorbance of Light to Follow Progress of Titration")
 Use Absorbance of Light to Follow Progress of Titration")

- Slides: 67
Titrimetric Analysis Titrations: Taking Advantage of Stoichiometric Reactions
n n Titrimetric methods include a large and powerful group of quantitative procedures based on measuring the amount of a reagent of known concentration that is consumed by the analyte. Titrimetry is a term which includes a group of analytical methods based on determining the quantity of a reagent of known concentration that is required to react completely with the analyte.
n There are three main types of titrimetry: volumetric titrimetry, gravimetric titrimetry, and coulometrtic titrimetry. n Volumetric titrimetry is used to measure the volume of a solution of n Gravimetric titrimetry is like volumetric titrimetry, but the mass is measured instead of the volume. n Coulometric titrimetry is where the reagent is a constant direct electrical n The benefits of these methods are that they are rapid, accurate, convenient, and readily available. known concentration that is needed to react completely with the analyte. current of known magnitude that consumes the analyte; the time required to complete the electrochemical reaction is measured.
Defining Terms n n Standard Solution Titration Equivalence Point Back- Titration
Defining terms § Standard Solution: A reagent of a known concentration which is used in the titrimetric analysis. § Titration: This is performed by adding a standard solution from a burette or other liquid- dispensing device to a solution of the analyte until the point at which the reaction is believed to be complete.
More Defining Terms § Equivalence Point: Occurs in a titration at the point in which the amount of added titrant is chemically equivalent to the amount of analyte in a sample. § Back- Titration: This is a process that is sometimes necessary in which an excess of the standard titrant is added, and the amount of the excess is determined by back titration with a second standard titrant. In this instance the equivalence point corresponds with the amount of initial titrant is chemically equivalent to the amount of analyte plus the amount of back- titrant.
Equivalence Points and End Points One can only estimate the equivalence point by observing a physical change associated with the condition of equivalence. § End point: The point in titration when a physical change occurs that is associated with the condition of chemical equivalence. n Indicators are used to give an observable physical change (end point) at or near the equivalence point by adding them to the analyte. The difference between the end point and equivalence point should be very small and this difference is referred to as titration error. To determine the titration error: Et= Vep - Veq Et is the titration error n Vep is the actual volume used to get to the end point n Veq is theoretical value of reagent required to reach the end point n
Indication Methods n Conductimetric Indication n The electrical conductance of a solution is a measure of its current carrying capacity and is determined by its total ionic strength. It is a non-specific property. Conductance is defined as the reciprocal of resistance (Siemans, -1).
Conductimetric Indication n Acid-base titrations especially at trace levels. n Relative precision better than 1% at all levels. n n Rate of change of conductance as a function of added titrant used to determine the equivalence point. High concentrations of other electrolytes can interfere.
Theory of Indicator Behaviour n n An acid/base indicator is a weak organic acid or a weak organic base whose undissociated form differs in colour from its conjugate base or conjugate acid form. The behaviour of an acid type indicator is described by the equilibrium;
Theory of Indicator Behaviour l n l HIn + H 2 O In- + H 3 O+ The behaviour of an base type indicator is described by the equilibrium; In + H 2 O In. H+ + OH-
Theory of Indicator Behaviour
Primary Standards n A primary standard is a highly purified compound that serves as a reference material in all volumetric and mass titrimetric properties. The accuracy depends on the properties of a compound and the important properties are: n 1. High purity n 2. Atmospheric stability n 3. Absence of hydrate water n 4. Readily available at a modest cost n 5. Reasonable solution in the titration medium n 6. Reasonably large molar mass Compounds that meet or even approach these criteria are few, and only a few primary standards are available.
Primary standards for different types of titrations n Acid-base reactions. n Na 2 CO 3, Na 2 B 4 O 7, KH(C 8 H 4 O 4), HCl (cbpt. ) n n n Complex formation reactions. n Ag. NO 3, Na. Cl Precipitation reactions. n Ag. NO 3, KCl Redox reactions. n K 2 Cr 2 O 7, Na 2 C 2 O 4, I 2
Secondary Standards n A substance that can be used for standardisations, and whose concentration of active substance has been determined by comparison to a primary standard.
Standard Solutions Standard solutions play a key role in titrimetric methods. Desirable Properties of Standard Solutions: 1. Sufficiently stable 2. React rapidly with analyte 3. React completely with analyte 4. Endure a selective reaction with analyte
Types of Titrations n Volumetric n n n Acid-Base/Neutralisation Redox Gravimetric Precipitation Complexometric Coulometric
Neutralisation Titrations n n The neutralisation reactions between acids and bases used in chemical analysis. These reactions involve combination of hydrogen hydroxide ions to form water. the and
Neutralisation Titrations n n For any actual titration the correct end point will be characterised by a definite value of the hydrogen ion concentration. This value will depend upon the nature of the acid and the base, the concentration of the solution and the nature of the indicator.
Neutralisation Titrations n n A large number of substances called neutralisation indicators change colour according to the hydrogen ion concentration of the solution. The end point can also be determined electrochemically by either potentiometric or conductimetric methods.
Example of volumetric titration set up http: //wine 1. sb. fsu. edu/chm 1045/notes/Aqueous/Stoich/Aqua 02. htm
Titrations Titration Curve 1. ) Graph showing how the concentration of one of the reactants varies as titrant is added. Sharpness determined by titration condition Monitor p. H, voltage, current, color, absorbance, ppt. Ø Ø Understand the chemistry that occurs during titration Learn how experimental control can be exerted to influence the quality of an analytical titration - No end point at wrong p. H Concentration of analyte and titrant and size of Ksp influence end point Help choose indicator for acid/base and oxidation/reduction titrations
Titrations Precipitation Titration Curve 4. ) Three distinct regions in titration curve Ø Before, at and after the equivalence point. after at before
Titration curves
A Typical Titration Curve mid point equivalence point
Find the Equivalence Point (Geometric method) 1) using a ruler, draw lines that follow the flat, more horizontal part of the curve equivalence point 2) draw a line that follows the flat, more vertical part of the curve
Find the Equivalence Point (Geometric method) 3) using a ruler, measure the distance between the top intersection and the bottom intersection equivalence point 4) the geometric center of this line segment is the equivalence point
Find the Equivalence Point (Geometric method) 5) draw a vertical line from the equivalence point to the x-axis equivalence point 6) where the line crosses the x-axis is the volume at the equivalence point (28. 7 m. L in this case)
Theory of Indicator Behaviour n n Acid-base indicators take advantage of the rapid change in p. H of the solution being titrated as the equivalence point is reached. The choice of an indicator is determined by the p. H of the solution at the equivalence point.
Neutralisation Titrations
Figure 19. 4 Colors and approximate p. H range of some common acid-base indicators
Strong Acid-Strong base Titration np. H starts low and increases gradually as acid is neutralized by the added base n. Close to equivalence point p. H rises steeply n. Beyond this, p. H increases slowly with addition of more base n. Equivalence point – the mol OH 1 - = mol H 1+ –The p. H = 7
Figure 19. 6 Curve for a strong acid-strong base titration Copyright © The Mc. Graw-Hill Companies, Inc. Permission required for reproduction or display.
Weak Acid-Strong Base Titration n. Initial p. H of weak acid starts higher than p. H of a strong acid of the same molarity and then increases as the acid is neutralized by added base n. Gradually rising curve is called buffer region as the weak acid HA reacts with the strong base to produce its conjugate base A 1 n. At the mid-point of buffer region half of original HA has reacted with the base to produce A 1 n. Unreacted [HA] = [A 1 - ] so Ratio [A 1 - ] / [HA] = 1
Titration of 40. 00 m. L of 0. 1000 M HPr with 0. 1000 M Na. OH Figure 19. 7 Curve for a weak acidstrong base titration p. H = 8. 80 at equivalence point p. Ka of HPr = 4. 89 [HPr] = [Pr] methyl red Copyright © The Mc. Graw-Hill Companies, Inc. Permission required for reproduction or display.
Weak Acid-Strong Base Titration n. Using the Henderson-Hasselbalch equation np. H = p. Ka + log ([A 1 - ] / [HA] ) np. H = p. Ka + log (1) np. H = p. Ka n. Experimental procedure used for estimating Ka of unknown acid n. Close to equivalence point p. H rises steeply n. At the equivalence point p. H is greater than 7 due to presence of the weak base A 1 -
Titration of 40. 00 m. L of 0. 1000 M NH 3 with 0. 1000 M HCl Figure 19. 8 p. Ka of NH 4+ = 9. 25 Curve for a weak basestrong acid titration p. H = 5. 27 at equivalence point Copyright © The Mc. Graw-Hill Companies, Inc. Permission required for reproduction or display.
Weak Base-Strong Acid Titration n. Initial p. H of weak base starts higher than 7 but lower than p. H of a strong base of the same molarity and then decreases as the weak base is neutralized by added acid n. Gradually dropping curve is called buffer region as the weak base B reacts with the strong acid to produce its conjugate acid BH 1+ n. At the mid-point of buffer region half of original B has reacted with strong acid to produce BH 1+ n. Unreacted [B] = [BH 1+ ] so Ratio [B] / [BH 1+ ] = 1
Neutralisation Titrations- Polyfunctional acids n l e. g. Phosphoric acid Yield multiple end points in a titration.
Figure 19. 9 Curve for the titration of a weak polyprotic acid. p. Ka = 7. 19 p. Ka = 1. 85 Titration of 40. 00 m. L of 0. 1000 M H 2 SO 3 with 0. 1000 M Na. OH Copyright © The Mc. Graw-Hill Companies, Inc. Permission required for reproduction or display.
Redox Titrations Titration of a reducing agent by an oxidizing agent or titration of an oxidizing agent by a reducing agent. n Potassium Permanganate n Potassium Dichromate n Cerium IV n Iodine
Redox Titrations n Potassium Permanganate Mn. O 4 - + 8 H+ + 5 e- Mn 2+ + 4 H 2 O l Standardisation v Sodium oxalate or arsenic (III) oxide l Many Analyses
Redox Titrations n Persulphates: n n Add an excess of iron (II) S 2 O 82 - + 2 Fe 2+ + 2 H+ 2 Fe 3+ + 2 HSO 4 The excess iron (II) is determined by back titration against standardised permangenate. Mn. O 4 - + 8 H+ + 5 Fe 2+ Mn 2+ + 5 Fe 2+ + 4 H 2 O
Redox Titrations n Hydrogen Peroxide: n n 2 Mn. O 4 - + 5 H 2 O 2 + 6 H+ 2 Mn 2+ + 5 O 2 + 8 H 2 O Nitrites: n 2 Mn. O 4 - + 5 NO 2 - + 6 H+ 2 Mn 2+ + 5 NO 3 - + 3 H 2 O
Complexometric Titrations n n Titrations between cations complex forming reagents. and The most useful of these complexing agents are organic compounds with several electron donor groups that can form multiple covalent bonds with metal ions.
Complexometric Titrations n n Most metal ions react with electronpair donors to form coordination compounds or complex ions. The donor species, or LIGAND, must have at least one pair of unshared electrons available.
Complexometric Titrations n n n The number of bonds a cation forms with an electron donor is called the COORDINATION NUMBER. Typical values are 2, 4 and 6. The species formed as a result of coordination can be electrically positive, neutral or negative.
Complexometric Titrations n n A chelate is produced when a metal ion coordinates to two or more donor groups within a single ligand. For example the copper complex of glycine.
Complexometric Titrations NH 2 Cu 2+ + 2 H C C H O C O O OH O C Cu C N H 2 N C H 2 O + 2 H+
Complexometric Titrations n n n A ligand with a single donor group is called unidentate. Glycine is bidentate. Tri, tetra, penta and hexadentate chelating agents are also known.
Complexometric Titrations n n n Multidentate ligands have two advantages over unidentate ligands. They react more completely with cations to provide a sharper endpoint. The reaction is a single step process.
Complexometric Titrations n Tertiary amines that also contain carboxylic acid groups form remarkably stable chelates with many metal ions. n Ethylenediaminetetraacetic Acid HOOCCH 2 COOH N HOOCCH 2 EDTA CH 2 N CH 2 COOH
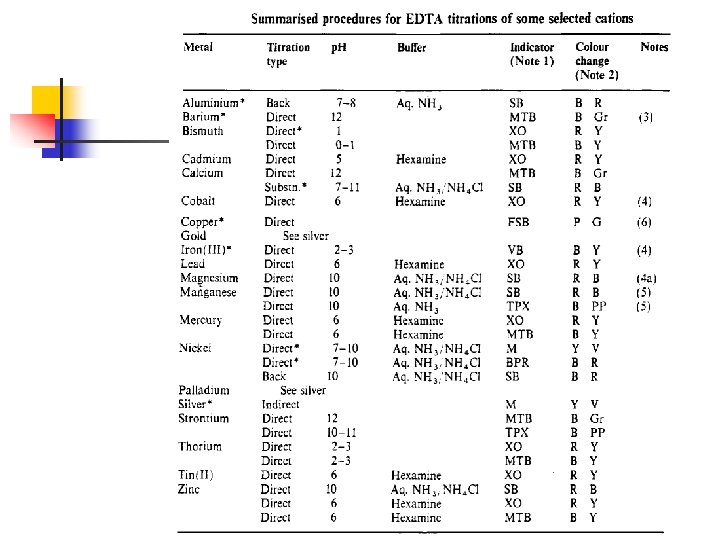
Complexometric Titrations n n n EDTA can complex a large number of metal ions. Approximately 40 cations determined by direct titration. can be EDTA is usually used as the disodium salt, Na 2 H 2 EDTA 2 - + M 2+ [M(EDTA)]2 - + +
Complexometric Titrations n n Because EDTA complexes most cations, the reagent might appear at first glance to be totally lacking in selectivity. However, great control can be acheived by p. H regulation and the selection of suitable indicators.
Complexometric Titrations n Indicators are generally complexing agents which undergo a colour change when bonded to a metal ion. H 2 EDTA 2 - + [M(Ind)] [M(EDTA)]2 - + Ind 2+ 2 H+
Complexometric Titrations n Typical indicators are: n n n Murexide Solochrome black Calmagite Bromopyrogallol red Xylenol orange
Complexometric Titrations n Typical applications: n n Determination of cations Hardness of water
Precipitation Titrations n n n Titrations between analytes and reagents resulting in the formation of a precipitate. The most useful of these precipitating reagents is silver nitrate. Titrimetric methods based upon the use of silver nitrate are sometimes called Argentometric titrations.
Precipitation Titrations n Used for the determination of many anions including: n n n halides divalent anions certain fatty acids
Precipitation Titrations n n Precipitation titrations are based on the SOLUBILITY PRODUCT of the salt, KSP. The smaller KSP, the less soluble the silver salt and the easier it is to determine the endpoint
Precipitation Titrations n Endpoint determination is by coloured indicators (usually back titrations) or turbidity methods. n The most accurate is the VOLHARD METHOD.
Precipitation Titrations n n VOLHARD METHOD A back titration of thiocyanate ions against the excess silver ions using an iron (II) salt as the indicator.
Precipitation Titrations Ag+ + SCN- Ag. SCN Fe 3+ + SCN- Fe. SCN 2+ Blood Red
Titrations Spectrophotometric Titrations 1. ) Use Absorbance of Light to Follow Progress of Titration Ø Example: - Titrate a protein with Fe 3+ where product (complex) has red color Product has an absorbance maximum at 465 nm Absorbance is proportional to the concentration of iron bound to protein Analyte (colorless) titrant (colorless) As Fe 3+ binds protein solution turns red (red)
Titrations Spectrophotometric Titrations 1. ) Use Absorbance of Light to Follow Progress of Titration Ø Example: - As more Fe 3+ is added, red color and absorbance increases, When the protein is saturated with iron, no further color can form End point – intersection of two lines (titrant has some absorbance at 465 nm) When all the protein is bound to Fe 3+, no further increase in absorbance. As Fe 3+ continues to bind protein red color and absorbance increases.
References n n Skoog, D. , West, D. , Holler, F. J. , & Crouch, S. (2000). Analytical Chemistry: An Introduction. 7 th ed. Thomson Learning, Inc: United States of America. http: //wine 1. sb. fsu. edu/chm 1045/notes/Aque ous/Stoich/Aqua 02. htm www. psigate. ac. uk/newsite/ reference/plambeck/chem 1/p 01173. htm http: //www 2. hmc. edu/~karukstis/chem 21 f 20 01/tutorials/tutorial. Stoichi. Frame. html