Chapter 8 AcidBase Titrations Neutralization Titrations Titrations Curves

Chapter 8 Acid-Base Titrations (Neutralization Titrations

Titrations Curves for Strong Acids and Strong Bases. • Strong acids and strong bases ionize with 100% efficiency in aqueous solution. • HA + H 2 O ----> H 3 O+ + A- • MOH ----> M+ + OH • The net reaction of strong acids with strong bases is the reaction of a hydronium ion with a hydroxide ion to form water. H 3 O+ + OH- ----> H 2 O • Titration curves of strong acids with strong bases are divided into domains: 1. Before equivalence. 2. At equivalence. 3. After equivalence.

Before equivalence: 1. Initially, before any base is added to the acid sample, the [H 3 O+]total = CHA + [H 3 O+]water. 2. If the CHA is greater than 10 -6 M, the [H 3 O+]water can be ignored. 3. As strong base is added but prior to equivalence, [H 3 O+] is consumed. The remaining [H 3 O+] is calculated as follows

At equivalence point • The acid and base have reacted at the stoichiometric ratio. 2. The [H 3 O+] = [OH-] = M 3. The p. H = 7 at equivalence.

Beyond equivalence: 1. All the acid is consumed; only base is present. 2. The amount of base is calculated from the excess added beyond equivalence.

• Note that: • If CAcid is greater than 10 -6 M, we have assumed that the water contribution to the hydronium ion concentration can be ignored. • If CAcid is less than 10 -8 M, you can also assume that the water is primarily responsible for the hydronium ion concentration, and that the added acid is insignificant. • Only when the CAcid is between 10 -8 - 10 -6 M must the water contribution to the hydronium ion concentration be considered.

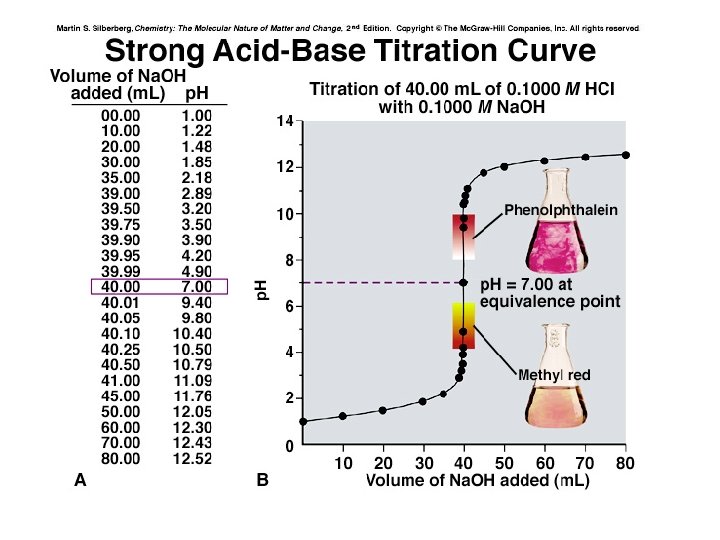
Strong Acid and Strong Base • The following figure shows the titration of a strong acid with 0. 100 M Na. OH. • For titration of a strong acid with a strong base, the equivalence point occurs at a p. H of 7.

• We can identify three different regions in this titration experiment. • Before the equivalence point the p. H is determined by the concentration of unneutralized strong acid. • At the equivalence point the p. H, 7, is determined by the dissociation of water. • After the equivalence point the p. H is determined by the concentration of excess strong base that we are adding.
 are weak")
Detection of the end-point: Acid-Base Indicators • Acid-base indicators (p. H indicators) are weak organic acids or weak organic bases that change color as a function of ionization state. • Acid-base indicators of two types have different ionization equilibria: 1. Acid-type indicators: 2. Base-type indicators: • As the p. H changes, each equilibrium above shifts in response, producing a color change.

• Human visual only responds to dramatic color changes. Changes of less than 10% usually are not visible, • Thus, the molar concentrations of the indicator species must constitute approximately 90% of the indicator before the color changes are seen clearly. – To see the In- color: -To see the HIn color: Only the color of unionized form is seen Only the color of ionized form is seen
 are 50% ionized at")
• • – Acid-base indicators (like any ionizable molecule) are 50% ionized at the p. Ka – At 1 p. H unit above the p. Ka, 90% of the ionizable indicator is in its basic form. – At 1 p. H unit below the p. Ka, 90% of the ionizable indicator is in its acid form. – Thus, indicators show a full color transition +/- 1 p. H unit of the p. Ka, and indicators are generally selected based upon the closeness of their p. Ka to the endpoint p. H. Most indicators require a transition range of about 2 p. H units During the transition the observed color is a mixture of the two colors Midway of the transition the concnetration of the two forms are equal pka of indicator should be close to the p. H of the equivalence point
. •")
Variable affecting acid-base indicator behavior include • Ionic strength (changes Ka, shifts equilibrium). • Temperature. • Solvent and solvent polarity (especially organic solvents which may shift color transitions several p. H units). • Colloidal particulates may interfere through surface adsorption of the indicator Choosing acid-base indicators for strong acid-strong base titration • If concentrations of acid and base are 0. 1 M or higher, it doesn't make much difference. The large endpoint transition spans the color transition range of almost all indicators. • If concentrations drop significantly below 0. 1 M, an indicator whose p. Ka is as close as possible to p. H 7. 0 +/- 1 is best. • If concentrations of acid and base drop too low, (i. e. , the endpoint transition spans less than two p. H units), no indicator will work very well.

Acid base indicators • In an acid-base titration, addition of titrant near the equivalence point causes the solution p. H to change drastically. • This p. H change is detectable with indicators that change color as a function of p. H. • Indicators are weak acids that change color when they gain or lose their acidic proton(s).

• The table lists a few common indicators with the color of their acidic and basic forms and the p. H range over which the color change occurs. (The listed endpoint color assumes titration of an acid with base, i. e. , increasing p. H. )

Color Indicator p. H Range acidic endpoint basic bromocresol green yellow green blue 4. 0 -5. 6 methyl red yellow 4. 4 -6. 2 bromothymol blue yellow green blue 6. 2 -7. 6 phenolpthalein colorless light pink red 8. 0 -10

Titration Curves for Weak Acids Titrated with a Strong Base • • Acetic Acid Titrated with Na. OH Acetic acid is a monoprotic acid (p. Ka = 4. 757). Na. OH is a monohydroxy, strong base. Titration of acetic acid with Na. OH follows a curve similar in shape to the strong acidstrong base titration curve, but the equivalence point is not a p. H 7. • Shown below is a titration curve for 0. 100 M acetic acid titrated with 0. 100 M Na. OH.
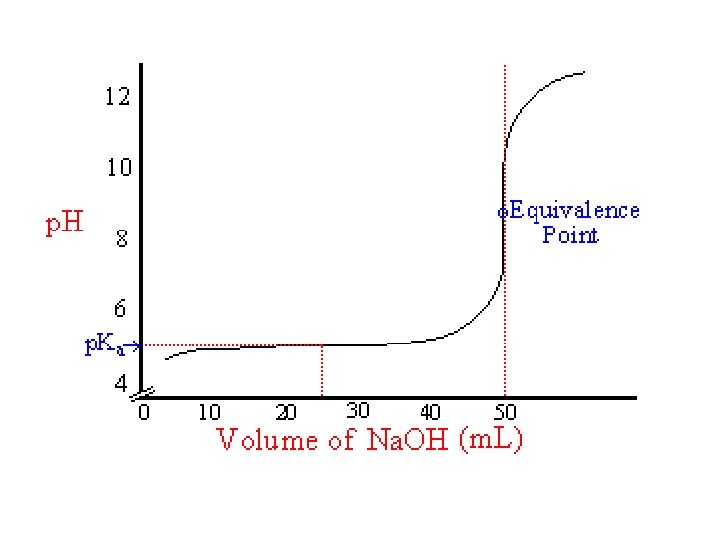


• During the titration and in the generation of a titration curve, four regions will be considered: – No Na. OH added (i. e. , 0. 100 F acetic acid). – Na. OH added, but before equivalence has been reached. – At the equivalence point (i. e. , 0. 100 F acetate ion). – After equivalence.

TITRATION OF A WEAK ACID WITH A STRONG BASE
![1. No Na. OH added • [H 3 O+] is calculated from the Ka](http://slidetodoc.com/presentation_image_h/d6a2deb16c78798baf343fb4496928b4/image-22.jpg "1. No Na. OH added • [H 3 O+] is calculated from the Ka")
1. No Na. OH added • [H 3 O+] is calculated from the Ka of acetic acid. • If X is not << CHAc, the quadratic formula must be used to solve for X.

2. Na. OH added, but before equivalence • Added Na. OH reacts with HAc producing a buffer (a mixture of HAc and Ac-). • The concentrations of HAc and Ac are calculated from the volumes reacted and substituted into the Ka (or Henderson. Hasselbalch equation) to calculate [H 3 O+] and p. H.

• In using these equations, check the assumptions made that allow use of Ka or the Henderson. Hasselbalch. They are: – Water equilibrium contributions are negligible. – CNa. Ac and CHAc >> [H 3 O+] and [OH-] • If the assumptions do not check, use the Charlot equation.

3. At equivalence point • At equivalence point, the HAc and Na. OH have reacted at the stoichiometric ratio. # moles HAc initially present = # moles Na. OH added • The solution at the equivalence point is identical to dissolving sodium acetate (Na. Ac) in water. The [H 3 O+] may be calculated from the base hydrolysis of Ac-. • Note that X is assumed to be << CNa. Ac. This assumption must be checked. • If the assumption is not true, the quadratic formula must be used to solve for X.

4. Beyond equivalence • Beyond equivalence, all the HAc is consumed and the presence of excess OH- prevents the base hydrolysis of of the Ac-. • The concentration of the excess OH- is calculated from the reacted volumes and used to calculate [H 3 O+] and p. H.

General characteristics of weak acid titrations with strong bases • If the concentrations of acid are too low, you cannot ignore the water contributions to [H 3 O+] and [OH-]. • Low acid concentrations decrease the magnitude of the p. H change at the equivalence point, limiting the selection of endpoint indicator. Conversely, the higher the acid concentrations, the larger the p. H change around the equivalence point. • As Ka gets smaller, the p. H change at equivalence gets smaller. Generally, the smaller Ka gets, the more concentrated the solutions must be. Acids with Ka below 10 -6 -10 -7 M are nearly impossible to titrate easily with a buret and typically endpoint indicator.

Titration Curves for Weak Bases Titrated with a Strong Acid. • Titrations of weak bases with strong acids are "mirror images" of the weak acid titrations already discusses. • Shown below is a typical titration curve:
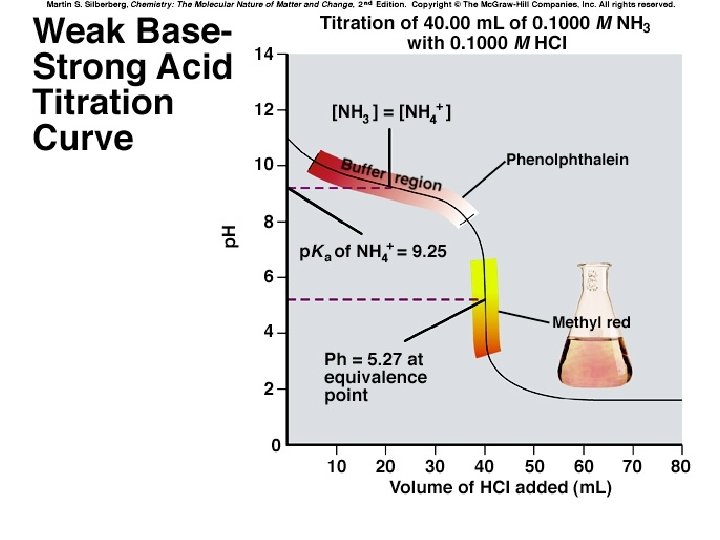

• For the sake of discussion, assume cyanide ion, CN- from Na. CN, is being titrated with HCl. • The titration curve is divided into regions similar to the acid titrations: – No HCl added. – HCl added, but before equivalence. – At equivalence. – After equivalence.

TITRATION OF A WEAK BASE WITH A STRONG ACID • Where is the equivalence point?
![1. No HCl added region • [OH-] is calculated from the Kb expression. •](http://slidetodoc.com/presentation_image_h/d6a2deb16c78798baf343fb4496928b4/image-32.jpg "1. No HCl added region • [OH-] is calculated from the Kb expression. •")
1. No HCl added region • [OH-] is calculated from the Kb expression. • Once [OH-] is calculated, [H 3 O+] and p. H is calculated

2. HCl added, but before the equivalence point • The solution is a buffer consisting of HCN and CN-. • The concentration of each species is calculated from the added volumes and substituted into the Henderson. Hasselbalch equation (or Ka for HCN). • Note, again, that assumptions are made about ignoring water's contributions to [OH-] and [H 3 O+]. These assumptions must be checked. • Also, it is assumed that [OH-] and [H 3 O+] are << CNa. CN and CHCN. This also must be checked.

3. At the equivalence point : • All the CN- has been converted to HCN. The solution is the same as an HCN solution. • Note, the same sets of assumptions to be checked.

4. After the equivalence point • The p. H is determined by the amount of acid added in excess to the amount of CN- initially present. • Note, yet again, the same sets of assumptions to be checked.

< TARGET="display">
- Slides: 36