Requirements Engineering The process of eliciting analyzing documenting


 • Is a quality management technique that translates the needs")


 – shows relationships among system objects. • Functional model")

 – contains the descriptions of all data")
 – indicates how the system behaves")


 * (c + a * d)")

")


 • State transition diagrams represent the system states and events that")


")
 before they are passed on")


 • SQA is a collection of activities during software development")


 is a")


- Slides: 118
Requirements Engineering • The process of eliciting, analyzing, documenting, and validating the services required of a system and the constraints under which it will be developed and operated. • Descriptions of these services and constraints are the requirements for the system. • Requirements may be high-level and abstract, or detailed and mathematical. (or somewhere in between)
Requirements Engineering The hardest single part of building a software system is deciding precisely what to build. No other part of the conceptual work is as difficult… No other part of the work so cripples the resulting system if done wrong. No other part is more difficult to rectify later. – Fred Brooks, “No Silver Bullet…”
RE Includes • Discovery/Identification. • Refinement/Analysis: Identify inconsistencies, omissions, defects etc. • Modeling: Functional (DFD), Behavioral (STD), Informational (DD), Other. • Specifications (SRS Document). • Without well documented SRS – Developers do not know what to build. – Customers do not know what to expect. – No way to validate whether build system satisfies the requirements.
Requirements Engineering Process
SRS must delineate • • • Inputs. Outputs. Functional Requirements. Non-functional Requirements. SRS should be/have – – Internally consistent. Consistent with existing documents. Correct & complete w. r. t. satisfying customer needs. Understandable to the users, customers, designers, & testers. – Capable of serving as a base for design & test.
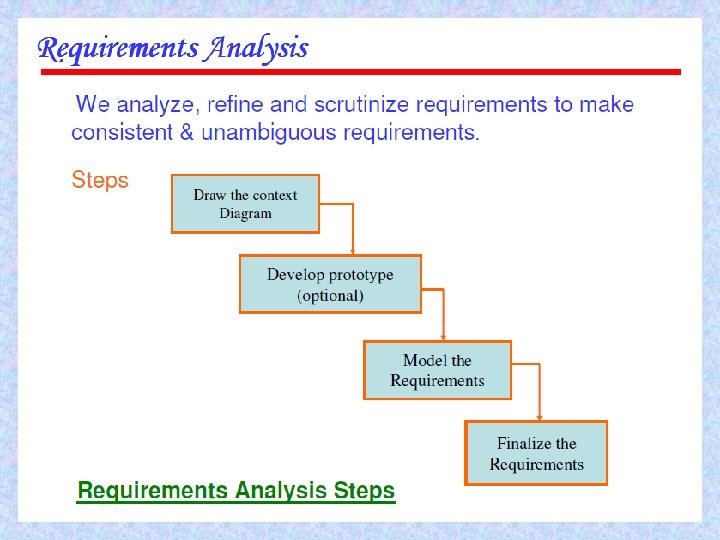
Requirements Analysis • Software engineering task that bridges the gap between system requirements engineering and software design. • Provides software designer with a model of – system information – function – behavior • Model can be translated to data, architectural, and component-level designs. • Expect to do a little bit of design during analysis and a little bit of analysis during design.
Software Requirements Analysis Phases • Problem recognition. • Evaluation and synthesis: focus is on what not how. • Modeling. • Specification. • Review.
Feasibility Study • Economic feasibility – cost/benefit analysis • Technical feasibility – hardware/software/people, etc. • Legal feasibility • Alternatives – there is always more than one way to do it.
Requirements • Requirements – features of system or system functions used to fulfill system purpose. • Focus on customer’s needs and problem, not on solutions. – Requirements definition document. (written for customer). – Requirements specification document. (written for programmer; technical staff).
Types of Requirements • Functional requirements: – input/output – processing. – error handling. • Non-functional requirements: – – – – – Physical environment (equipment locations, multiple sites, etc. ). Interfaces (data medium etc. ). User & human factors (who are the users, their skill level etc. ). Performance (how well is system functioning). Documentation. Data (qualitative stuff). Resources (finding, physical space). Security (backup, firewall). Quality assurance (max. down time, MTBF, etc. ).
Requirement Validation • • Correct? Consistent? Complete? Each requirement describes something actually needed by the customer. • Requirements are verifiable (testable) ? • Requirements are traceable.
Requirements Definition Document • • General purpose of document. System background and objectives. Description of approach. Detailed characteristics of proposed system (data & functionality). • Description of operating environment.
Software Requirement Elicitation • Most difficult, critical, error-prone, and communication intensive aspect of s/w development. • Requirements actually reside in the minds of the users. • Developers and users have different mind set, expertise, and vocabularies. • Communication gap between customers and developers may lead to inconsistencies, misunderstanding and omissions of requirements. • Customers have solid background in their domain but have a little knowledge of s/w development process. • Developers have experience of developing s/w but have little knowledge of everyday environment of the customer.
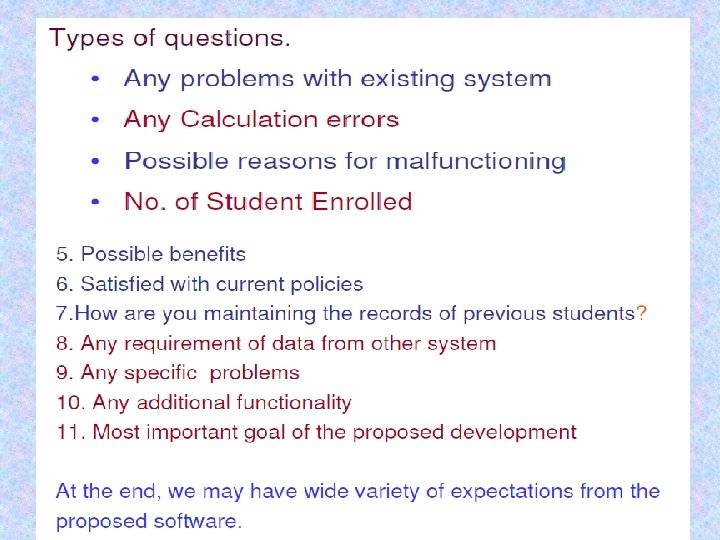
Software Requirements Elicitation Techniques • Customer meetings are the most commonly used technique. • Meetings/Interviews may be open ended or structured. • Use context free questions to find out – customer's goals and benefits – identify stakeholders – gain understanding of problem – determine customer reactions to proposed solutions – assess meeting effectiveness • Interview cross section of users when many users are anticipated.
Interviews
Brainstorming
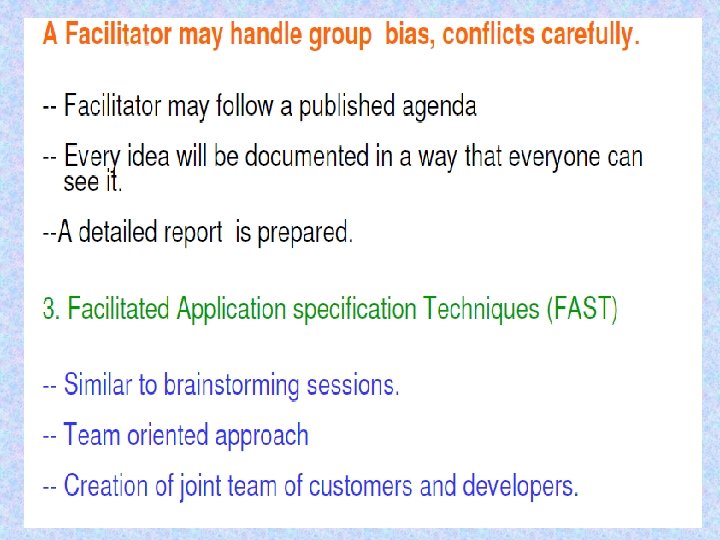
F. A. S. T. - 1 • Facilitated application specification technique • Meeting between customers and developers at a neutral site (no home advantage). • Goals – identify the problem – propose elements of solution – negotiate different approaches – specify preliminary set of requirements
F. A. S. T. - 2 • Rules for participation and preparation established ahead of time. • Agenda suggested – brainstorming encouraged • Facilitator appointed. • Definition mechanism – sheets, flipcharts, wallboards, stickers, etc.
F. A. S. T. -3 • Each FAST attendee is asked to prepare a list of objects that are part of environment that surrounds the system, produced by the system, used by the system. • Every attendee is asked to make a list of services (processes or functions that manipulate or interact with the objects) and a list of constraints (cost, size) & performance criteria (speed, accuracy, response etc. )
F. A. S. T. - 4 • Each attendee presents the list of objects, services, constraints & performance. • Prepare the common list. • Discuss the common list & prepare a consensus list. • Divide the whole team into sub-teams to prepare mini specs. for one or more entries of the list. • Present the mini specs. Addition/deletion is permitted. • Create a list of validation criteria. • Designate a team to write complete draft specs.
Quality Function Deployment (QFD) • Is a quality management technique that translates the needs of the customer into technical requirements. • Concentrates on maximizing customer satisfaction. • Emphasizes on what is valuable to the customers and then deploys these values during SE process. • QFD generally identifies three types of requirements.
QFD • Customer’s needs imply technical requirements: – Normal requirements: If these requirements are present the customer is satisfied (minimal functional & performance). – Expected requirements: These are implicit and so fundamental in nature that customer does not explicitly states them (important implicit requirements, i. e. ease of use, learn, and operate). – Exciting requirements: Beyond the customers expectation (may become normal requirements in the future, highly prized & valued).
Q. F. D. • Function Deployment: – Determines value of required function. • Information Deployment: – Focuses on data objects and events produced or consumed by the system. • Task Deployment: – product behavior and implied operating environment.
QFD
Q. F. D. • Value Analysis makes use of – – Customer interviews. Observations. Surveys. Historical data. • to create – Customer Voice Table (Table of requirements). – extract expected requirements – derive exciting requirements
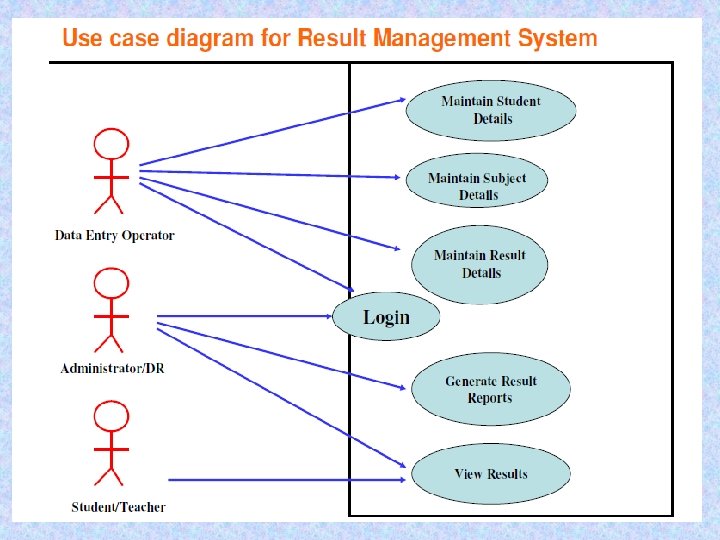
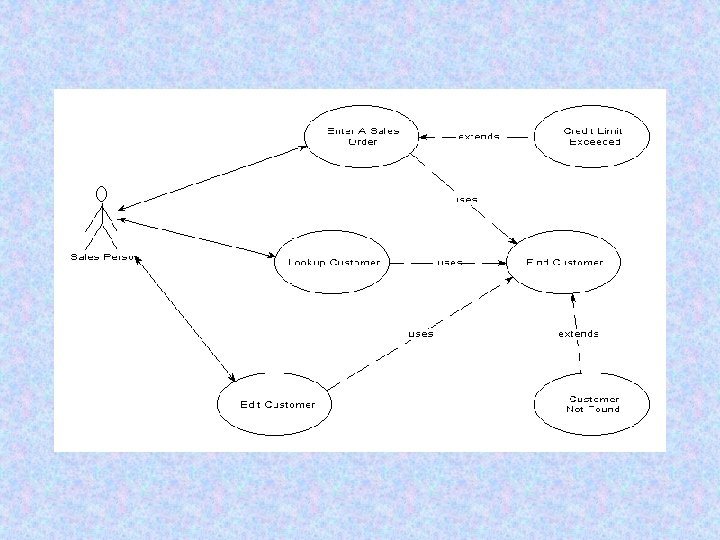
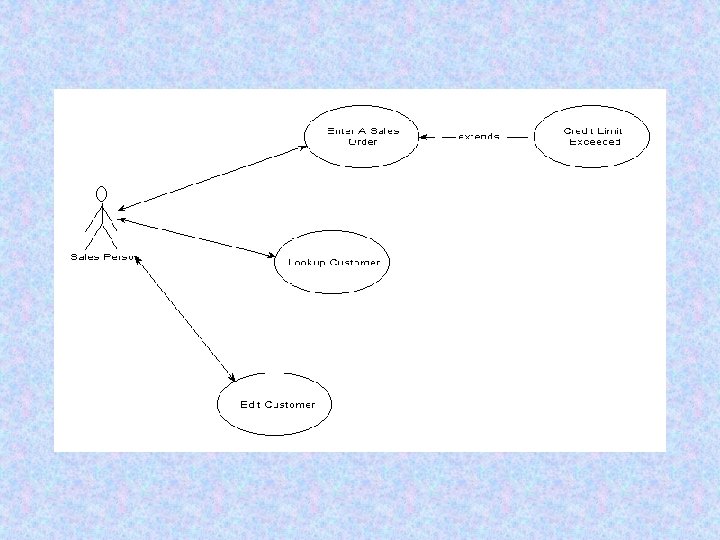
Use Case Diagrams • Scenarios that describe how the product will be used in specific situations. • Use cases capture who (actor) does what (interaction) with the system, for what purpose (goal), without dealing with system internals. • Written narratives that describe the role of an actor (user or device) as it interacts with the system. • Use-cases designed from the actor's (End user) point of view. • Not all actors can be identified during the first iteration of requirements elicitation. • But it is important to identify the primary actors before developing the use-cases.
Use Case Diagrams
Use Case Diagrams
Use Case Diagrams
Use Case Diagrams
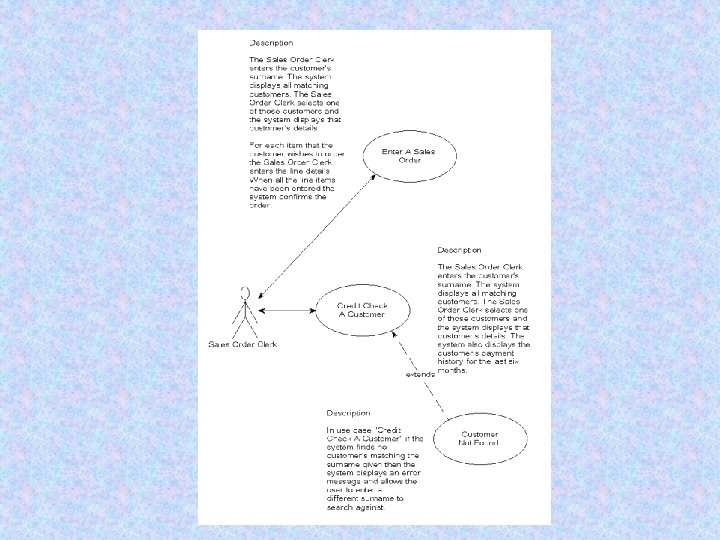
Use Case Template • Brief Description: Background • Actors that interact with the use case • Flow of events – Basic: Primary events that occur when use case is executed. – Alternative: Any subsidiary events that occur in use case. • Preconditions • Post conditions • Special Requirements : Business rules for the basic and alternative flows should be listed as special requirements. Both success and failure scenarios should be described. • Extension Points
Use Case Template
Use Case Template
Use Case Guidelines
Use Case Conventions
Use Case Conventions
Use Case Description ------- User Name, Role, Password
Use Case Description
Use Case Description
Information Domain • Encompasses all data objects that contain numbers, text, images, audio, or video. • Information content or data model (ERD) – shows the relationships among the data and control objects that make up the system. • Information flow (DFD) – represents manner in which data and control objects change as each moves through system. • Information structure – representations of the internal organizations of various data and control items (DD).
Modeling • Data model (ERD) – shows relationships among system objects. • Functional model (DFD) – description of the functions that enable the transformations of system objects. • Behavioral model (STD) – manner in which software responds to events from the outside world.
Analysis Model Objectives • Describe what the customer requires. • Establish a basis for the creation of a software design. • Devise a set of requirements that can be validated once the software is built.
Analysis Model Elements • Data Dictionary (DD) – contains the descriptions of all data objects consumed or produced by the software. • Entity Relationship Diagram (ERD) – depicts relationships between data objects. • Data Flow Diagram (DFD) – provides an indication of how data are transformed as they move through the system; also depicts functions that transform the data flow – a function is represented in a DFD using a process specification or PSPEC
Analysis Model Elements • State Transition Diagram (STD) – indicates how the system behaves as a consequence of external events. – states are used to represent behavior modes. – arcs are labeled with the events triggering the transitions from one state to another. – control information is contained in control specification or CSPEC.
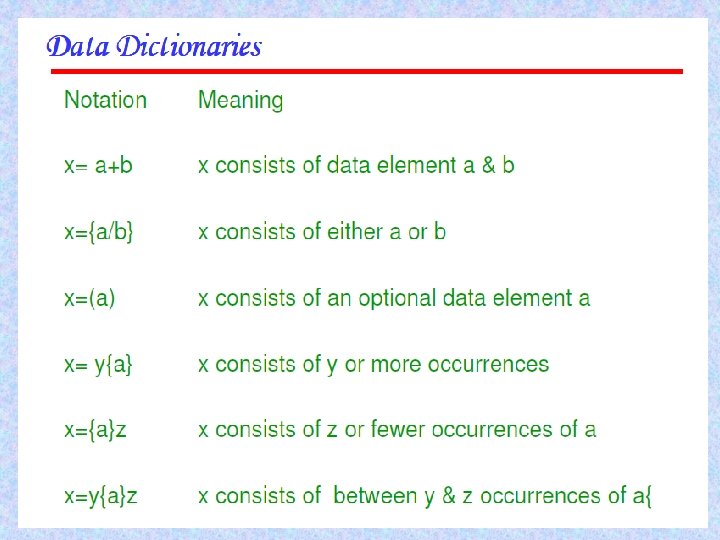
Data Dictionary DD are repositories to store information about all data items defined in DFD. Entities are • Name: Primary name for each data or control item, data store, or external entity • Alias: Alternate names for each data object • Where/How used : Listing of processes that use the data or control item and how it is used • • input to process output from process as a store as an external entity • Content Description: Notations to represent content • Supplementary information: Other data type information, preset values, restrictions, limitations, etc.
Example • name: telephone number • aliases: none • where used/how used: dial phone (input) assess against set−up (output) • description: telephone number = [local number | long distance number] local number = prefix + access number long distance number = 1 + area code + local number area code = [800 | 888 | 561] prefix = *a three digit number that never starts with 0 or 1* access number = *any four digit string*
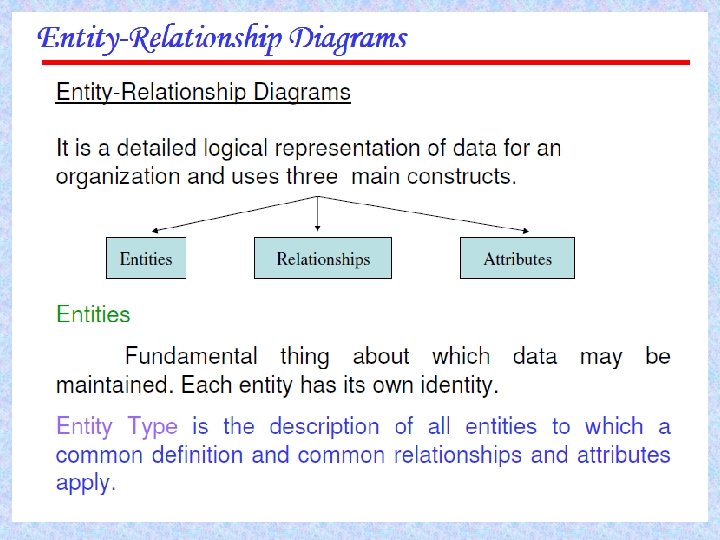
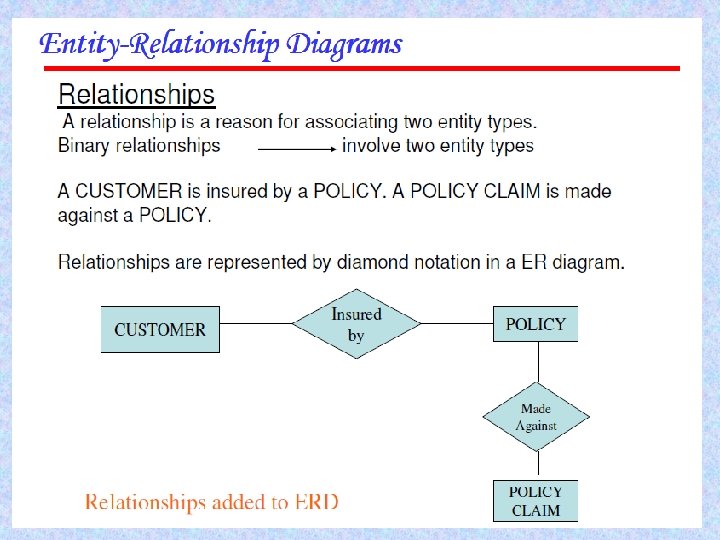
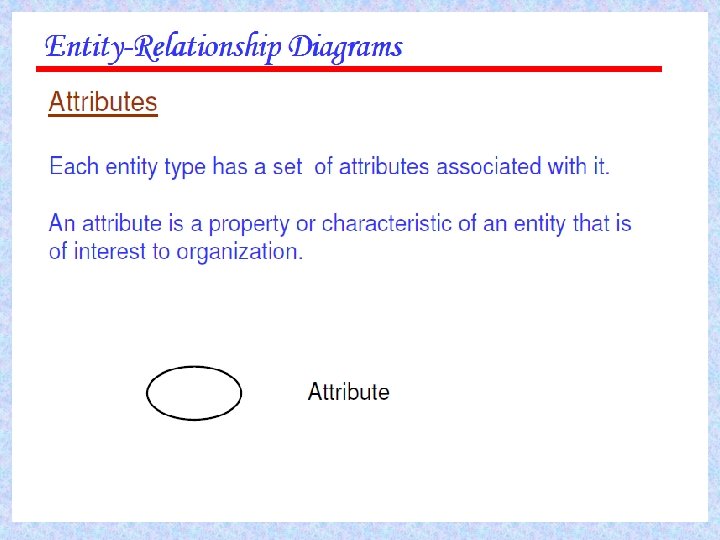
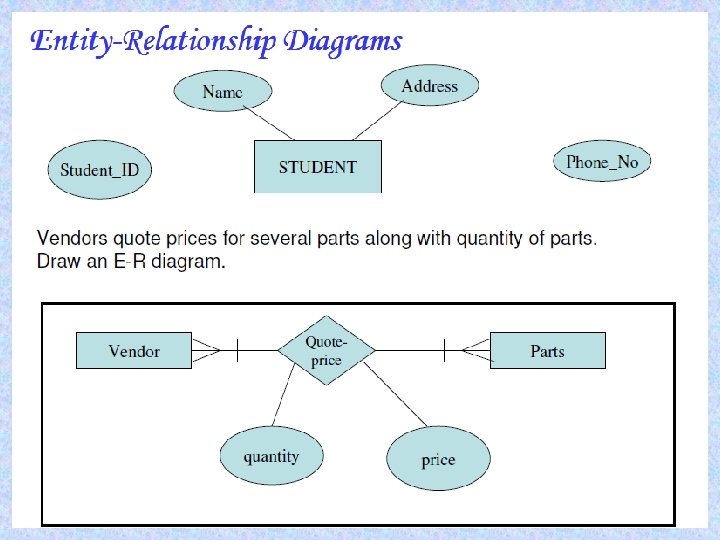
ERD Elements • Data object/Entity – any person, organization, device, or software product that produces or consumes information • Attributes – name a data object instance, describe its characteristics, or make reference to another data object • Relationships – indicate the manner in which data objects are connected to one another
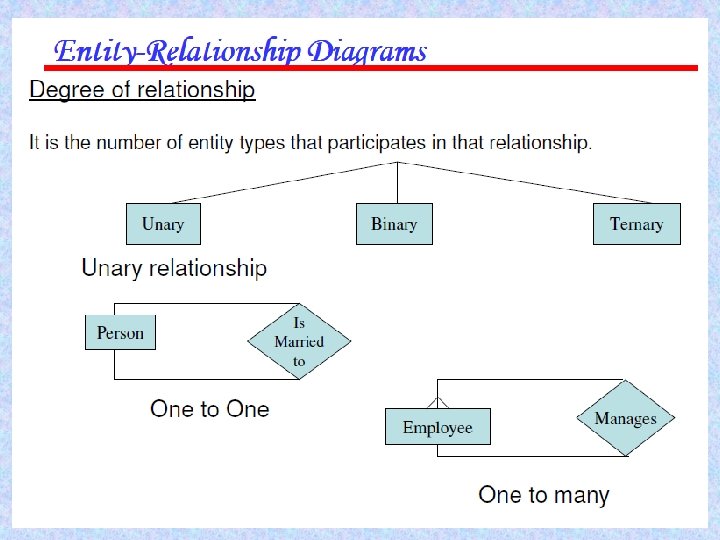
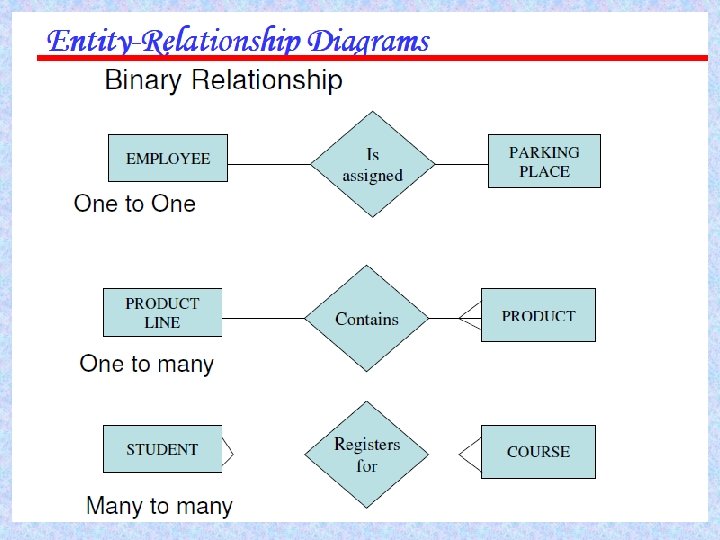
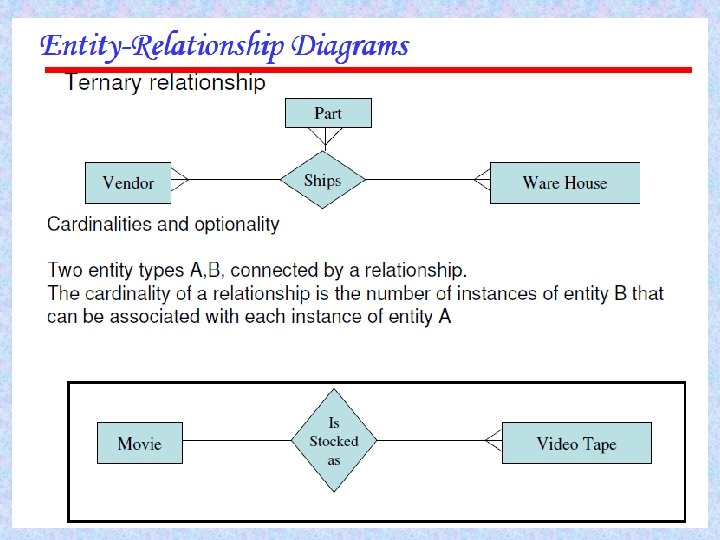
Cardinality and Modality • Degree: Refers to the number of entities participating in the relationship. • Cardinality – in data modeling, cardinality specifies how the number of occurrences of one object are related to the number of occurrences of another object (1: 1, 1: N, M: N) • Modality – zero (0) for an optional object relationship – one (1) for a mandatory relationship
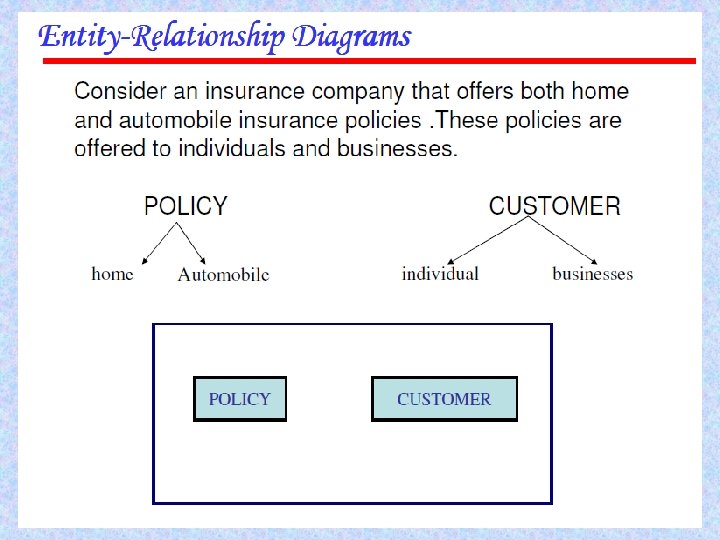
Creating ER Diagrams • Customer is asked to list "things" that application addresses. • These things evolve into input objects, output objects, and external entities. • Analyst and customer define connections among the objects. • One or more object-relationship pairs is created for each connection. • Cardinality and modality are determined for an object-relationship pair. • Attributes of each entity are defined. • ERD is reviewed and refined.
Functional Modeling DFD • Shows the relationships among external entities, process or transforms, data items and data stores. • DFD’s only show the flow of data through the software system and can’t show procedural details like conditionals or loops. • Refinement from one DFD level to the next should follow approx. 1: 5 ratio. • This ratio will reduce as the refinement proceeds. • To model real-time systems, structured analysis notation must be available for time continuous data and event processing.
Creating DFD • Level 0 DFD should depict the system as a single bubble with Primary input and output. • Refinement should begin by consolidating candidate processes, data objects and data stores to be represented at the next level. • Label all arrows with meaningful names. • Information flow must be maintained from one level to the other. • Refine/explore one bubble at a time. • Write PSPEC for each bubble in the final DFD.
Dataflow Diagram Rectangle = information producer or consumer Oval = software element that transforms information Arrow = direction of data item flow information repository (not shown)
Graphical Notation – bubbles represent functions – arcs represent data flows – open boxes represent persistent store – closed boxes represent I/O interaction
Example specifies evaluation of (a + b) * (c + a * d)
A Construction “Method” 1. Start from the “context” diagram
A Construction “Method” 2. Proceed by refinements until you reach “elementary” functions (preserve balancing)
A Library Example
Refinement of “Get a book”
Patient monitoring systems The purpose is to monitor the patients’ vital factors--blood, pressure, temperature, …--reading them at specified frequencies from analog devices and storing readings in a DB. If readings fall outside the range specified for patient or device fails an alarm must be sent to a nurse. The system also provides reports.
A refinement
More refinement
Behavioral Modeling (STD) • State transition diagrams represent the system states and events that trigger state transitions. • STD's indicate actions taken as consequence of a particular event. • A state is any observable mode of behavior • Control Flow Diagrams (CFD) can also be used for behavioral modeling.
State Transition Diagram
STD Elements • • • STD = { S, I, F, S 0, } Set of machine states S S 0 S start state F S set of final state(s) I: set of input symbols Transition function (Si , Ij) Sj
Example: a lamp
FSMs as recognizers
STD of Washing Machine Idle Stop/Enable Filling Stop/Disable Washing Spin-dry done/Disable Spin-dry Washer Filled/Enable Washing Over/Enable Spin-dry
Elements of Analysis Model l t a m t c e j b on i t rip sc e D ERD -o a t a Data Dictionary tro l al or vi ha Be Co n STD Sp ec el od M ific ati on s DFD Functional Model D Process Specifications Da n I / ta r fo M n io e d o
Decision Table • Notation that translates complex combination of conditions and corresponding actions into tabular form. • It consists of condition stubs, condition rules and action stubs, action rules. Rules Condition Stubs 1 2 Action Stubs 1 2
Example Condition Stubs Condition Rules N not numeric T F F F N <= 1 - T F F N legal - - T F N prime - - T F Action Stubs Action Rules Print “N prime” X Print “N not prime” Print error message X X X Print “Good bye” Input new value for N Stop X X X
SRS Document Format • INTRODUCTION – System Reference – Overall Description – Software Project Constraints • INFORMATION DESCRIPTION – Information Flow Representation • Data Flow • Control Flow – Information Content Representation (DD) – System Interface Description
SRS Document Format • FUNCTIONAL DESCRIPTION – Functional Partitioning – Functional Description • Process Narrative • Restrictions/Limitations • Performance Requirements • Design Constraints • Supporting Diagrams
SRS Document Format • CONTROL DESCRIPTION – Control Specifications – Design Constraints • BEHAVIORAL DESCRIPTION – System States – Events and Actions • VALIDATION CRITERIA – – Performance Bounds Classes of Tests Expected Software Response Special Considerations • BIBLIOGRAPHY and APPENDIX
Software Quality Ø The narrowest sense of product quality is commonly recognized as lack of “bugs” in the product. Ø This definition is usually expressed in two ways: § defect rate (Number of defects per millions of lines of source codes, per function point, or other units) § Reliability (Probability of failure-free operation in a specified time and environment).
Software Quality Ø In addition to overall customer satisfaction with software product, satisfaction towards specific attributes is also measured. Ø IBM monitors the CUPRIMDSO (capability, usability, performance, reliability, installability, maintainability, documentation /information, service, and overall) Ø HP focuses on FURPS (Functionality, usability, reliability, performance, and serviceability).
Defining Software Quality • Two definitions of the quality, which are consistent and have been adopted & used – Quality is conformance to requirements – Quality is fitness to use • Because of the two perspectives of quality the de facto definition of quality consists of two levels. • The first is the intrinsic product quality, often operationally limited to product defect rate and reliability. This narrow definition is referred to as the “small q” (Lack of bugs) • The broader level of the definition of quality includes product quality, process quality, customer satisfaction, etc. and it is referred to as “big Q
Quality Concepts - 1 • Variation control is the heart of quality control • Software engineers strive to control the – process applied – resources expended – end product quality attributes • Quality of design – refers to characteristics designers specify for the end product to be constructed. • Quality of conformance – degree to which design specifications are followed in manufacturing the product.
Quality Concepts - 2 • Quality control – series of inspections, reviews, and tests used to ensure conformance of a work product to its specifications. • Quality assurance – auditing and reporting procedures used to provide management with data needed to make proactive decisions.
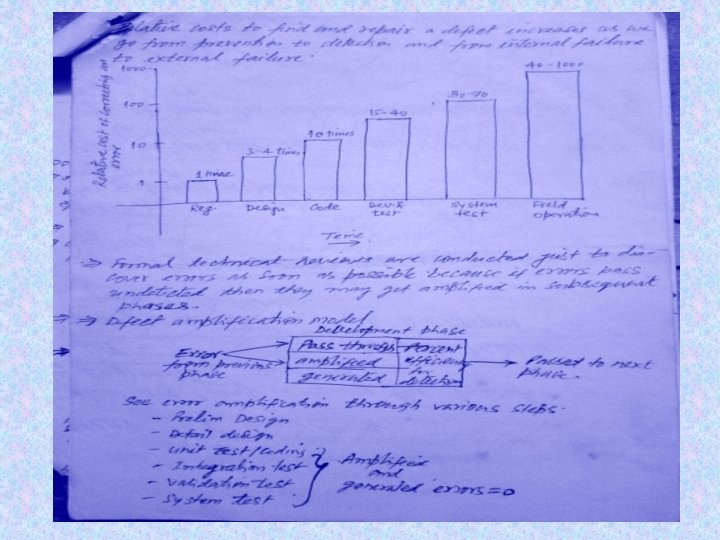
Quality Costs • Prevention cost – quality planning, formal technical reviews, test equipment, training. • Appraisal cost – in-process and inter-process inspection, equipment calibration and maintenance, testing. • Failure cost – rework, repair, failure mode analysis. • External failure cost – complaint resolution, product return and replacement, help line support, warranty work.
Schematic Diagram of Quality Assessment Ø Identifying quality attributes, quality carrying properties, quality metrics, and defining mapping that connects these aspects by relating them together. Identify Quality Attributes Total Quality Index Select Quality Properties Select Quality Metrics
Software Quality Metrics Ø Factors assessing software quality come from three distinct points of view (product operation, product revision, product modification). Ø Defect removal efficiency (DRE) is a measure of the filtering ability of the quality assurance and control activities as they are applied through out the process framework. DRE = E / (E + D). E = # of errors found before delivery D = # of errors found after delivery
Software Quality Metrics Ø Software quality factors requiring measures: § correctness (defects per KLOC) § maintainability § mean time to change (MTTC) § spoilage = (cost of change / total cost of system) § integrity threat = probability of attack (that causes failure) security = probability that the attack is repelled Integrity = [1 - threat * (1 - security)]
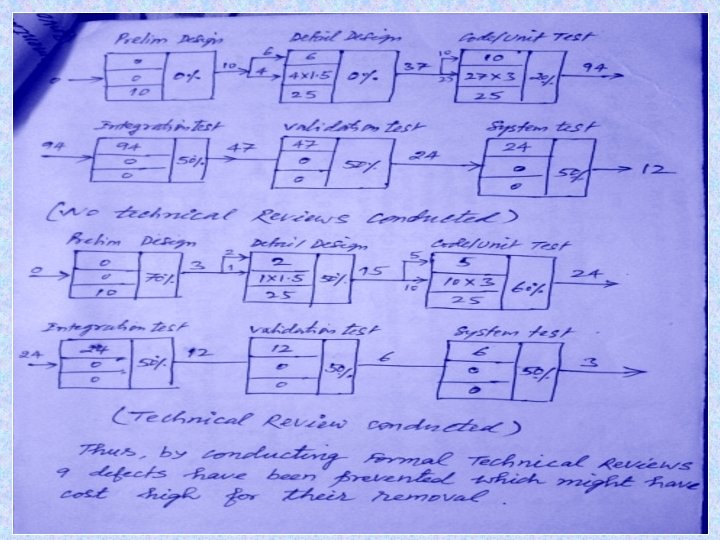
Software Reviews Ø Purpose is to find defects (errors) before they are passed on to another software engineering activity or released to the customer. Ø Software engineers (and others) conduct formal technical reviews (FTR). Ø Using formal technical reviews (walkthroughs, Deskchecks, Code Review or inspections) is an effective means for improving software quality.
Why do Peer Reviews? Ø To improve quality. Ø Catches 80% of all errors if done properly. Ø Catches both coding errors and design errors. Ø Enforce the spirit of any organization standards. Ø Training and insurance.
Defect Prevention/ Removal • • • S/w contains 200 K lines Inspection time = 7053 Hrs. Defects prevented = 3112 Programmer cost = 40. 00 per hr. Total cost of defect prevention = 7053 x 40. 00 = 282120. 00 • Cost per defect prevention = 282120/3112 = 91. 00
Defect Removal • Defect escaped into product = 1 per 1 K • Total defects escaped = 200 K/1000 = 200 • Cost of removal of single defect = 25000 • Total defect removal cost = 25000 x 200 = 5000000 • Ratio of defect removal to prevention = 18
Software Quality Assurance (SQA) • SQA is a collection of activities during software development that focus on increasing the quality of the software being produced • SQA is often conducted by an independent group in the organization • Often this group has the final veto over the release of a software product
SQA includes • Analysis, design, coding and testing methods and tools. • Formal Technical reviews during software development. • A multi-tiered testing strategy. • Control of software documentation and the changes made to it. • Procedures to ensure compliance with software development standards. • Software measurement and reporting mechanisms.
Statistical Quality Assurance • Information about software defects is collected and categorized. • Each defect is traced back to its cause • Using the Pareto principle (80% of the defects can be traced to 20% of the causes) isolate the "vital few" defect causes. • Move to correct the problems that caused the defects.
Phase wise Statistics of Errors Error Causes Total # % Serious # % Moderate # % IES MCC n 1 n 2 n 11 n 21 n 12 n 22 MIS p 1 p 2 n 12 p 12 Ei p 11 p 21 n 121 p 121 n 122 Si Mi Ei: Total number of errors p 12 p 22 Minor # % n 13 n 23 p 13 p 23 p 122 n 123 p 123 Ti Si: Number of serious errors Mi: Number of moderate errors Ti: Number of minor errors
Quality Indicator • S: Size of the product • Weighing factors Ws=10, Wm=3, Wt=1 are assigned to serious, moderate and minor errors respectively • Phase Index for ith phase (PIi) is PIi = Ws(Si/Ei)+Wm(Mi/Ei)+Wt(Ti/Ei) • Error Index (EI) is calculated by assigning weights to different phases (Wi) EI = Sum(Wi*PIi)/S • Error index acts as an indicator for the quality of the software
ISO 9126 Standard • Another product oriented attempt to define software quality attributes. • A user view of software quality. • Defines certain quality characteristics. • ISO 9126 doesn’t address software process issues.
ISO 9000 • A set of quality standards developed so that purchasers of goods can have confidence that suppliers have produced something of acceptable quality. • ISO 9000 certification has become a widely required international standard. • Any supplier who is not ISO 9000 certified will find it difficult to sell their goods. • The ISO 9000 -3 standard describes how to apply the general ISO 9000 standard to the software industry. • The ISO standard addresses design, development, production, installation and maintenance issues. • The emphasis in the ISO standard is on documentation of the process and the managing of the process.
ISO 9001 Components 1. Management responsibility 2. Quality system 3. Contract review 4. Design control 5. Document and data control 6. Purchasing 7. Control of customer-supplied 8. Product identification 9. Process control 10. Inspection and testing
ISO 9001 Components 11. Control of inspection, measuring, test equipment 12. Inspection and test status 13. Control of non-conforming product 14. Corrective and preventive action 15. Handling, storage, packaging, preservation, delivery 16. Control of Quality records 17. Internal Quality Audits product 18. Training and traceability 19. Servicing 20. Statistical techniques
ISO 9000 Registration • The effort required to obtain ISO 9000 registration varies directly with how closely an organization’s process fits the ISO 9000 model. • ISO 9000 registration is granted when an accredited inspection organization certifies that the organization’s practices conform to the ISO standard. • Re-registration is required every 3 years and surveillance audits are performed every 6 months. • ISO registration can cost a lot of time, effort and money to achieve. It requires continuing effort to stay registered.
A Cynic’s View of ISO 9000 • ISO 9000 focuses on how well the processes are documented, not on the quality of the process. • Many companies do the minimum required to achieve ISO 9000 for business reasons, but forget about it as soon as the ISO 9000 inspectors have signed off. • ISO 9000 is based on the faulty premise that work is best controlled by specifying and controlling procedures. • Your product and the processes used to produce it can be absolutely terrible but you can get ISO 9000 as long as the processes are well documented.
The SEI’s Capability Maturity Model The Capability Maturity Model for Software (CMM) is a five level model laying out a generic path to process improvement for a software organization. 1. Initial – ad hoc 2. Repeatable – basic management processes 3. Defined – management. and engineering processes documented, standardized, integrated, and actually used. 4. Managed – measured and monitored and controlled using measurements. 5. Optimizing – Continuous process improvement is enabled by quantitative feedback from the process and from piloting innovative ideas and technologies.
CMM Levels and Key Process Areas 1. Initial level – No formalized procedures, project plans, cost estimates. – Tools not adequately integrated. – Many problems overlooked/ignored. – Maintenance very difficult – Generally ad-hoc processes 2. Repeatable level – Requirements management – Software Project planning – Software project tracking and oversight – Software subcontract management – Software quality assurance – Software configuration management
CMM Levels and Key Process Areas 3. Defined level – Organization process focus – Organization process definition – Training Program – Integration software management – Software product engineering – Inter group coordination – Peer reviews 4. Managed level – Quantitative process management – Software Quality management 5. Optimizing level – Defect prevention – Technology change management – Process change management