IS 4800 Empirical Research Methods for Information Science


 hypothesis 2. Determine hypothesis")


/N for each")


x(Num. Columns-1) 12")


 ■ Describe what your study is about")


 =")


")


- Slides: 65
IS 4800 Empirical Research Methods for Information Science Class Notes Feb. 22, 2012 Instructor: Prof. Carole Hafner, 446 WVH hafner@ccs. neu. edu Tel: 617 -373 -5116 Course Web site: www. ccs. neu. edu/course/is 4800 sp 12/
Outline Review Hypothesis Testing Chi Square Test for Independence Correlation Writing Research Reports 2
Basic Process of Hypothesis Testing ■ H 1: Research Hypothesis: ■ There is a difference ■ H 0: Null Hypothesis: ■ No difference ■ The difference is “null” ■ Compute p(observed difference|H 0) ■ ‘p’ = probability observed random variation difference is due to ■ If p<threshold then reject H 0 => accept H 1 ■ p typically set to 0. 05 for most work ■ p is called the “level of significance” 3
Type of Errors in Hypothesis Testing “The Truth” H 0 True H 0 False Decide to Reject H 0 Type I Error Correct Decision Do not Reject H 0 Correct Decision Type II Error ‘p’ = p(? ) Probability of Type I Error 4
Procedure for Hypothesis Testing 1. Formulate your research (and null) hypothesis 2. Determine hypothesis test parameters – significance threshold 3. Collect your data 4. Compute a statistic 5. Compare the value to the criterion value for the statistic (using SPSS or a printed table) 6. If statistic value is greater, means p < threshold and you can reject null hypothesis 7. We say: this data supports the research hypothesis 5
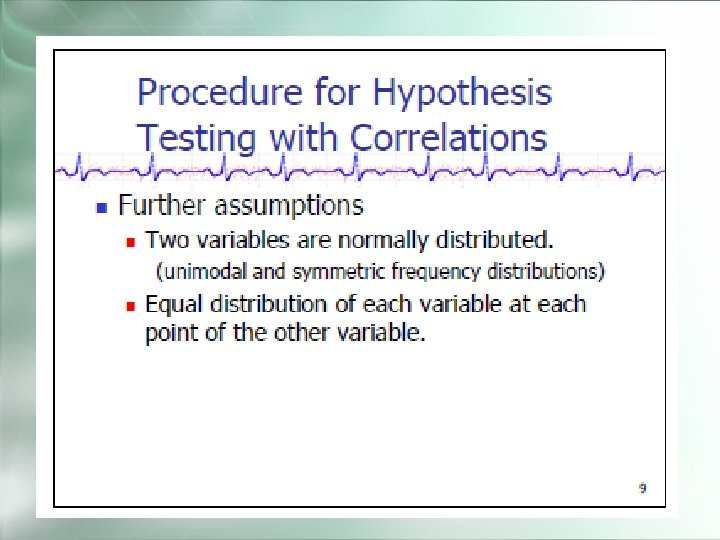
Chi-Square Test for Independence ■ Are two variables related, or are they independent? ■ Assumptions ■ Both variables must be nominal (or treated as if) ■ Representative samples assumed ■ Normal distribution NOT assumed 6
Example ■ Morning & night people using different modes of transportation. ■ What kind of study is this? 7
Expected frequencies if variables are independent ■ E = (R x C)/N for each cell ■ R = row count ■ C = column count ■ N = total number in all cells 8
Expected frequencies if variables are independent ■ Step 1 – compute row & col totals 120 80 80 50 70 9
Expected frequencies if variables are independent ■ Step 1 – compute row & col totals ■ Step 2 – compute row % 120 80 80 50 70 10 60% 40%
Expected frequencies if variables are independent ■ Step 1 – compute row & col totals ■ Step 2 – compute row % ■ Step 3 – ea cell = (R x C)/N (48) (30) (20) (32) 80 (42) (28) 50 120 80 70 11
Formula ■ df = (Num. Rows-1)x(Num. Columns-1) 12
Using Chi-Square for Morning and Night Commuters
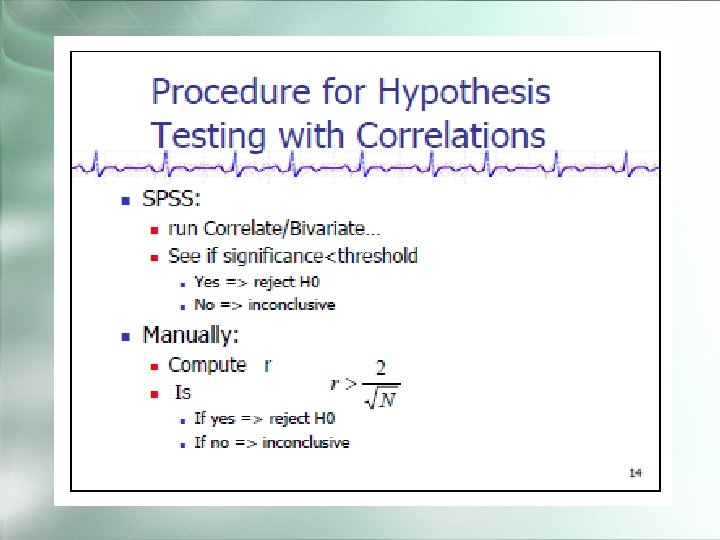
Computing Chi-square ■ SPSS: ■ run Non. Parametric/Chi. Square ■ See if significance<threshold • Yes => reject H 0 • No => inconclusive ■ Manually: ■ Determine df (= num categories – 1) ■ Compute Chi-square using formula ■ Lookup to see if statistic>table entry for thresholdsignificance, df • If yes => reject H 0 • If no => inconclusive 14
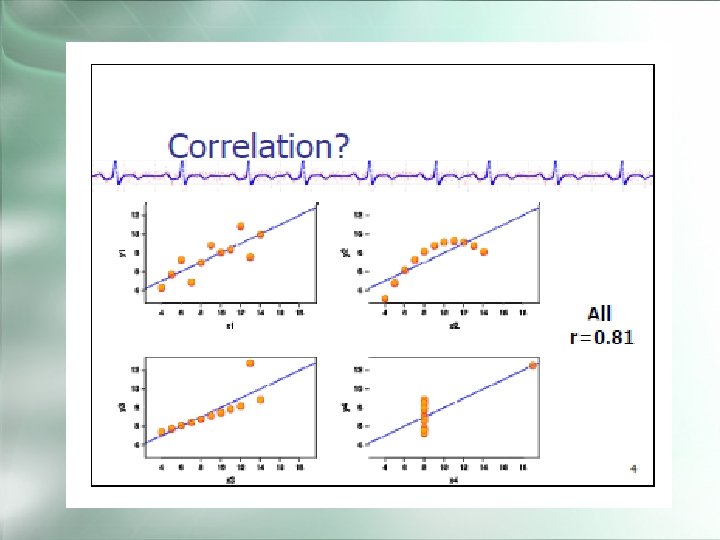
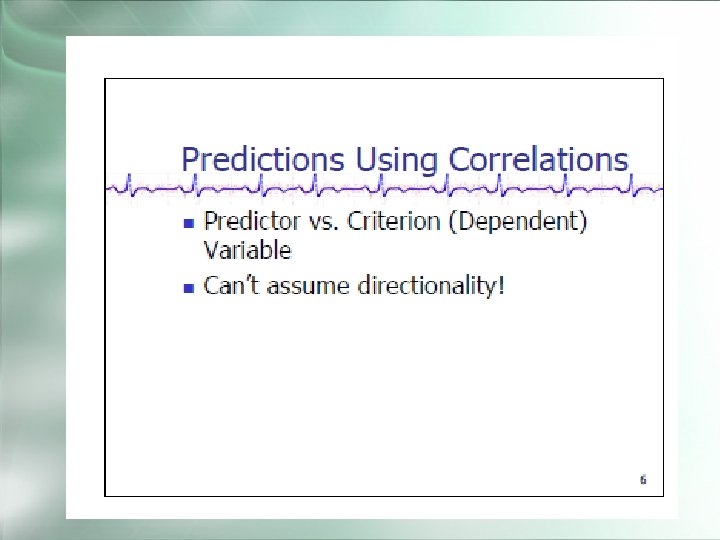
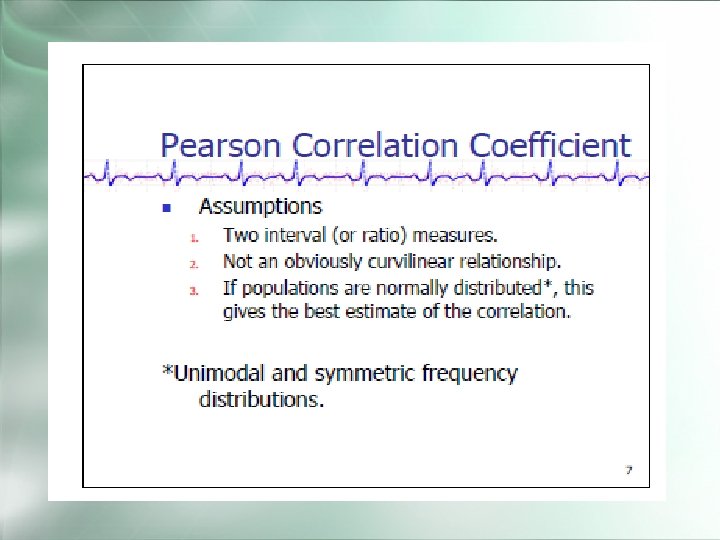
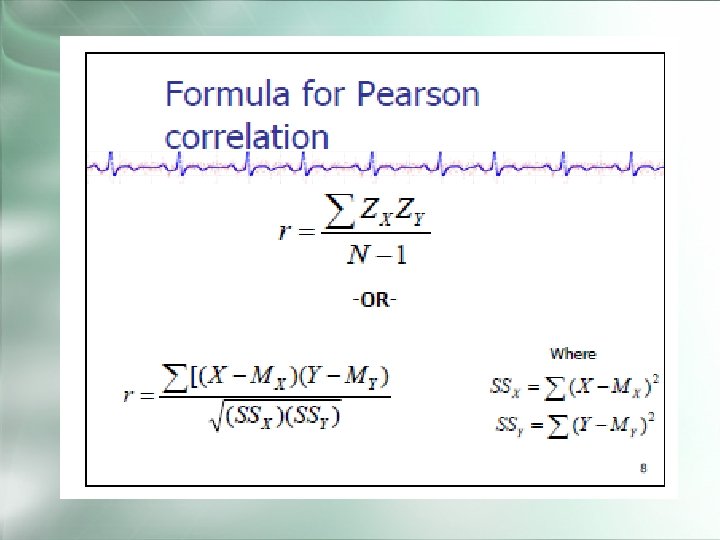
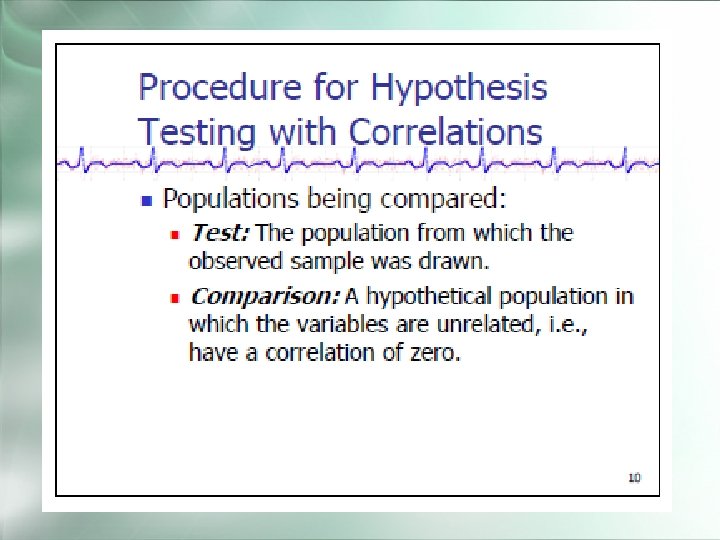
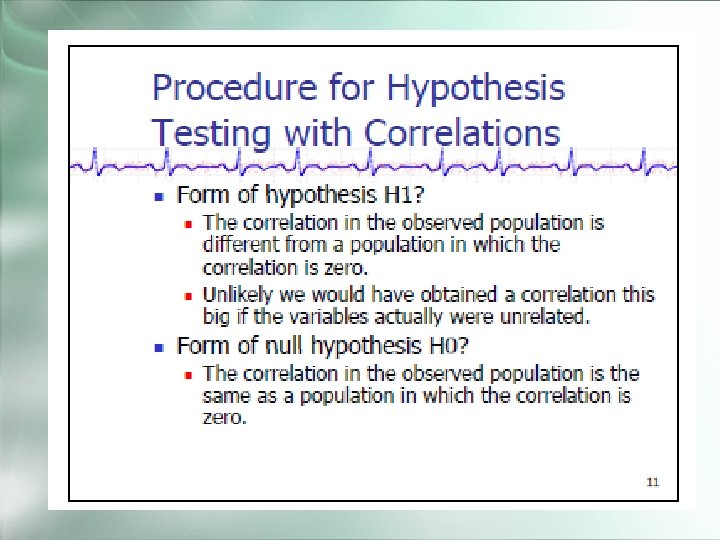
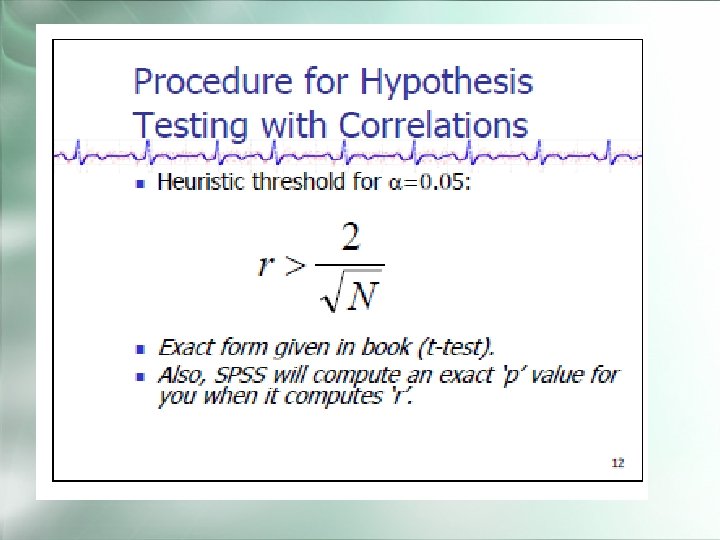
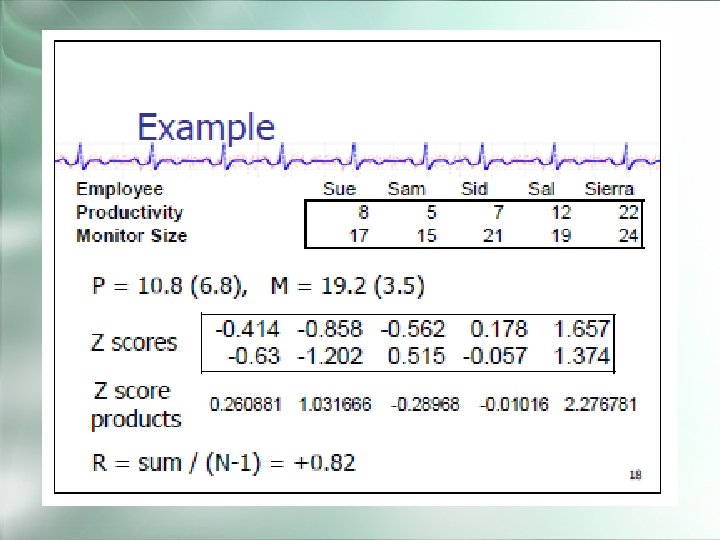
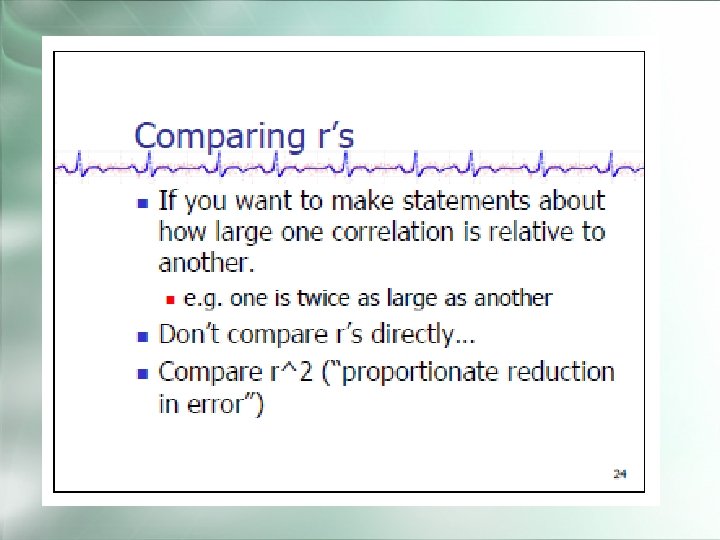
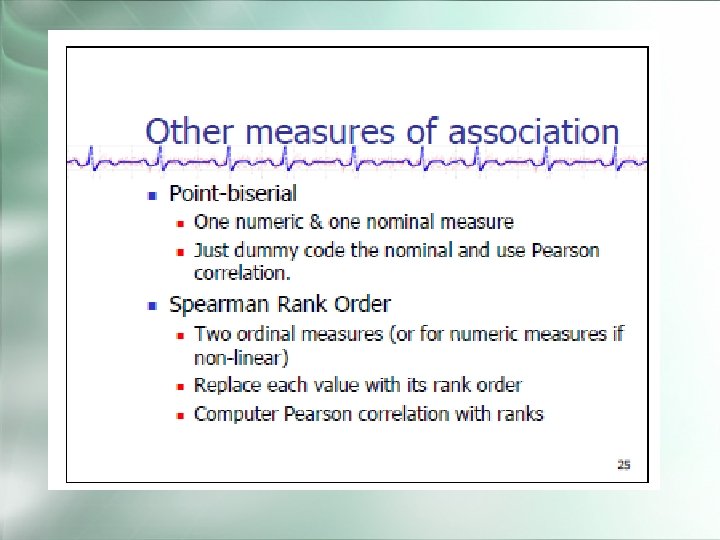
Correlation
Written Study Reports ■ Objectives (also critiques) ■ Describe what your study is about ■ Motivate your study ■ Assure reader you have conducted a sound study • Research Methods – often presented in small font ■ Present results in an objective manner ■ Discuss implications ■ Discuss future work ■ Enable replication 31
Typical Study vs. IS/CS/HCI Paper Structure n n Astract Introduction n n n Method Results Discussion n n Motivation Related work Hypotheses Limitations Implications Future work References 32
Typical Study vs. IS/CS/HCI Paper Structure ■ Abstract ■ Introduction ■ Motivation ■ Related work ■ System design ■ Evaluation ■ ■ Hypotheses Method Results Discussion – summary, limitations ■ Conclusion ■ Implications ■ Future work ■ References 33
The Abstract ■ Concise summary ■ Abstract for an empirical study should include ■ Information on the problem under study ■ The nature of the subject sample ■ A description of methods, equipment, and procedures ■ A statement of the results ■ A statement of the conclusions drawn ■ Often the last thing you write 34
The Introduction ■ Part of paper giving justification for study ■ Usually has the following information ■ Introduction to the topic under study ■ Brief review of research and theory related to the topic ■ A statement of the problem to be addressed ■ A statement of the purpose of the research ■ A brief description of the research strategy ■ A description of predictions and hypotheses ■ CS/IS papers often put Related Work as a separate section after Introduction ■ For each, describe how your work is different 35
Organization of the Introduction: General to Specific 36
The Method Section ■ Includes information on exactly how a study was carried out ■ Subsections ■ Participants or subjects • Describe in detail the participant or subject sample • Human participants go in a Participants subsection, and animal subjects in a Subjects subsection ■ Apparatus or materials • Describe in detail any equipment or materials used • Equipment is usually described in an Apparatus subsection and written materials in a Materials subsection 37
The Method Section ■ Procedure ■ Describe • Exactly how the study was carried out • The conditions to which subjects were exposed or under which observed • The behaviors measured and how they were scored • When and where observations were made • Debriefing procedures ■ Enough detail should be included in all sections so that the study could be replicated 38
The Results Section ■ Objective, dry, boring – just the facts ■ All relevant data and analyses are reported in the results section ■ Do not present raw data ■ Data should be reported in summary form ■ Descriptive statistics ■ Inferential statistics ■ Results of descriptive and inferential statistics must be presented in narrative format ■ Describe the source of any unconventional statistical tests 39
Commonly Used Statistical Citations Statistical Test Format Analysis of variance F (1, 85) = 5. 96, p <. 01 Chi-square χ2(3) = 11. 34, p <. 01 t test t (56) = 4. 78, p <. 01 40
Abbreviations for Statistical Notation Abbreviation Meaning df Degrees of freedom F F ratio M Arithmetic average (mean) N Number of subjects in entire sample p p value SD Standard deviation t t statistic z Results from a z test or z score μ Population mean (mu) s Population stddev 41
The Discussion Section ■ This is where you can take some liberties with describing what the results mean ■ Results are interpreted, conclusions drawn, and findings are related to previous research ■ Section begins with a brief restatement of hypotheses ■ Next, indicate if hypotheses were confirmed ■ The rest of the section is dedicated to integrating findings with previous research ■ It is fine to speculate, but speculations should not stray far from the data 42
Organization of Discussion: Specific to General 43
Example 44
45
46
47
48
49
50
51
52
53
54
55
56
Citations ■ Liberally cite previous & related work. ■ If you copy passages you must cite and, depending on length, format to indicate it is copied. ■ Suggest using End. Note, Bib. Tex or similar. 57
Ethical Issues ■ Report all of your findings (not just the ones you like) ■ Adhere to your original plan ■ Report any deviations and why ■ Power analysis, statistics, measures ■ Do not drop subjects or data points without rigorous justification ■ If your hypothesis test was not significant you cannot say anything about difference in means (example). ■ If you did not do an experiment, attempting to control for extraneous variables, you cannot mention or imply causality. 58
Oral Presentation of Study Results 59
Oral Presentation ■ Main concepts and ideas ■ Do not go into great detail on experimental methods – just enough so people understand roughly what you did ■ Focus on motivation, results, implications ■ If listener wants details they can read the paper or ask questions 60
Oral Presentation Don’t do this… 61
Oral Presentation Do use as many figures as possible WEEK 4 CO M PO S BO ITE N TA D SK G CO O M AL PO SI BO TE N TA D S G K O A L WEEK 1 62
Oral Presentation Guide for Visuals ■ Visuals should be exhibits that you talk about ■ Do not put lots of text on charts ■ Do not read your charts for your presentation ■ Use interactivity, video, images to keep your audience awake 63
Common Questions ■ How did you evaluate that? ■ How did you measure that? ■ How did you control for extraneous variable X? ■ Why didn’t you use statistic Y? ■ Isn’t that a biased sample? ■ What was your control group? ■ How did you do study procedure Z? 64
Tips ■ Describe your sample ■ Minimal demographics – number of subjects, broken down by gender ■ Better: age, occupation, major, year ■ Minimize text on your charts ■ If you use a novel measure (e. g. , new survey) you must give details on the measure ■ Actual questions asked ■ Any reliability/validity/psychometrics done ■ If you do interviews, include actual quotes ■ Build from data to conclusions ■ Practice your timing/delivery with your project team 65