Intro Unequal Family Income and Unequal Opportunity for


![Low Income Student Shares of Totals 1970 to 2014 60. 0 [VALUE] Low Income](https://slidetodoc.com/presentation_image/445f567f3343b08471edd5f708ecce51/image-8.jpg "Low Income Student Shares of Totals 1970 to 2014 60. 0 [VALUE] Low Income")


![Change in High School Graduation Rate by Income Quartile 1970 to 2016 [VALUE] Top](https://slidetodoc.com/presentation_image/445f567f3343b08471edd5f708ecce51/image-12.jpg "Change in High School Graduation Rate by Income Quartile 1970 to 2016 [VALUE] Top")


![Change in College Continuation Rate by Income Quartile 1970 to 2016 [VALUE] Top [VALUE]](https://slidetodoc.com/presentation_image/445f567f3343b08471edd5f708ecce51/image-15.jpg "Change in College Continuation Rate by Income Quartile 1970 to 2016 [VALUE] Top [VALUE]")


![Change in College Participation Rate by Income Quartile 1970 to 2016 [VALUE] Top [VALUE]](https://slidetodoc.com/presentation_image/445f567f3343b08471edd5f708ecce51/image-18.jpg "Change in College Participation Rate by Income Quartile 1970 to 2016 [VALUE] Top [VALUE]")

![Change in Estimated Completion Rate by Income Quartile 1970 to 2016 [VALUE] Top [VALUE]](https://slidetodoc.com/presentation_image/445f567f3343b08471edd5f708ecce51/image-20.jpg "Change in Estimated Completion Rate by Income Quartile 1970 to 2016 [VALUE] Top [VALUE]")


 LT 10 Source: NPSAS 2016 10 -20 20 -30 30 -40")


- Slides: 65
Intro Unequal Family Income and Unequal Opportunity for Higher Education Duluth Superior Area Community Foundation Lake Superior College Duluth, MN July 16, 2018 Tom Mortenson Senior Scholar, The Pell Institute for the Study of Opportunity in Higher Education Policy Analyst, Postsecondary Education OPPORTUNITY
Estimated Baccalaureate Degree Attainment by Age 24 by Family Income Quartile 1970 to 2016 70% 60% [VALUE] Top Income Quartile Bachelor's Degree Attainment Rate (moving 3 -year average) 50% 40% [VALUE] Third Income Quartile 30% Second Income Quartile[VALUE] 20% [VALUE] 10% [VALUE] Bottom Income Quartile 0% 1970 1975 1980 1985 Source: Calculated from October Current Population Survey File (Formerly Table 14 in Census Bureau's School Enrollment Report) 1990 1995 2000 2005 2010 2015
The Changing Policy Environment for Higher Education Opportunity for Families ------------- • • 1973: Growing importance of higher education 1980: State defunding of public higher education 1981: Increasing public institution tuition and fee rates ~1994: Federal policy shift from grants to loans 1995: State financial aid shift from need-based grants toward merit-based scholarships 1999: Federal shift to tax credits 2000: Median family income for families with 18 to 24 year olds peaks and begins sharp decline 2003: Declining international ranking in production of college graduates
Median Family Income for Families with Children 1947 to 2016 $100, 000 $90, 000 Children 18 to 24 Years $80, 000 $70, 000 Income (2016 Dollars) $60, 000 $50, 000 Children Under 18 Years $40, 000 $30, 000 $20, 000 $10, 000 $0 1947 1953 Source: US Census Bureau/CPS 1959 1965 1971 1977 1983 1989 1995 2001 2007 2013
Upper Family Income Limits for First, Second and Third Family Income Quartiles $ 160, 000 [VALUE] (2007) $ 140, 000 [VALUE] Third Quartile Upper Family Income Limits of Quartiles (Constant 2016 Dollars/CPI-U-RS) $ 120, 000 $ 100, 000 [VALUE] (2001) $ 80, 000 $ 60, 000 [VALUE] Second Quartile [VALUE](1999) $ 40, 000 [VALUE] Bottom Quartile [VALUE] $ 20, 000 $1987 1991 1995 Source: Calculated from October Current Population Survey File (Formerly Table 14 in Census Bureau's School Enrollment Report) 1999 2003 2007 2011 2015
Change in Upper Limits for First, Second and Third Family Income Quartiles Between 1987 and 2016 [VALUE] Quartile Third [VALUE] Second [VALUE] Bottom -4. 0 0. 0 4. 0 Source: Calculated from October Current Population Survey File (Formerly Table 14 in Census Bureau's School Enrollment Report) 8. 0 Change (%) 12. 0 16. 0 20. 0
K-12 School Children Approved for National School Lunch Program 1989 to 2014 30. 0 20. 0 10. 0 1989 1991 Source: US Dept of Agriculture 1993 1995 1997 1999 2001 2003 2005 2007 2009 2011 2013 52. 6 52. 8 53. 3 50. 8 50. 4 48. 2 46. 0 44. 8 44. 6 42. 9 41. 3 40. 7 39. 9 40. 0 40. 2 40. 1 39. 9 39. 7 38. 6 37. 8 37. 0 34. 9 33. 0 31. 9 40. 0 31. 4 Approved (%) 50. 0 45. 5 60. 0
Low Income Student Shares of Totals 1970 to 2014 60. 0 [VALUE] Low Income Share at Total (%) 50. 0 K-12 Students Approved for Free/Reduced Price School Lunches [VALUE] 40. 0 [VALUE] Undergraduate Students with Pell Grants 30. 0 20. 0 Bachelor's Degrees Awarded by Age 24 to Students from Bottom Quartile of Family Income [VALUE] 10. 0 [VALUE] 0. 0 1974 1978 1982 1986 1990 1994 1998 2002 2006 2010 2014
The Education Pipeline • • • High school graduation College continuation for high school graduates College participation Estimated bachelor’s degree completion by age 24 Estimate bachelor’s degree attainment by age 24
High School Graduation Rates by Family Income Intervals for Dependent 18 to 24 Year Olds 2016 100. 0% 90. 5% 90. 0% 84. 4% 87. 0% 87. 3% $50, 000 to $74, 999 $75, 000 to $99, 999 [VALUE] 81. 3% 80. 0% 76. 2% 77. 4% 73. 9% High School Graduation Rate 70. 0% [VALUE] 60. 0% 50. 0% 40. 0% 30. 0% 20. 0% 10. 0% Less than $10, 000 to $14, 999 $15, 000 to $19, 999 $20, 000 to $29, 999 Source: Calculated from October Current Population Survey File (Formerly Table 14 in Census Bureau's School Enrollment Report) $30, 000 to $39, 999 $40, 000 to $49, 999 $100, 000 to $150, 000 and $149, 999 over
High School Graduation Rates by Family Income Quartiles for Dependent 18 to 24 Year Olds 1970 to 2016 100% Top Income Quartile 95% High School Graduation Rate 90% [VALUE] [VALUE] Third Income Quartile 85% [VALUE] 80% Second Income Quartile [VALUE] 75% 70% 65% [VALUE] Bottom Income Quartile 60% 1970 1975 1980 1985 Source: Calculated from October Current Population Survey File (Formerly Table 14 in Census Bureau's School Enrollment Report) 1990 1995 2000 2005 2010 2015
Change in High School Graduation Rate by Income Quartile 1970 to 2016 [VALUE] Top [VALUE] Third [VALUE] Second [VALUE] Bottom -6. 0 -4. 0 -2. 0 0. 0 2. 0 4. 0 Change (%) Source: Calculated from October Current Population Survey File (Formerly Table 14 in Census Bureau's School Enrollment Report) 6. 0 8. 0 10. 0 12. 0 14. 0 16. 0
College Continuation Rates by Family Income Intervals for Dependent 18 to 24 Year Old High School Graduates 2016 100. 0% [VALUE] 90. 0% 82. 6% 77. 5% 80. 0% College Continuation Rate 70. 0% 60. 0% [VALUE] 63. 1% 63. 2% $20, 000 to $29, 999 $30, 000 to $39, 999 68. 5% 68. 2% $40, 000 to $49, 999 $50, 000 to $74, 999 57. 5% 52. 3% 50. 0% 40. 0% 30. 0% 20. 0% 10. 0% Less than $10, 000 to $14, 999 $15, 000 to $19, 999 Source: Calculated from October Current Population Survey File (Formerly Table 14 in Census Bureau's School Enrollment Report) $75, 000 to $99, 999 $100, 000 to $150, 000 and $149, 999 over
College Continuation Rates by Family Income Quartiles for Dependent 18 to 24 Year Old High School Graduates 1970 to 2016 100% Top Income Quartile 90% College Continuation Rate 80% [VALUE] Third Income Quartile [VALUE] 70% [VALUE] Second Income Quartile 60% [VALUE] Bottom Income Quartile 50% [VALUE] 40% 30% 1970 1975 1980 1985 Source: Calculated from October Current Population Survey File (Formerly Table 14 in Census Bureau's School Enrollment Report) 1990 1995 2000 2005 2010 2015
Change in College Continuation Rate by Income Quartile 1970 to 2016 [VALUE] Top [VALUE] Third [VALUE] Second [VALUE] Bottom -4. 0 -2. 0 0. 0 2. 0 4. 0 6. 0 Change (%) Source: Calculated from October Current Population Survey File (Formerly Table 14 in Census Bureau's School Enrollment Report) 8. 0 10. 0 12. 0 14. 0 16. 0
College Participation Rates by Family Income Intervals for Dependent 18 to 24 Year Olds 2016 90. 0% [VALUE] 80. 0% 74. 7% 67. 7% 70. 0% 57. 8% College Participation Rate 60. 0% 59. 4% 51. 3% 48. 8% 50. 0% 43. 9% 40. 0% 38. 6% [VALUE] 30. 0% 20. 0% 10. 0% Less than $10, 000 to $14, 999 $15, 000 to $19, 999 $20, 000 to $29, 999 Source: Calculated from October Current Population Survey File (Formerly Table 14 in Census Bureau's School Enrollment Report) $30, 000 to $39, 999 $40, 000 to $49, 999 $50, 000 to $74, 999 $75, 000 to $99, 999 $100, 000 to $150, 000 and $149, 999 over
College Participation Rates by Family Income Quartiles for Dependent 18 to 24 Year Olds 1970 to 2016 90% Top Income Quartile 80% [VALUE] College Participation Rate 70% Third Income Quartile 60% 50% [VALUE] Second Income Quartile 40% 30% Bottom Income Quartile [VALUE] 20% 1970 1975 1980 1985 Source: Calculated from October Current Population Survey File (Formerly Table 14 in Census Bureau's School Enrollment Report) 1990 1995 2000 2005 2010 2015
Change in College Participation Rate by Income Quartile 1970 to 2016 [VALUE] Top [VALUE] Third [VALUE] Second [VALUE] Bottom -5. 0 0. 0 5. 0 10. 0 Change (%) Source: Calculated from October Current Population Survey File (Formerly Table 14 in Census Bureau's School Enrollment Report) 15. 0 20. 0
Estimated Bachelor's Degree Completion Rates by Age 24 by Family Income Quartiles for Dependent College Students Who Began College, 1970 to 2016 80% [VALUE] Top Income Quartile 70% [VALUE] Four-Year College Completion Rate (moving 3 -year average) 60% 50% [VALUE] Third Income Quartile 40% [VALUE] 20% [VALUE] Second Income Quartile 30% [VALUE] Bottom Income Quartile 10% 0% 1970 1975 1980 1985 Source: Calculated from October Current Population Survey File (Formerly Table 14 in Census Bureau's School Enrollment Report) 1990 1995 2000 2005 2010 2015
Change in Estimated Completion Rate by Income Quartile 1970 to 2016 [VALUE] Top [VALUE] Third [VALUE] Second [VALUE] Bottom -10. 0 -5. 0 0. 0 5. 0 Source: Calculated from October Current Population Survey File (Formerly Table 14 in Census Bureau's School Enrollment Report) 10. 0 15. 0 Change (%) 20. 0 25. 0 30. 0 35. 0
Estimated Baccalaureate Degree Attainment by Age 24 by Family Income Quartile 1970 to 2016 70% 60% [VALUE] Top Income Quartile Bachelor's Degree Attainment Rate (moving 3 -year average) 50% 40% [VALUE] Third Income Quartile 30% Second Income Quartile[VALUE] 20% [VALUE] 10% [VALUE] Bottom Income Quartile 0% 1970 1975 1980 1985 Source: Calculated from October Current Population Survey File (Formerly Table 14 in Census Bureau's School Enrollment Report) 1990 1995 2000 2005 2010 2015
Change in Estimated Bachelor's Degree Attainment Rate by Age 24 by Family Income Quartile 1970 to 2016 [VALUE] Top [VALUE] Third [VALUE] Second All = 15. 9% [VALUE] Bottom 0. 0 5. 0 10. 0 Source: Calculated from October Current Population Survey File (Formerly Table 14 in Census Bureau's School Enrollment Report) 15. 0 Change (%) 20. 0 25. 0 30. 0
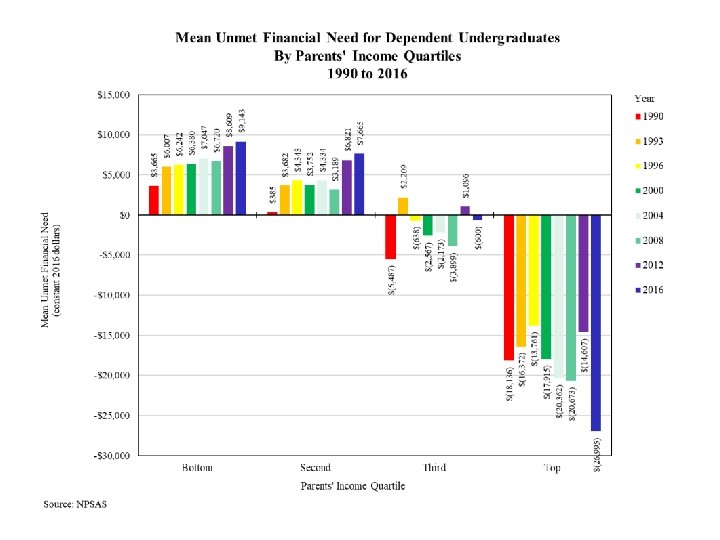
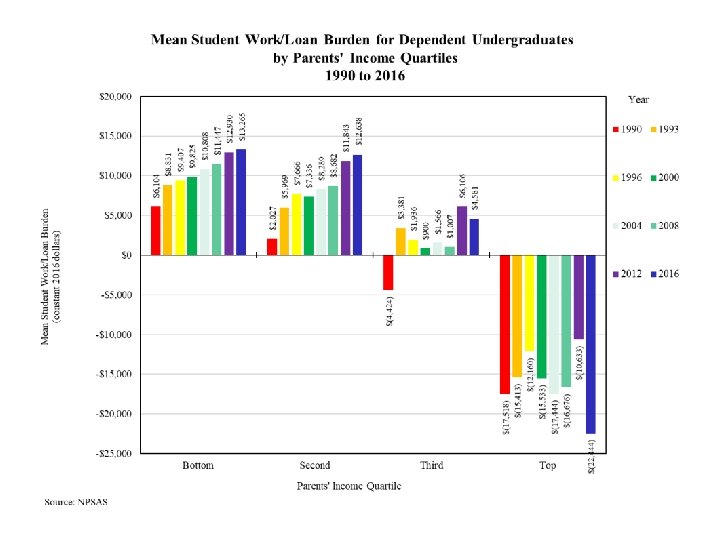
Influences on Opportunity for Higher Education • Social and cultural capital • Financial barriers: • • Unmet financial need Student work-loan burden Net price to family Net price tax rate • Adverse Childhood Experiences (ACEs)
High School Graduation Rates for Dependent 18 to 24 Year Olds by Family Income Quartiles and Race/Ethnicity 2016 White NH 90. 6 87. 4 Top Black [VALUE] Family Income Quartiles 93. 2 88. 9 91. 5 Third [VALUE] 86. 7 86. 1 87. 2 Second [VALUE] 84. 7 77. 7 70. 2 Bottom 78. 4 0. 0 10. 0 20. 0 30. 0 40. 0 50. 0 60. 0 High School Graduation Rates (%) Source: Calculated from October Current Population Survey File (Formerly Table 14 in Census Bureau's School Enrollment Report) 70. 0 80. 0 [VALUE] 90. 0 100. 0 Asian Hispanic
College Continuation Rates for Dependent 18 to 24 Year Old High School Graduates by Family Income Quartiles and Race/Ethnicity 2016 White NH 87. 5 85. 0 Top Black [VALUE] Family Income Quartiles 82. 4 Hispanic 80. 2 77. 3 Third [VALUE] 73. 7 66. 7 60. 7 Second [VALUE] 73. 9 59. 2 54. 2 Bottom [VALUE] 62. 8 0. 0 10. 0 20. 0 30. 0 40. 0 50. 0 60. 0 College Continuation Rates (%) Source: Calculated from October Current Population Survey File (Formerly Table 14 in Census Bureau's School Enrollment Report) 70. 0 80. 0 Asian 90. 0 100. 0
College Participation Rates for Dependent 18 to 24 Year Olds by Family Income Quartiles and Race/Ethnicity 2016 White NH 79. 2 Black 74. 3 Top [VALUE] Asian Family Income Quartiles 76. 8 Hispanic 71. 3 70. 7 Third [VALUE] 63. 9 57. 4 52. 9 Second [VALUE] 62. 5 46. 0 38. 1 Bottom [VALUE] 49. 2 0. 0 10. 0 20. 0 30. 0 40. 0 50. 0 60. 0 College Participation Rates (%) Source: Calculated from October Current Population Survey File (Formerly Table 14 in Census Bureau's School Enrollment Report) 70. 0 80. 0 90. 0 100. 0
Share of Dependent 18 to 24 Year Old Enrollment Enrolled in 4 -Year Institutions by Family Income Quartiles and Race/Ethnicity 2016 Hispanic 77. 4 [VALUE] Top 74. 9 Asian Black 83. 7 Family Income Quartiles White non-Hispanic 75. 7 [VALUE] Third 72. 6 74. 2 59. 6 [VALUE] Second 64. 8 70. 3 55. 4 [VALUE] Bottom 64. 9 61. 8 0. 0 10. 0 20. 0 30. 0 40. 0 50. 0 60. 0 4 -Year Enrollment Share (%) Source: Calculated from October Current Population Survey File (Formerly Table 14 in Census Bureau's School Enrollment Report) 70. 0 80. 0 90. 0 100. 0
Time Use of Full-Time College Students on Weekdays Ages 18 to 24 Years 2003 -2016 Other; 2. 1 Traveling; 1. 5 Sleeping; 8. 8 [CATEGORY NAME], [VALUE] Eating & Drinking; 1. 0 Educational Activities; 3. 3 Grooming; 0. 8 Working & Related Activities; 2. 3 24 Hours
Time Use of Asian Full-Time College Students on Weekdays Ages 18 to 24 Years 2003 -2016 Other; 1. 6 Traveling; 1. 4 [CATEGORY NAME], [VALUE] Sleeping; 9. 3 Eating & Drinking; 1. 4 Grooming; 0. 7 Educational Activities; 4. 5 24 Hours Working & Related Activities; 1. 3
Financial Need Analysis Model Cost of Attendance Tuition and fees Room and board Books and supplies Personal and medical care Transportation Less: Expected family contribution Income and assets Family size Number of children enrolled in college Equals: Financial need Gift aid: grants, scholarships, waivers Earnings from work/study Education loans: subsidized/unsubsidized Stafford, PLUS Federal tax credits
4 3. 56 4. 11 4. 36 5. 88 6 1961 1965 5. 79 5. 48 5. 57 5. 84 5. 31 5. 42 4. 73 5. 03 7. 26 7. 75 8 1969 1973 8. 68 9. 69 10. 02 10. 37 10. 24 10. 40 10. 42 10. 36 10. 18 10. 01 9. 42 9. 38 9. 72 9. 38 9. 27 9. 30 9. 29 9. 23 8. 66 8. 85 9. 06 9. 24 10 1977 1981 1985 1989 1993 1997 2001 2005 6. 29 6. 49 8. 23 7. 88 7. 63 7. 62 7. 51 7. 46 7. 49 7. 51 7. 61 7. 28 6. 97 6. 66 6. 67 7. 01 7. 15 7. 13 6. 64 6. 31 State Fiscal Support per $1000 Personal Income ($) State Fiscal Support for Higher Education per $1000 of Personal Income FY 1961 to FY 2017 12 Trend Since 1980 Intercepts Zero in 2056 2 2009 2013 2017
Average Tuition and Required Fees in Public Institutions In Constant Dollars AY 1964 to AY 2013 9, 000 $ 8, 070 8, 000 7, 000 Tuition & Required Fees (AY 2013$) $ 6, 495 $ 5, 899 6, 000 5, 000 $ 4, 625 $ 4, 689 4 -Year All Institutions 4, 000 $ 3, 262 3, 000 $ 2, 792 $ 2, 716 $ 2, 147 2, 000 $ 3, 385 $ 1, 825 $ 2, 512 $ 2, 252 $ 2, 200 1, 000 $ 1, 761 $ 1, 696 $ 1, 360 $ 1, 378 $ 1, 022 2 -Year $ 728 0 1964 1968 Source: 2013 Digest of Education Statistics 1972 1976 1980 1984 1988 1992 Academic Year Ending 1996 2000 2004 2008 2012
Financial Aid Resources Received by Full-Time, Full-Year Dependent Undergraduate Students at One Institution 2015 -16 $ 110, 000 Resources $ 100, 000 EFC $ 90, 000 Grant $ 80, 000 Loan Resources $ 70, 000 Overmet Need $ 60, 000 CWS Other $ 50, 000 COA $ 40, 000 $ 30, 000 Unmet Need $ 20, 000 $ 10, 000 $LT 10 10 -20 20 -30 30 -40 40 -50 50 -60 60 -70 70 -80 80 -90 Parents' Income ($000) Source: NPSAS 2016 90 -100 100 -125 125 -150 150 -200 GT 200
$ 20, 000 Source: NPSAS 2016 $ 15, 352 20 -30 30 -40 40 -50 50 -60 60 -70 70 -80 80 -90 Parents' Income ($000) $ 31, 588 $ 28, 891 $ 28, 191 $ 27, 340 $ 26, 565 $ 26, 199 $ 25, 762 $ 26, 294 $ 25, 607 $ 26, 457 $ 25, 841 $ 26, 317 $ 56, 327 $ 53, 178 $ 54, 076 $ 51, 005 $ 50, 118 $ 49, 768 $ 48, 681 $ 49, 358 $ 48, 018 $ 48, 786 $ 48, 883 $ 44, 594 $ 46, 790 $ 60, 000 $ 14, 825 $ 15, 711 $ 15, 260 $ 15, 294 $ 14, 442 $ 15, 350 10 -20 $ 14, 350 $ 15, 236 $$ 15, 085 $ 10, 000 $ 15, 265 LT 10 $ 25, 891 $ 44, 716 $ 50, 000 $ 15, 448 $ 25, 657 $ 30, 000 $ 16, 190 Cost of Attendance Mean Costs of Attendance by Parental Income and Sector $ 40, 000 90 -100 100 -125 125 -150 150 -200 GT 200 Pub 4 -Yr Pub 2 -Yr Priv 4 -Yr
$ 1, 382 $ 1, 283 $ 1, 778 $ 2, 808 $ 2, 438 $ 3, 086 LT 10 10 -20 20 -30 30 -40 40 -50 Source: NPSAS 2016 50 -60 60 -70 70 -80 Parents' Income ($000) 80 -90 $ 40, 000 $ 34, 902 $ 35, 133 $ 36, 556 $ 25, 498 $ 23, 205 $ 25, 242 $ 20, 769 $ 21, 529 $ 21, 671 $ 15, 510 $ 14, 836 $ 15, 101 $ 12, 504 $ 12, 168 $ 13, 524 $ 10, 416 $ 8, 238 $ 9, 379 $ 6, 560 $ 6, 229 $ 6, 947 $ 330 $ 201 $ 420 $ 20, 000 $ 5, 507 $ 4, 371 $ 6, 484 $ 279 $ 38 $ 313 $$ 176 $ 82 $ 6, 399 Expected Family Contribution $ 80, 000 $ 75, 005 $ 100, 466 $ 120, 000 Mean Expected Family Contribution by Parental Income and Sector 2015 -16 $ 60, 000 90 -100 100 -125 125 -150 150 -200 GT 200 Pub 4 -Yr Pub 2 -Yr $ 100, 000 Priv 4 -Yr
$ (60, 000) LT 10 Source: NPSAS 2016 10 -20 20 -30 30 -40 40 -50 50 -60 60 -70 70 -80 Parents' Income ($000) 80 -90 $ (44, 139) $ (43, 416) $ (20, 309) $ (20, 000) $ (6, 011) $ (7, 494) $ (6, 270) $ 20, 000 $ 2, 693 $ 16, 622 $ 11, 055 $ 13, 695 $ 6, 572 $ 458 $ 2, 275 $ 15, 346 $ 6, 112 $ 35, 017 $ 36, 244 $ 39, 301 $ 42, 410 $ 41, 534 $ 45, 700 $ 47, 105 $ 44, 175 $ 46, 477 $ 38, 317 $ 28, 834 $ 29, 333 $ 19, 734 $ 20, 100 $ 10, 979 $ 23, 649 $ 12, 798 $ 24, 459 $ 13, 802 $ 25, 987 $ 15, 064 $ 25, 613 $ 15, 410 $ 25, 481 $ 16, 107 $ 40, 000 $ 9, 123 Financial Need $ 60, 000 Mean Financial Need by Parental Income and Sector 2015 -16 Pub 4 -Yr Pub 2 -Yr Priv 4 -Yr $- $ (40, 000) 90 -100 100 -125 125 -150 150 -200 GT 200
$ 5, 000 $- Source: NPSAS 2016 10 -20 20 -30 $ 5, 293 $ 6, 243 LT 10 30 -40 40 -50 70 -80 Parents' Income ($000) $ 5, 520 $ 6, 069 $ 6, 439 80 -90 $ 3, 784 $ 3, 708 $ 1, 615 $ 3, 383 $ 2, 161 $ 3, 653 $ 1, 665 $ 13, 807 $ 20, 976 $ 20, 613 $ 18, 801 $ 16, 924 $ 15, 498 $ 22, 559 $ 27, 915 $ 25, 903 $ 25, 674 $ 25, 354 $ 24, 573 $ 21, 985 $ 19, 805 $ 20, 000 $ 4, 277 $ 2, 340 $ 4, 312 60 -70 $ 1, 933 $ 2, 471 50 -60 $ 2, 300 $ 2, 876 $ 8, 894 $ 10, 299 $ 11, 620 $ 11, 227 $ 15, 000 $ 6, 306 $ 10, 652 $ 25, 000 $ 4, 186 $ 10, 000 $ 6, 744 Grants $ 30, 000 Mean Total Grants by Parental Income and Sector 2015 -16 Pub 4 -Yr Pub 2 -Yr Priv 4 -Yr 90 -100 100 -125 125 -150 150 -200 GT 200
$ 1, 000 LT 10 Source: NPSAS 2016 10 -20 20 -30 30 -40 $ 2, 000 40 -50 50 -60 60 -70 70 -80 Parents' Income ($000) 80 -90 $ 644 $ 808 $ 1, 213 $ 1, 047 $ 1, 290 $ 1, 125 $ 3, 461 $ 4, 087 $ 4, 121 $ 4, 461 $ 6, 182 $ 6, 024 $ 5, 384 $ 4, 680 $ 4, 783 $ 4, 769 $ 7, 917 $ 6, 979 $ 7, 636 $ 7, 230 $ 6, 738 $ 6, 659 $ 8, 000 $ 4, 823 $ 5, 157 $ 5, 322 $ 6, 047 $ 5, 831 $ 9, 000 $ 1, 079 $ 767 $ 4, 302 $ 4, 030 $ 5, 704 $ 7, 000 $ 831 $ 574 $$ 505 $ 4, 000 $ 3, 553 $ 5, 826 $ 6, 000 $ 557 $ 4, 075 $ 5, 000 $ 870 Loans $ 10, 000 $ 9, 267 Mean Total Loans by Parental Income and Sector 2015 -16 Pub 4 -Yr Pub 2 -Yr Priv 4 -Yr $ 3, 000 90 -100 100 -125 125 -150 150 -200 GT 200
Mean Total Work-Study by Parental Income and Sector 2015 -16 $ 1, 400 $ 1, 175 Pub 4 -Yr $ 1, 028 Pub 2 -Yr $ 747 $ 735 $ 730 $ 198 $ 369 $ 26 $ 35 $- $ 79 $1 $ 59 $ 11 $- $ 73 $ 180 $4 $ 51 $ 85 $ 262 $ 186 $ 282 $ 300 $ 372 $ 341 $ 213 $ 329 $ 303 $ 298 $ 63 $ 200 $ 210 $ 400 $ 321 $ 600 $ 493 $ 563 $ 701 $ 766 Priv 4 -Yr $ 774 $ 800 $ 152 Work-Study $ 1, 000 $ 989 $ 999 $ 1, 200 $LT 10 10 -20 20 -30 30 -40 40 -50 50 -60 60 -70 70 -80 Parents' Income ($000) Source: NPSAS 2016 80 -90 90 -100 100 -125 125 -150 150 -200 GT 200
$ 5, 000 $ 4, 567 $ 4, 665 Mean Total Other Aid by Parental Income and Sector 2015 -16 Pub 4 -Yr $ 4, 500 $ 3, 779 $ 2, 825 $ 2, 635 $ 2, 761 $ 2, 712 $ 3, 538 $ 3, 921 $ 2, 450 $ 2, 482 $ 2, 624 $ 3, 245 $ 1, 317 $ 1, 748 $ 1, 859 Priv 4 -Yr $0 $ 235 $ 79 $ 13 $8 $ 206 40 -50 $ 67 30 -40 $ 216 $ 818 $ 1, 207 $ 35 10 -20 $ 44 $ 55 LT 10 $ 221 $ 951 $ 973 $ 500 $ 1, 490 $ 2, 000 $ 1, 500 $ 2, 958 $ 2, 853 $ 2, 392 $ 2, 500 $ 2, 691 $ 2, 647 $ 2, 421 $ 3, 000 $ 38 Other Aid $ 3, 500 $ 3, 358 $ 4, 000 $ 1, 000 Pub 2 -Yr $20 -30 50 -60 60 -70 70 -80 Parents' Income ($000) Source: NPSAS 2016 80 -90 90 -100 100 -125 125 -150 150 -200 GT 200
$ 10, 000 $ 5, 000 $- Source: NPSAS 2016 20 -30 30 -40 40 -50 $ 3, 316 60 -70 70 -80 80 -90 Parents' Income ($000) $ 11, 654 $ 11, 757 $ 11, 867 $ 12, 827 $ 13, 737 $ 16, 079 $ 15, 759 $ 10, 541 $ 10, 343 $ 9, 906 $ 17, 186 $ 25, 000 $ 22, 213 $ 38, 141 $ 34, 501 $ 35, 412 $ 35, 025 $ 34, 004 $ 32, 755 $ 32, 186 $ 34, 118 $ 34, 134 $ 30, 264 $ 27, 254 $ 25, 553 $ 30, 000 $ 2, 259 $ 3, 205 $ 2, 968 $ 3, 401 $ 3, 806 50 -60 $ 3, 497 $ 4, 159 $ 5, 115 $ 15, 000 $ 10, 623 10 -20 $ 6, 124 $ 7, 271 LT 10 $ 16, 028 $ 35, 000 $ 34, 375 $ 40, 000 $ 7, 128 $ 16, 022 $ 20, 000 $ 7, 804 Financial Aid $ 45, 000 Mean Total Financial Aid by Parental Income and Sector 2015 -16 Pub 4 -Yr Pub 2 -Yr Priv 4 -Yr 90 -100 100 -125 125 -150 150 -200 GT 200
20 -30 30 -40 $ 7, 570 10 -20 $ 8, 700 LT 10 $ 8, 801 $ 9, 585 $ 10, 000 $ 9, 459 $ 12, 000 $ 6, 363 $ 6, 000 $ 3, 478 $ 4, 000 $- $- $ 2, 000 $- $ 1, 938 Unmet/Overmet Need $ 8, 000 $ 6, 907 Unmet Financial Need for Dependent Students at Public 4 -Year Institutions by Parental Income 2015 -16 90 -100 100 -125 125 -150 150 -200 GT 200 $40 -50 50 -60 60 -70 Parents' Income ($000) Source: NPSAS 2016 70 -80 80 -90
$ 7, 683 30 -40 40 -50 $ 6, 820 $ 7, 678 $ 8, 282 10 -20 $ 8, 000 $ 7, 793 $ 8, 303 LT 10 $ 9, 000 Unmet Financial Need for Dependent Students at Public 2 -Year Institutions by Parental Income 2015 -16 $ 5, 626 $ 7, 000 $ 5, 000 $ 4, 000 $ 2, 306 $ 3, 000 $ 2, 000 $- 90 -100 $- 80 -90 $- $- $ 1, 000 $- Unmet/Overmet Need $ 6, 000 $20 -30 50 -60 60 -70 Parents' Income ($000) Source: NPSAS 2016 70 -80 100 -125 125 -150 150 -200 GT 200
Unmet Financial Need for Dependent Students at Private 4 -Year Institutions by Parental Income 2015 -16 40 -50 50 -60 $ 7, 115 $ 7, 400 $ 8, 000 $ 7, 558 $ 8, 762 $ 10, 000 $ 8, 293 $ 11, 453 $ 12, 000 $ 6, 000 $- $- $- $ 2, 000 $- $ 1, 013 $ 4, 000 $ 3, 489 $ 3, 943 Unmet/Overmet Need $ 12, 604 $ 14, 000 $LT 10 10 -20 20 -30 30 -40 60 -70 Parents' Income ($000) Source: NPSAS 2016 70 -80 80 -90 90 -100 100 -125 125 -150 150 -200 GT 200
$ 13, 342 $ 13, 264 20 -30 30 -40 40 -50 50 -60 60 -70 $ 10, 000 $ 6, 901 $ 8, 508 $ 8, 000 $ 6, 000 $ 4, 154 $ 4, 000 $ 2, 000 $- $- $- $ 469 Work-Study + Loans + Unmet Need $ 12, 000 $ 11, 916 $ 13, 160 $ 13, 435 $ 14, 000 $ 13, 855 $ 16, 000 $ 11, 801 Student Work/Loan Burden for Dependent Students at Public 4 -Year Institutions by Parental Income 2015 -16 125 -150 150 -200 GT 200 $LT 10 10 -20 Parents' Income ($000) Source: NPSAS 2016 70 -80 80 -90 90 -100 100 -125
$ 8, 577 30 -40 40 -50 $ 6, 756 $ 8, 000 $ 7, 887 $ 8, 464 $ 9, 000 $ 8, 600 $ 9, 049 $ 9, 326 $ 10, 000 Student Work/Loan Burden for Dependent Students at Public 2 -Year Institutions by Parental Income 2015 -16 $ 6, 000 $ 5, 000 $ 3, 435 $ 4, 000 $ 3, 000 $ 2, 000 $ 1, 000 $- $- $ 334 Work-Study + Loans + Unmet Need $ 7, 000 90 -100 100 -125 125 -150 150 -200 $LT 10 10 -20 20 -30 50 -60 60 -70 Parents' Income ($000) Source: NPSAS 2016 70 -80 80 -90 GT 200
Student Work/Loan Burden for Dependent Students at Private 4 -Year Institutions by Parental Income 2015 -16 $ 11, 872 $ 10, 543 $ 9, 798 60 -70 $ 15, 000 $ 11, 046 50 -60 $ 15, 080 $ 15, 760 $ 15, 393 $ 15, 581 $ 16, 017 $ 18, 156 $ 20, 000 $ 10, 000 $ 6, 611 $- $ 5, 000 $- Work-Study + Loans + Unmet Need $ 19, 679 $ 25, 000 $LT 10 10 -20 20 -30 30 -40 40 -50 Parents' Income ($000) Source: NPSAS 2016 70 -80 80 -90 90 -100 100 -125 125 -150 150 -200 GT 200
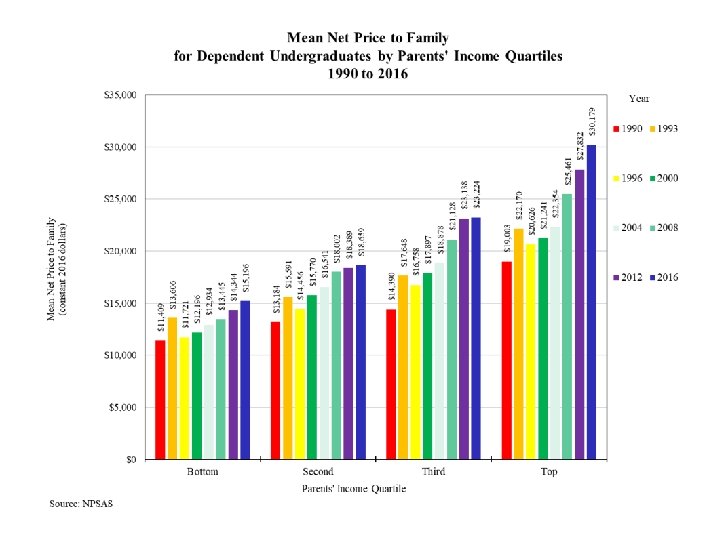
$ 19, 168 $ 20, 241 20 -30 $ 20, 225 10 -20 $ 17, 563 $ 14, 697 LT 10 $ 15, 000 $ 15, 542 $ 14, 665 $ 20, 000 $ 15, 005 Cost of Attendance less Total Grants 60 -70 70 -80 $ 27, 804 $ 25, 183 $ 24, 808 $ 23, 687 $ 25, 000 $ 22, 288 $ 30, 000 $ 21, 886 Net Price to Family for Dependent Students at Public 4 -Year Institutions by Parental Income 2015 -16 $ 10, 000 $ 5, 000 $30 -40 40 -50 50 -60 Parents' Income ($000) Source: NPSAS 2016 80 -90 90 -100 100 -125 125 -150 150 -200 GT 200
10 -20 20 -30 $ 13, 210 $ 13, 550 $ 13, 595 $ 12, 953 $ 12, 509 $ 9, 792 $ 9, 022 $ 10, 000 $ 9, 142 $ 9, 446 Cost of Attendance less Total Grants $ 12, 000 $ 11, 879 $ 11, 049 $ 14, 000 $ 13, 053 $ 16, 000 $ 12, 474 Net Price to Family Burden for Dependent Students at Public 2 -Year Institutions by Parental Income 2015 -16 $ 8, 000 $ 6, 000 $ 4, 000 $ 2, 000 $LT 10 30 -40 40 -50 50 -60 60 -70 Parents' Income ($000) Source: NPSAS 2016 70 -80 80 -90 90 -100 100 -125 125 -150 150 -200 GT 200
70 -80 80 -90 90 -100 $ 32, 203 $ 29, 505 $ 27, 704 $ 25, 459 60 -70 $ 20, 871 $ 24, 310 $ 27, 372 $ 20, 000 $ 18, 692 $ 25, 000 $ 21, 116 $ 30, 000 $ 19, 362 Cost of Attendance less Total Grants $ 35, 000 $ 29, 963 $ 40, 000 $ 36, 254 $ 38, 577 $ 45, 000 $ 42, 521 Net Price to Family Burden for Dependent Students at Private 4 -Year Institutions by Parental Income 2015 -16 $ 15, 000 $ 10, 000 $ 5, 000 $LT 10 10 -20 20 -30 30 -40 40 -50 50 -60 Parents' Income ($000) Source: NPSAS 2016 100 -125 125 -150 150 -200 GT 200
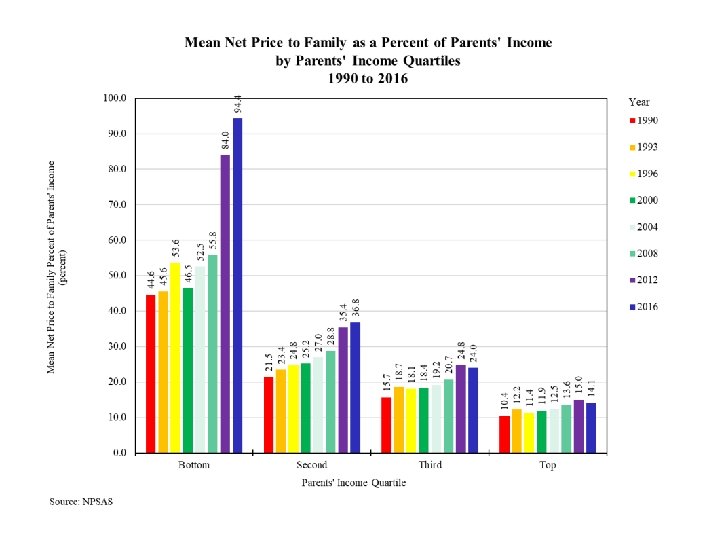
Net Price to Family as a Percent of Parents' Income for Dependent Students in Public 4 -Year Institutions by Parental Income 150. 0% 455. 9% Net Price to Family / Mean Parents' Income 125. 0% 95. 6% 100. 0% 455. 9% 75. 0% 58. 6% 50. 0% 44. 5% 39. 2% 34. 8% 31. 2% 27. 0% 25. 8% 25. 0% 23. 4% 21. 1% 18. 1% 14. 7% 9. 2% 0. 0% LT 10 10 -20 20 -30 30 -40 40 -50 50 -60 60 -70 Parents' Income ($000) Source: NPSAS 2016 70 -80 80 -90 90 -100 100 -125 125 -150 150 -200 GT 200
322. 8% 150. 0% Net Price to Family as a Percent of Parents' Income for Dependent Students in Public 2 -Year Institutions by Parental Income 322. 8% Net Price to Family / Mean Parents' Income 125. 0% 100. 0% 75. 0% 60. 3% 50. 0% 36. 0% 27. 7% 25. 0% 24. 8% 22. 7% 20. 1% 15. 9% 14. 7% 13. 7% 12. 1% 10. 0% 7. 7% 0. 0% LT 10 10 -20 20 -30 30 -40 40 -50 50 -60 60 -70 Parents' Income ($000) Source: NPSAS 2016 70 -80 80 -90 90 -100 100 -125 125 -150 150 -200 GT 200
609. 4% 150. 0% Net Price to Family as a Percent of Parents' Income for Dependent Students in Private 4 -Year Institutions by Parental Income 609. 4% 137. 7% Net Price to Family / Mean Parents' Income 125. 0% 100. 0% 74. 3% 75. 0% 69. 6% 46. 4% 50. 0% 46. 5% 42. 3% 36. 9% 35. 4% 31. 1% 28. 7% 28. 2% 21. 3% 25. 0% 11. 9% 0. 0% LT 10 10 -20 20 -30 30 -40 40 -50 50 -60 60 -70 Parents' Income ($000) Source: NPSAS 2016 70 -80 80 -90 90 -100 100 -125 125 -150 150 -200 GT 200
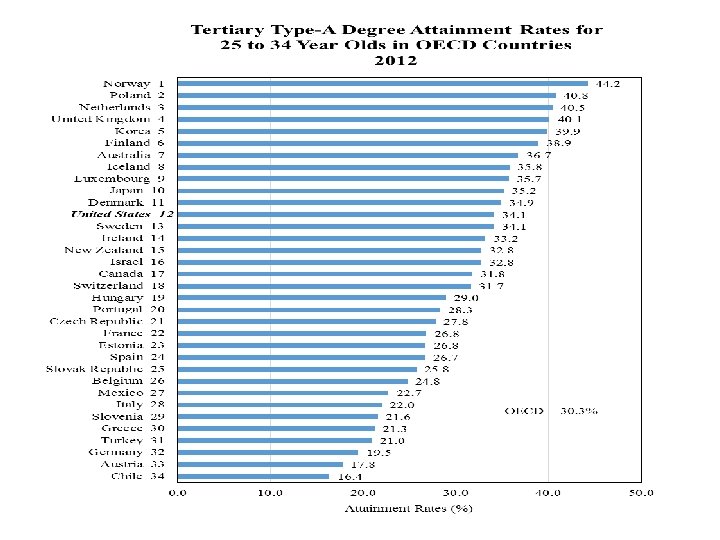
Tertiary Type-A Degree Attain 25 -34 yr olds OECD 2003
Restoring College Affordability Federal • $13, 000 Pell Grant maximum award • $2, 000 Super Pell to fund negative EFC calculated from FAFSA • Universal income contingent education loan repayment • Universal college work-study for all students States • Require 50: 50 match to federal Pell Grant Institutions • Continued eligibility for Title IV participation contingent on progress toward broadening enrollment of students from low income families
Contact Information: Email to request Power. Point from: tom@postsecondary. org