EKG 101 Introduction Scott E Ewing DO Lecture


 n n Dutch doctor and physiologist Invented the first")


 and beginning of")


 Interval?")


- Slides: 75
EKG 101 - Introduction Scott E. Ewing DO Lecture #1
Introduction Electrophysiology n Anatomy n Depolarization n EKG Paper n Lead Placement n Normal EKG n Waves / Intervals / Segments n
Cardiac Action Potential n n SA node, AV node, Purkinje cells display pacemaker activity (phase 4 depolarization) Body surface manifestation of the depolarization and repolarization waves n n n P wave – atrial depolarization QRS – ventricular muscle depolarization T wave – ventricular repolarization PR interval – conduction time from atrium to ventricle QRS duration – time required for all of the ventricular cells to be activated (i. e. the intraventricular conduction time) QT interval – duration of the ventricular action potential
Cardiac Action Potential n Phase 0: Rapid depolarization n Phase 1: Early repolarization n Calcium continues to flow in Potassium continues to flow out Phase 3: Rapid repolarization n n Sodium channels close Phase 2: Plateau n n Sodium moves rapidly into the cell Calcium moves slowly into the cell Calcium channels close Potassium flows out rapidly Active transport Na+ / K+ pump Phase 4: Resting n n Cell membrane is impermeable to sodium Potassium moves out
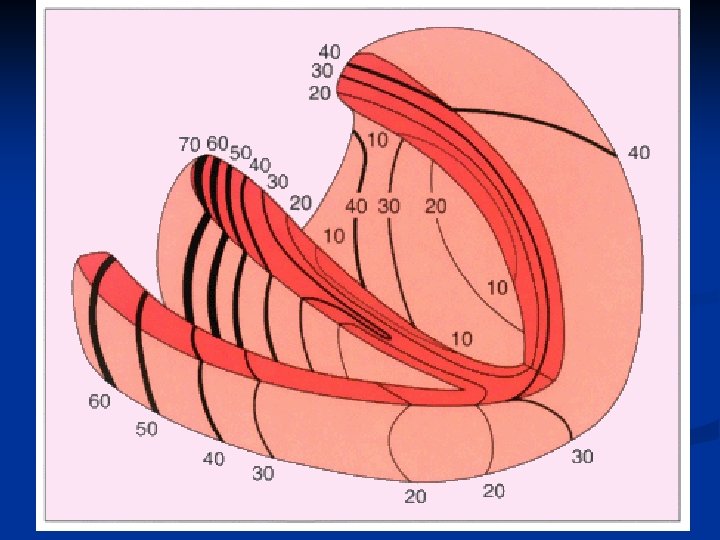
Cardiac Physiology: Sequence of Excitation
Depolarization
EKG Paper n n n Time intervals indicated for the thick and thin vertical grid lines Amplitudes indicated for the thick and thin horizontal grid lines Each small square 0. 04 s × 0. 1 m. V and each large square 0. 20 s × 0. 5 m. V
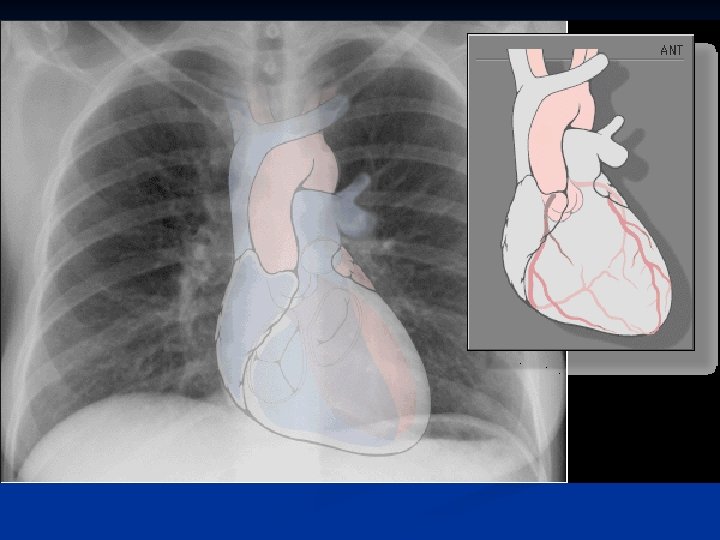
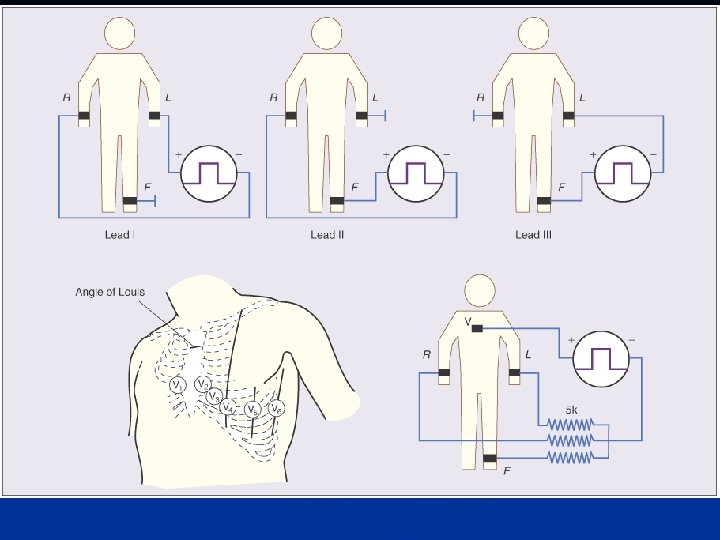
EKG Limb Leads
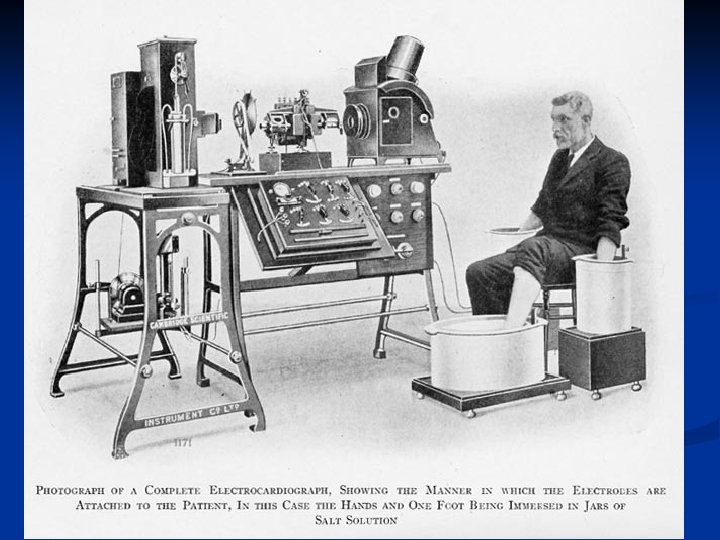
Willem Einthoven (1860 – 1927) n n Dutch doctor and physiologist Invented the first practical electrocardiogram in 1903 Nobel Prize Medicine in 1924 Died in Leiden in the Netherlands and is buried in the graveyard of the Reformed Church at 6 Haarlemmerstraatweg in Oegstgeest
Lippmann Electrometer
String Galvanometer
Evolution of the Electrocardiogram n n n Upper record was made using the capillary electrometer Middle record is a "corrected curve“ Lower record was made using Einthoven's string galvanometer
Augmented Limb Leads
EKG Frontal Plane
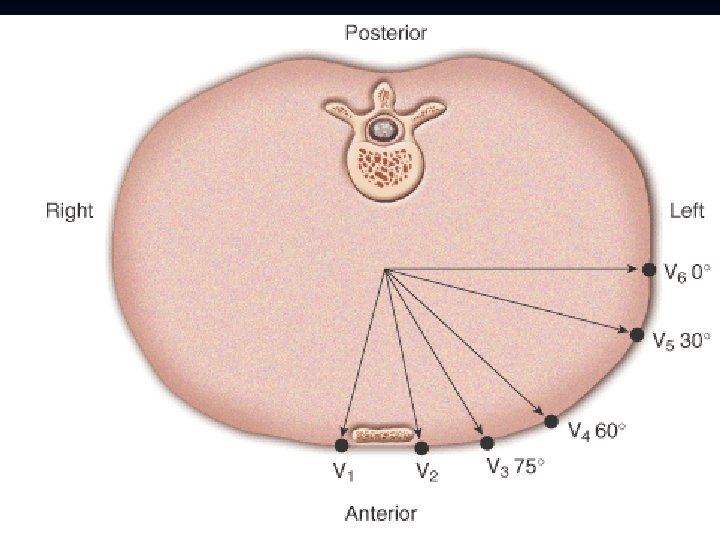
EKG Precordial Leads
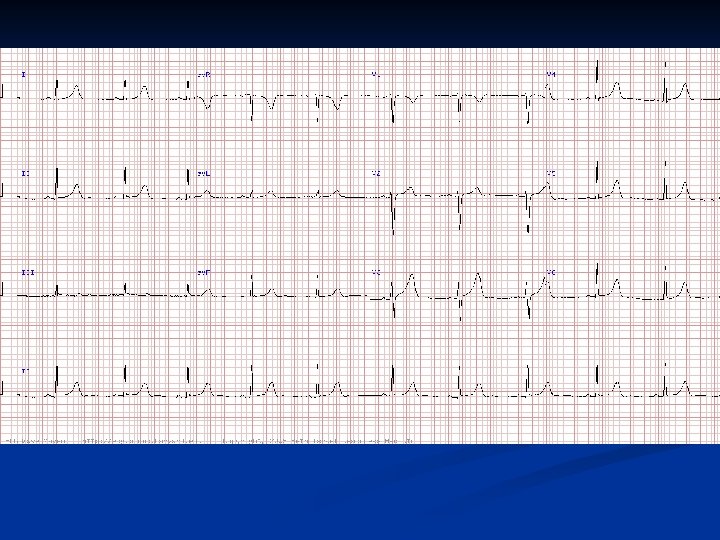
Normal EKG
Normal Findings n n n n n Tall R waves Prominent U waves ST segment elevation (high takeoff, benign early repolarization) Exaggerated sinus arrhythmia Sinus bradycardia Wandering atrial pacemaker Wenckebach phenomenon Junctional rhythm 1 st degree heart block
Waveform Review
P Wave
P Wave
P Wave n Atrial activation begins in the SA node Spreads in radial fashion to depolarize the right atrium, interatrial septum, then the left atrium n Last area of the left atrium to be activated is the tip of the left atrial appendage n n Normal amplitude Seldom exceeds 0. 25 m. V (2. 5 small squares) normally in limb leads n In precordial leads, positive component is normally less than 0. 15 m. V n
P Wave Characteristics Positive in leads I and II n Best seen in leads II and V 1 n Commonly biphasic in lead V 1 n < 120 ms (3 small squares) in duration n < 100 ms (2. 5 small squares) in amplitude n
P Wave – Lead V 1
P Wave – Lead II
PR Interval / Segment
PR Interval / Segment
PR Interval n Beginning P wave to beginning QRS complex Interval between onset atrial depolarization and onset ventricular depolarization n Time required for the activation impulse to advance from atria through the AV node, bundle of His, bundle branches, Purkinje fibers until ventricular myocardium begins to depolarize n n Normal PR Interval 120 – 200 ms (adults) n Should be taken from lead with the largest and widest P wave and longest QRS duration n
PR Segment n Horizontal line between the end of the P wave and the beginning of the QRS complex Duration depends on the duration of the P wave as well as the impulse conduction through the AV junction n Usually isoelectric, however it is often displaced in a direction opposite to the polarity of the P wave n Depressed in most of the conventional leads except a. VR n Displacement is mainly due to atrial repolarization n
PR Interval – Lead II
QRS Complex
QRS Complex
QRS Complex Q wave – Any initial negative deflection n R wave – Any positive deflection n S wave – Any negative deflection after an R wave n
QRS Complex
QRS Complex n Resultant electrical forces generated from ventricular depolarization n n Begins at middle third of left interventricular septal surface Spreads in a rightward direction RV begins to depolarize shortly after initiation of LV activation Basal portion of septum and posterobasal portion of LV free wall are last areas of depolarization LV contributes most of the QRS forces due to larger muscle mass
Ventricular Depolarization
QRS Complex QRS duration represents duration of ventricular activation n Should be measured from lead with widest QRS complex n n n Traditionally measured from the limb leads, but V 1 or V 2 may have the widest complex Normal QRS varies between 60 – 110 ms
QRS Complex Lead I: usually records a dominant R wave n Lead II: invariably has prominent R wave since mean vector is always toward II if QRS axis is normal n Lead a. VR: always records negative deflection n Lead III: variable n
QRS Complex – Lead V 3
Other QRS Waveforms
ST Segment
ST Segment n Segment between end of QRS complex (J point) and beginning of T wave Represents state of unchanged polarization between end of depolarization and beginning of repolarization n Stage when terminal depolarization and starting repolarization are superimposed and cancel each other n
ST Segment n Most important information regarding ST segment is presence or absence and degree of displacement from isoelectric line TP segment is used as reference baseline n Limb leads – elevation or depression < 1 mm n Precordial leads – elevation sometimes seen and normal in V 2 V 3 (< 2 mm), rarely > 1 mm in V 5 V 6 n Any ST depression in precordial leads is abnormal (normal vector in horizontal plane is anterior and leftward) n
ST Segment – Lead a. VF
T Wave
T Wave n Represents potential for ventricular repolarization Proceeds in general direction of ventricular excitation n Polarity of resultant T wave is similar to that of the QRS vector n Upright in I, II, V 5 V 6 n Inverted in a. VR n When inverted in 2 or more of right precordial leads, referred to as persistent juvenile pattern n
T Wave n Limb leads Tallest in lead II n Normally < 6 mm in all limb leads n Should never be < 0. 5 mm n n Precordial leads: Tallest in V 2 V 3 (average 6 mm) n Smaller in left precordial leads n
T Wave – Lead a. VF
QT Interval
QT Interval Represents duration of ventricular electrical systole n Measured from beginning of QRS complex to end of the T wave n Lead with a large T wave and distinct termination is used n Leads V 2 V 3 are usually best for this specific measurement n
QT Interval n Varies with heart rate Lengthens as heart rate decreases n Shortens as heart rate increases n Increases slightly with age n Diurnal variation of QT has been documented n n Longer during sleep than during waking hours
QT Interval n Normal = 350 – 450 ms for HR=60 n n Bazett's correction n n For every 10 beat increase or decrease of the rate, 20 ms is deducted or added to the QT QTc = measured QT (secs) divided by square root of RR interval (secs) Obvious abnormality if QT > ½ RR interval
QT Interval – Lead a. VF
QT Interval?
QT Interval?
U Wave
U wave n Small, low frequency deflection that appears after the T wave n Genesis is controversial n Afterpotentials of ventricular myocardium n Repolarization of the Perkinje fibers n Amplitude is proportional to T wave n Usually 5 25% of T wave voltage n Largest in leads V 2 V 3 n Prominent during slower heart rates n Initial portion is normally steeper than terminal portion
QT(U) Interval?
8 -Step Method ECG Interpretation 1. 2. 3. 4. 5. 6. 7. 8. Rate Rhythm Axis P wave PR interval QRS complex QT interval ST segment and T wave
EKG Frontal Plane
His-Purkinje Conduction System
EKG Precordial Leads
Waveform Review
Evolution of the Electrocardiogram 1. 2. 3. Upper part: Waller 1887. t=time, h=external pulsation from heartbeat usually called cardiogram (after Marey), e=electrical heart action, showing 2 peaks directed downwards. The cardiac action current is rather inconspicious and was later often confused with the cardiogram above it Einthoven's tracing as published in 1902, also with Lippmans electrometer. Four peaks (ABCD) directed upwards because of reversed connection. Timescale in 0. 1 sec above tracing. Below that, the same tracing corrected mathematically. Timescale in 0. 1 sec is stretched (S); the four peaks in the corrected tracing are now called PQRST One of the first electrocardiograms with the string galvanometer as published in 1902 and 1903
QRS Complex
QRS Complex