Physical and Chemical Oceanography Acidity and Alkalinity p


 19. 345 sodium")


 – 1. Surface zone – varies in places from absent")

")


 water from seawater using one of")


 • Heat capacity of a substance is the amount")


- Slides: 139
Physical and Chemical Oceanography
Acidity and Alkalinity • p. H measures acidity or alkalinity. • Seawater is affected by solutes. The relative concentration of positively charged hydrogen ions and negatively charged hydroxyl ions determines the water’s acidity or alkalinity. – It can be written like this: • Acidic solutions have a lot of hydrogen ions, it is considered an acid with a p. H value of 0 to less than 7. • Solutions that have a lot of hydroxyl ions are considered alkaline. They are also called basic solutions. The p. H is higher than 7, with anything over 9 considered a concentrated alkaline solution.
Carbon dioxide is imporant in controlling the acidity of seawater • Major sources of carbon dioxide are respiration and decay. • Major sinks are photosynthesis and construction of carbonate shells. FIGURE 5. 19 b: Photosynthesis and Respiration.
The p. H Scale FIGURE 5. 18: The p. H scale.
Carbon Species and the CO 2 system in the oceans • Dissolved carbon appears in water in 3 forms: – Carbon dioxide (CO 2) – Bicarbonate (HC 03 -) – Carbonate (CO 32 -) • Basic solutions are dominated by carbonate. • Acidic solutions are dominated by carbon dioxide. FIGURE 5. 19 a: Distribution of carbon species in water.
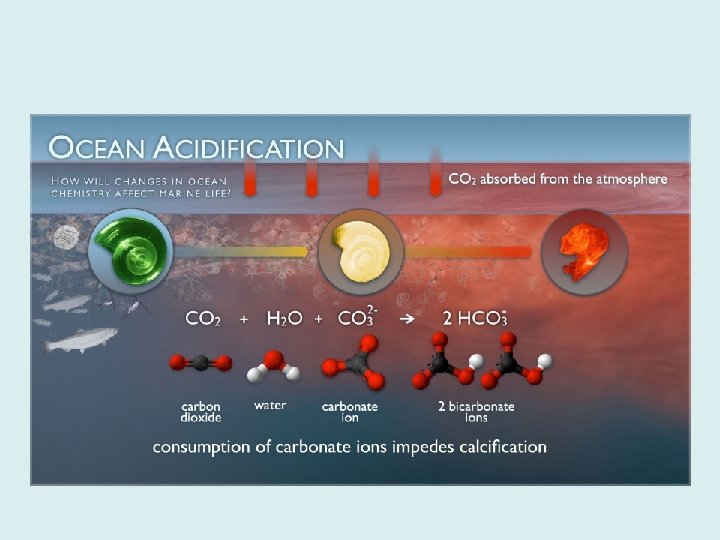
The CO 2 System CO 2 combines with the water to produce carbonic acid, which releases H+ ions.
CO 2 + H 2 O H 2 CO 3 H+ + HCO 3 - H+ + CO 3 -2 • Changing the amount of CO 2 shifts the reaction to either the right or left of the equation. – Adding CO 2 shifts the reaction to the right and produces more H+ ions. • This makes the water more acidic. – Removing CO 2 shifts the reaction to the left, combining H+ ions with carbonate and bicarbonate ions. • This makes the water less acidic.
• Dissolved CO 2 in water acts as a buffer – A buffer is a substance that prevents large shifts in p. H. FIGURE 5. 19 d: Carbonate buffer.
• Dissolution of carbonate shells in deep water occurs because: – cold water under great pressure has a high saturation value for CO 2 – the additional CO 2 releases more H+ ions making the water acidic • Carbonate sediments are stable and do not dissolve in warm, shallow water because: – under low pressure – contains less dissolved CO 2 – is less acidic than the deep water.
Relationship of Atm CO 2 and Seawater p. H
• Salinity is the total amount of salts dissolved in the water. – It is measured in parts of salt per thousand parts of salt water and is expressed as ppt (parts per thousand) or abbreviated as o/oo. Average salinity of the ocean is about 35 o/oo.
Ions in the water • The chemical composition of sea water remains fairly constant and the salinity is mainly due to the presence of sodium and chloride ions. – Sulphate – Magnesium – Hydrogen carbonate – Potassium also present 7 a
Changes to sea water • Although the composition of sea water remains fairly constant, and probably has done so for millions of years, local changes can occur – Volcanic activity – Runoff – Atmospheric dissolution 7 a
Changes in sea water • Gases emitted from volcanoes include – – carbon dioxide sulfur dioxide hydrogen sulfide hydrogen chloride • They dissolve in atmospheric water (clouds) and enter the sea water as rain • Submerged volcanoes at tectonic plates emit gases (including chlorine) and gases from volcanoes are the major source of chloride ions present in sea water 7 a
Why the Seas Are Salty • A source of sea salts appears to be minerals and chemicals eroding and dissolving into fresh water flowing into the ocean. • Waves and surf appear to contribute by eroding coastal rock. • Hydrothermal vents change seawater by adding some materials while removing others. • Scientists believe these processes all counterbalance so the average salinity of seawater remains constant. • 6 The ocean is said to be in - 17 chemical equilibrium.
• Salt sinks include the following: – Wind-blown spray carries minute droplets of saltwater inland. – Adsorption of ions onto clays and some hydrogenous minerals. – Shell formation by organisms. • Evaporation removes only water molecules. – Remaining water becomes increasingly saline, eventually producing a salty brine. – If enough water evaporates, the brine becomes supersaturate and salt deposits begin to precipitate forming evaporite minerals.
The Effects of Evaporation and Precipitation on Salinity • Evaporation increases the concentration of salt, leading to the water becoming hypersaline – this may happen in a lagoon – where high temperatures increase evaporation – effect is increased where there is less mixing with sea water • Dead Sea: extreme example of evaporation leading to the accumulation of solutes • Salinity is 10 x greater than normal 7 b
• Salt sources include: – weathering of rocks on land – the reaction of lava with sea water • Weathering mainly involves the chemical reaction between rock and acidic rainwater. – Acid rain is produced by the interaction of carbon dioxide and rainwater, which forms carbonic acid. FIGURE 5. 06: Sedimentary cycle.
Composition of seawater • Processes affecting seawater salinity • Processes that decrease salinity (add water) • • Precipitation Runoff from land Icebergs melting Sea ice melting • Processes that increase salinity (remove water) • Evaporation • Formation of sea ice 7 b
• Salinity in the ocean is in a steady-state condition. • This is because the amount of salt added to the ocean (input from source) equals the amount removed (output into sinks). More later…
Runoff • Runoff refers to the flow of water from land, arising from rain or from melting snow and ice. • As part of the hydrological cycle, much of this water may eventually drain into the oceans either directly or from rivers 7 a
Runoff • Water passing through soil, or water from urban runoff flowing into drains may pick up a variety of pollutants – Pesticides – Fertilizers – Oil derived substances • Some pollutants have initially a very low concentration, but if taken up by organisms the pollutants can pass through food chains, increasing the concentration at each trophic level
• Trace elements occur in minute quantities. – They are usually measured in parts per million (ppm) or parts per billion (ppb). • Even in small quantities they can be important for either promoting or killing life.
Bioaccumulation – an example • Mercury compounds were released in the industrial wastewater entering Minamata Bay from 1932 until 1968. • These compounds accumulated in shellfish and other marine organisms • When shellfish were eaten by humans, the mercury compounds cased neurological disorders, paralysis and death
Ions in the water • The chemical composition of sea water remains fairly constant and the salinity is mainly due to the presence of sodium and chloride ions. – Sulphate – Magnesium – Hydrogen carbonate – Potassium also present 7 a
Dissolved Gases • Gases dissolved in sea water are in equilibrium with the atmosphere • However, the actual concentration of gases in water depends on their relative solubility and the temperature and salinity of the water – Nitrogen – Oxygen – Carbon dioxide
• In order of decreasing abundance the major gases in the sea are: – – nitrogen oxygen carbon dioxide the noble gases: • argon (Ar) • neon (Ne) • helium (He) • Nitrogen and the noble gases are considered to be inert because they are chemically nonreactive.
Dissolved Gases • Nitrogen: may be fixed by nitrogen fixing microorganisms into products which are useable by other organisms • Oxygen: essential for respiration • Carbon dioxide: used in photosynthesis
The Principle of Constant Proportions • In seawater no matter how much the salinity varies, the proportions of several key inorganic elements and compounds do not change. Only the amount of water and salinity changes. – This constant relationship of proportions in seawater is called the principle of constant proportions. – This principle does not apply to everything dissolved in seawater – only the dissolved salts. Dissolved Solids in Seawater • Next to hydrogen and oxygen, chloride and sodium are the most abundant chemicals in seawater.
So about those ions… Ion chloride Mean concentration in seawater (ppt) 19. 345 sodium 10. 752 sulphate 2. 701 magnesium 1. 295 calcium 0. 416 hydrogen carbonate 0. 145
• Chlorinity is the amount of halogens in seawater and is expressed as grams/kilogram or o/oo. • Halogens are: – – chlorine bromine iodine Fluorine • Salinity is equal to 1. 8065 times chlorinity. • Salinometers determine salinity from the electrical conductivity produced by the dissolved salts.
Determining Salinity, Temperature, and Depth • • • If you know how much you have of any one seawater chemical, you can figure out the salinity using the principle of constant proportions. Chloride accounts for 55. 04% of dissolved solids – determining a sample’s chlorinity is relatively easy. The formula for determining salinity is based on the chloride compounds: salinity ‰ = 1. 80655 x chlorinity ‰ Sample of seawater is tested at 19. 2‰ chlorinity: salinity ‰ = 1. 80655 x 19. 2‰ salinity ‰ = 34. 68‰ Most commonly, salinity is determined with a salinometer. This device determines chlorinity and calculates the salinity based on the water’s electrical conductivity. It is accurate. The primary tool to measure the properties of seawater is the conductivity, temperature, and depth (CTD) sensor. The CTD profiles temperature and salinity with depth. Another less accurate way to determine salinity is with a refractometer.
Salinity, Temperature, and Water Density • Although the ocean’s average salinity is about 35‰, it isn’t uniform. • Precipitation and evaporation have opposite effects on salinity. – – Rainfall decreases salinity by adding fresh water. Evaporation increases salinity by removing fresh water. Freshwater input from rivers lowers salinity. Abundant river input and low evaporation results in salinities well below average. • Salinity and temperature also vary with depth. – Density differences causes water to separate into layers. – High-density water lies beneath low-density water.
Ocean Water Density • Seawater density varies with salinity and temperature. – This causes seawater to stratify, or form layers. • Dense water is heavy and sinks below less dense layers. The three commonly found density layers are:
Ocean Water Density (continued) – 1. Surface zone – varies in places from absent to 500 meters (1, 640 feet). In general it extends from the top to about 100 meters (328 feet). This zone accounts for about only 2% of the ocean’s volume. – 2. Thermocline – separates the surface zone from the deep zone. It only needs a temperature or salinity difference to exist. This zone makes up about 18% of the ocean’s volume. – 3. Deep zone – lies below thermocline. It is a very stable region of cold water beginning deeper than 1, 000 meters (3, 280 feet) in the middle latitudes, but is shallower in the polar regions. The deep zone makes up about 80% of the ocean’s volume.
Salinity, Temperature, and Water Density (continued)
• In some places surface water and deep water are separated by a halocline. – The halocline is a zone of rapid change of salinity with water depth. • Water stratification (layering) within the ocean is more pronounced between 40 o. N and 40 o. S.
Variations in the ocean’s surface temperature and salinity with latitude Figure 14. 3
Salinity changes with latitude due to variations in precipitation and evaporation • Highest ocean salinity is between 20 -30 o north and south or the equator, because evaporation exceeds precipitation. • Salinity at the equator and poleward of 30 o is low because evaporation is less than precipitation. FIGURE 5. 12 b: Latitudinal variations in salinity and “dryness. ”
Halocline • There is a similar gradient of salinity in the oceans. As the salinity of water increases, the density of water also increases. There is a tendency therefore, for water with as lower salinity, and therefore lower density, to float on top of water with a higher salinity. This effect results in a general increase in salinity as the depth increases, with a region referred to as the halocline where there is a significant change in salinity as the depth increases.
Ocean temperature • Temperature variation with depth • Low-latitudes • High temperature at the surface • Rapid decrease in temperature with depth (thermocline) • High-latitudes • Cooler surface temperatures • No rapid change in temperature with depth
Thermocline • There is a relatively shallow layer of warn water floating on a deep layer of colder water. The interface between the two layers, where the temperature decreases abruptly as the depth increases is referred to as thermocline. The surface layer of water in an ocean may reach a temperature of 25 °C or higher, the temperature decreases to about 1 °C at depths of over 2000 meters
• The density of water depends on temperature and salinity. There is a tendency for warm water to form a layer on top of colder, denser water. – This results in the formation of a temperature gradient (temp generally decreases as depth increases) – Relatively shallow
Variations in ocean water temperature with depth Figure 14. 4
Salinity, Temperature, and Water Density • Water’s density is the result of its temperature and salinity characteristics: – Low temperature and high salinity are features of high-density water. – Relatively warm, low-density surface waters are separated from cool, high-density deep waters by thermocline, the zone in which temperature changes rapidly with depth. – Salinity differences overlap temperature differences and the transition from low-salinity surface waters to high-salinity deep waters is known as the halocline. – The thermocline and halocline together make the pycnocline, the zone in which density increases with increasing depth.
Addition of salt modifies the properties of water. • Pure water freezes at 0 o. C. • Adding salt increasingly lowers the freezing point. – This is because salt ions interfere with the formation of the hexagonal structure of ice.
Effects of Salinity on the Maximum. Density and Freezing-Point Temperatures of Seawater FIGURE 5. 08: Effects of salinity on the maximum-density and freezing-point temperatures of seawater.
• Ocean surface temperature strongly correlates with latitude. – This is because insolation – the amount of sunlight striking Earth’s surface – is directly related to latitude. • Ocean isotherms – lines of equal temperature – generally trend eastwest except where deflected by currents. • Ocean currents carry warm water poleward on the western side of ocean basins. • They carry cooler water equatorward on the eastern side of the ocean.
Density of sea water is a function of temperature, salinity and pressure • Density increases as temperature decreases and as salinity and pressure increase. • Pressure increases regularly with depth, but temperature and salinity are more variable.
• Wind blowing across the surface of the sea can set up turbulence and currents, resulting in mixing of the surface layers, down to a depth of about 200 meters. Mixing can also occur as a result of temperature changes; if the surface layer cools, for example, the density will increase and the water will tend to sink
• Higher salinity water can rest above lower salinity water if: – the higher salinity water is sufficiently warm – the lower salinity water is sufficiently cold • Pycnocline is a layer within the water column where water density changes rapidly with depth. FIGURE 5. 14 a: Seawater Density.
Thermocline, Halocline, and Pycnocline FIGURE 5. 14 b: Thermocline, Halocline, and Pycnocline.
• The water column in the ocean can be divided into the: – surface layer – pycnocline – deep layer FIGURE 5. 14 c: Density Structure of the Oceans.
The Surface Layer • About 100 m thick • Comprises about 2% of the ocean volume • Is the most variable part of the ocean because it is in contact with the atmosphere. • Is less dense than the layers below because of its lower salinity or higher temperature.
The Pycnocline • Is transitional between the surface and deep layers. • Comprises 18% of the ocean basin. • In the low latitudes, the pycnocline coincides with thermocline. • In the mid-latitudes it coincides with the halocline.
Variations in ocean water density with depth Figure 14. 5
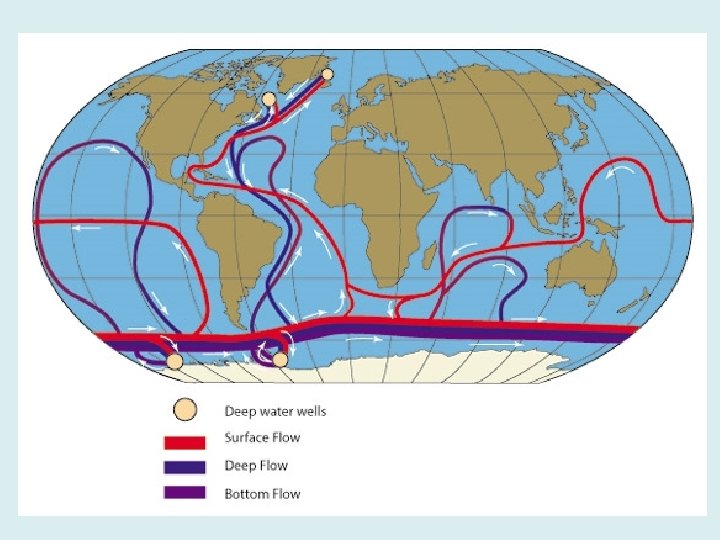
The Deep Layer • Represents 80% of the ocean volume. • Water in the deep layer originates at the surface in high latitudes, where it: – cools – becomes dense – sinks to the sea floor – flows equatorward across the ocean basin
• The solubility and saturation value of gases in sea water increase as: – temperature decreases – salinity decreases – pressure increases • Solubility is a measure of a substance's tendency to dissolve and go into solution. FIGURE 5. 15 a: Solubility of Oxygen.
• Saturation value is the equilibrium amount of gas dissolved in water at an existing temperature, salinity and pressure. – Water is undersaturated when it has the capacity to dissolve more gas. • This means that its gas content is below the saturation value. – Water is saturated when it contains as much dissolved gas as it can hold in equilibrium. • Gas content is at its saturation value. – Water is supersaturated when it contains more dissolved gas than it can hold in equilibrium. • Gas content is then above its saturation value and excess gas will come out of solution.
• The surface layer is usually saturated in atmospheric gases because of direct gas exchange with the atmosphere. • Below the surface layer, gas content reflects the relative importance of: – Respiration – Photosynthesis – Decay – Infusion from volcanic vents
• Table 7. 1 shows the concentration of dissolved oxygen in freshwater, saturated with oxygen, at a range of temperatures. Oxygen is slightly less soluble in saline water than it is in fresh water.
• The concentration of dissolved oxygen in water is very variable and depends upon a number of factors. • As a general rule, as the temperature of water increases, the solubility of oxygen in water decreases.
Dissolved Gases • Gases dissolved in sea water are in equilibrium with the atmosphere • However, the actual concentration of gases in water depends on their relative solubility and the temperature and salinity of the water – Nitrogen – Oxygen – Carbon dioxide
• In order of decreasing abundance the major gases in the sea are: – – nitrogen oxygen carbon dioxide the noble gases: • argon (Ar) • neon (Ne) • helium (He) • Nitrogen and the noble gases are considered to be inert because they are chemically nonreactive.
Dissolved Gases • Nitrogen: may be fixed by nitrogen fixing microorganisms into products which are useable by other organisms • Oxygen: essential for respiration • Carbon dioxide: used in photosynthesis
• The concentration of dissolved oxygen changes as the depth of water changes. It is generally high in the surface layers, but decreases to a minimum as the depth increases, before increasing again as the depth continues to increase. The depth at which the concentration of dissolved oxygen is lowest is referred to as the oxygen minimum layer. This is usually between depths of 100 m and 1000 m.
Mixing In the surface layers of the ocean, the concentration of dissolved oxygen is usually high; indeed the water may become supersaturated with oxygen. This is due to two main processes, turbulence and mixing by waves helping atmospheric oxygen to dissolve, and photosynthesis of algae, which produce oxygen as a by-product. Dissolved oxygen is removed from water by respiration of marine organisms.
Sources and Sinks of Gases FIGURE 5. 15 b: Sources and Sinks of Gases.
• Oxygen tends to be abundant in the water of the surface layer and deep layer, and lowest in the pycnocline. • Surface layer is rich in oxygen because of photosynthesis and diffusion from the atmosphere layer. • Oxygen minimum layer occurs at about 150 to 1500 m below the surface and coincides with the pycnocline. FIGURE 5. 17 a: Vertical O 2 Profiles in the Atlantic Ocean.
The Oxygen Minimum Layer • Sinking food particles settle into this layer and are slowed down by the sharp density gradient. • The food draws large numbers of organisms which respire, consuming oxygen. • Decay of uneaten material consumes additional oxygen. • Density difference prevents mixing downward of oxygen-rich water from the surface or upwards from the deep layer.
• The deep layer is rich in oxygen because its water is derived from cold surface waters that sank to the bottom. • Oxygen consumption by respiration is low because there are fewer organisms in the deep layer. • Anoxic waters contain no oxygen and are inhabited by anaerobic organisms (bacteria).
Jubilee – Mobile Bay
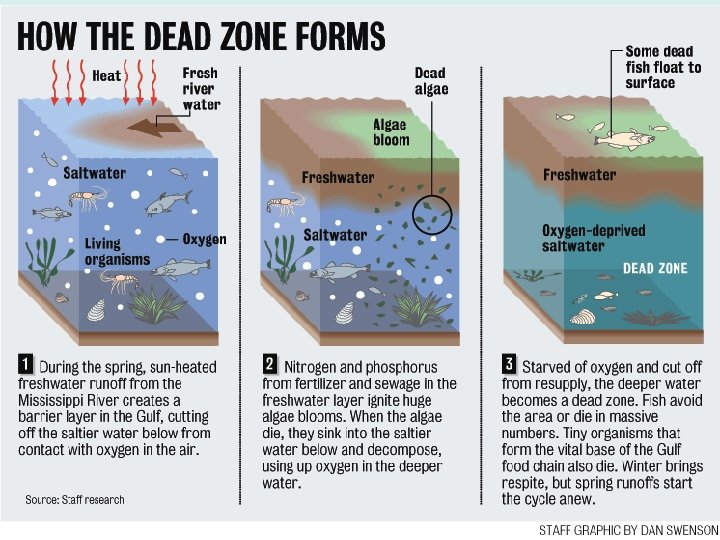
Dead Zone: Background • Occurs in the deepest part of the water where the oxygen levels have fallen below 2 parts per million (the amount of DO needed to survive) • The dead zone is one of the largest hypoxic zones in the world.
Dead Zone: Background cont… • Kills all O 2 dependent sea creatures within zone • In 2005, it was predicted that the dead zone was approximately 4, 564 square miles, however it has reached a maximum of 7, 000 square miles
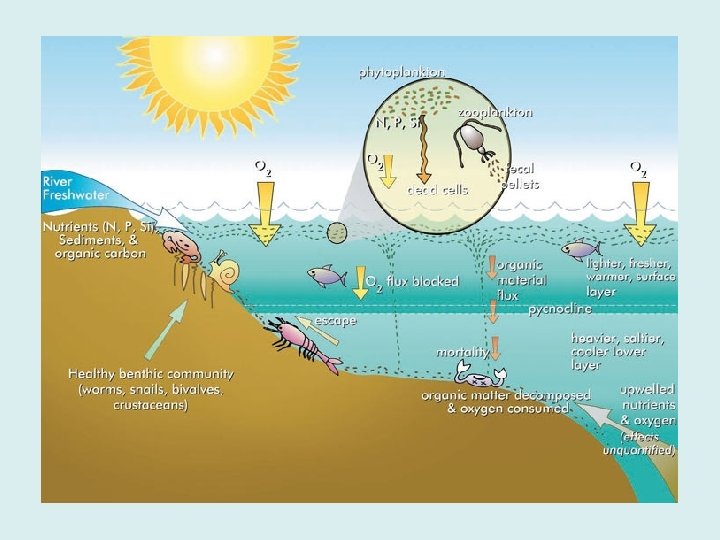
Eutrophication • Eutrophication is the process by which dead organisms are broken down by bacteria • This process uses D. O. in the water • If the dissolved oxygen drops below 2 ppm then other organisms may flee from the area or suffocate
Eutrophication • This area becomes hypoxic and is usually called a dead zone • Dead zones are usually caused by either large scale death in an isolated area such as a poisoned pond • Also caused by large amounts of plant matter dying because of high levels of nutrient influx
Side Effects • Marine animals such as starfish, sea urchins and crabs which cannot move quick enough will most likely die • This can cause the added problem with jellyfish • Jellyfish can survive very low oxygen levels and can fill up the empty area
Jelly Fish • Since jellyfish can not be eaten they are of no economic value • They also affect tourism because who wants to swim with a smack of stinging jellyfish • This is a serious problem in the Black Sea
Dead Zone: History • 1950: First reports of “dead” or lifeless zones off the coast of Mexico by shrimp trawlers. • 1970: Gulf of Mexico’s increasing hypoxic zone is finally investigated by scientists
Dead Zone: History • 1985: Scientists begin tracking the size and timing of the Dead Zone • 1992 -1993: Dead zone increases from just over 4, 000 square feet to a outstanding 7, 000 square feet due to floods. http: //www. usgcrp. gov/usgcrp/images/deadzone. gif
Fertilizer Use • Fertilizer use has increased significantly since the 1950’s • The Green Revolution in the 60’s and 70’s caused larger amounts of fertilizer use in the Mississippi Basin
Fertilizer Use
Nitrogen and Phosphorous • Nitrogen: – Long lived – Is the limiting factor in the oceans • Phosphorous: – Short lived – Is limiting factor in freshwater • Any policy to combat both fresh and sea water eutrophication must address both elements
Nitrogen http: //co. water. usgs. gov/midconherb/images/stlou. fig 3. gif
Size of Dead Zone • The size of dead zone was insignificant during 1988 and 1989 as great droughts hit the Midwest. http: //www. pca. state. mn. us/artwork/indicators/0801 -figure 2 a. gif
Freshwater • The chemical makeup of fresh and salt water is very different • Freshwater contains nitrates so any increase in nitrogen will have little effect • Freshwater though lacks phosphates so an increase in phosphorous will have severe consequences on algae
Saltwater • By the time the fertilizers make it to the ocean the phosphorous has already been used • The nitrogen on the other hand is long lived and not needed in freshwater systems
Land Use • The significant change in land use in the last 70 years had an impact on the Gulf of Mexico. • Missouri River Basin has had hundreds of thousands of acres of forests and wetlands (66 000 acres) replaced with agriculture activity.
Policy • Policy must address the source of the problem • The source is occurring all over the Mississippi Basin • Most of fertilizer comes from the area of Iowa, Illinois and Indiana • Decreasing fertilizer use in this area would the largest effect
Dead Zone: Economic Impacts • Unreliable amount of fish in dead zone so fishermen must travel further for catch • This travel increases the cost of seafood • Quality is also significantly reduced
Dead Zone: Economic Impacts • The seafood business is an estimated $4 billion a year industry, a large and substantial part of our economy • The Gulf of Mexico is responsible for 40% of the US commercial fishing yield; if wiped out entirely the effects could be detrimental nationwide.
Other Examples • Lake Erie dead zone – Caused by phosphorous • Baltic Sea dead zone – Nitrogen use in inland Europe
O 2 -Advection Pattern in the Atlantic Ocean FIGURE 5. 17 b: Dissolved oxygen.
Water is recycled continually between the ocean and the land • The reservoirs of water include: – Oceans: • cover 60% of the northern hemisphere • cover 80% of the southern hemisphere • contain 97% of Earth’s water – Rivers, lakes and glaciers – Groundwater • contains a larger volume of water than all of the combined water in lakes and rivers
• The hydrologic cycle describes the exchange of water between ocean, land atmosphere. – On land precipitation exceeds evaporation. – In the ocean evaporation exceeds precipitation. FIGURE 5. 20: Hydrologic cycle.
Recycling of Water FIGURE 5. 21: Recycling of water. © Ablestock
The ocean is part of a vast biogeochemical system • Rocks on land undergo weathering. • The products are transported to the sea. • They may be deposited directly or used by organisms and later deposited as organic remains or organic wastes. • These sedimentary deposits are buried, lithified and recycled by plate tectonics into new land • The new land then undergoes weathering repeating the cycle.
Biochemical Recycling of Matter FIGURE 5. 22: Biochemical recycling of matter. Adapted from Repeta, D. J. , et al. , Oceanus 35 (1992): 38 -46.
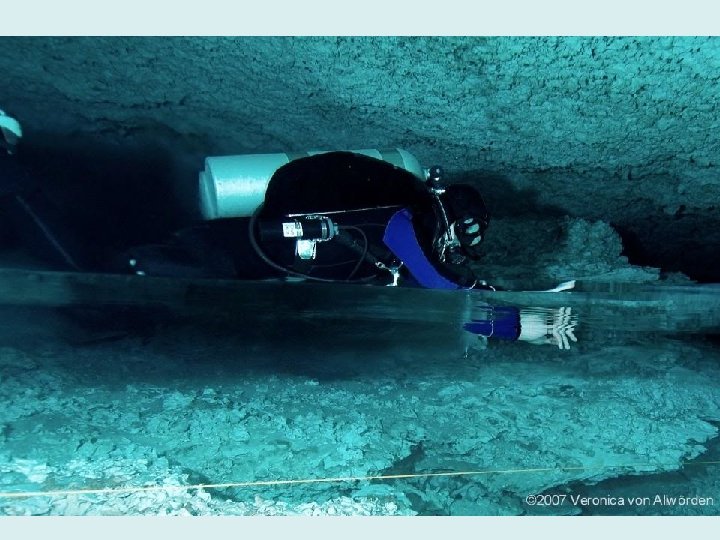
• Water samples must be collected in inert containers and isolated as they are recovered so as to prevent contamination. • The Niskin bottle has valves at each end. – They automatically close when a weight (called a messenger), is sent down the cable and causes the bottle to flip over and seal itself. • Sample depth can be determined from cable inclination and length or with a pulsating sound source.
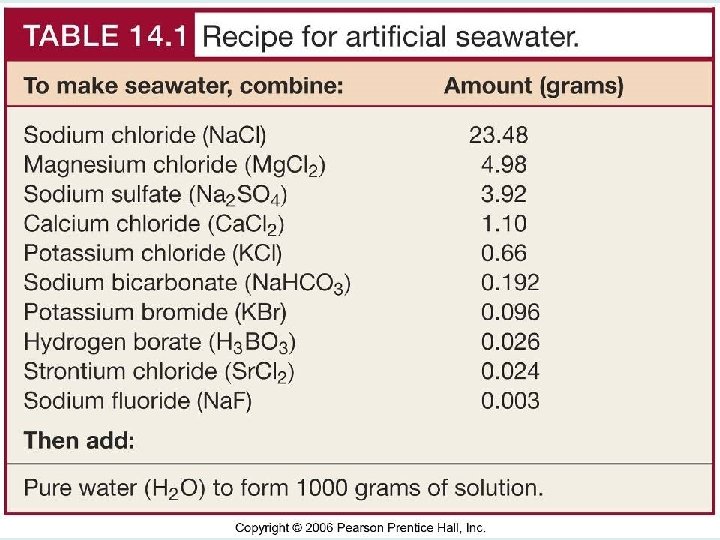
Desalinization is the process of producing potable (drinkable) water from seawater using one of the following methods • Distillation is the evaporation of seawater and the condensation of the vapor. FIGURE 5. B 04: Distillation of seawater. • Freezing produces salt-free ice which can be melted for water.
• Reverse osmosis is placing seawater under pressure and forcing water molecules through a semi-permeable membrane, leaving a brine behind. • Electrodialysis is using electrically charged surfaces to attract cations and anions, leaving behind freshwater. • Salt absorption is using resins and charcoal to absorb ions from sea water.
• Sea ice is ice that forms by the freezing of sea water. – Icebergs are detached parts of glaciers. As sea water freezes, needles of ice form The needles grow into platelets The platelets produce a slush at the sea surface • As ice forms, the salt remains in solution: – increasing salinity – further lowering the freezing point of the water • Depending upon how quickly the ice freezes, some salt may be trapped within the ice mass, but is gradually released.
• Pancake ice are rounded sheets of flexible sea ice that become abraded as they collide. • Pressure ridges are the buckled edges of sea ice masses that have collided. • Sea ice thickens with time as snow freezes to its surface and water to its bottom. • Sheets of ice are broken by waves, currents and wind into irregular, mobile masses, called ice floes.
• The amount of light entering the ocean depends upon: – the height of the sun above the horizon – the smoothness of the sea surface • 65% of light entering the ocean is absorbed within the first meter and converted into heat. • Only 1% of light entering the ocean reaches 100 m. • Water displays the selective absorption of light: – long wavelengths are absorbed first – short wavelengths are absorbed last • In the open ocean, blue light penetrates the deepest.
• In turbid coastal waters light rarely penetrates deeper than 20 m. – The water appears yellow to green because particles reflect these wavelengths. • The photic zone is the part of the water column penetrated by sunlight. • The aphotic zone is the part of the water column below light penetration and permanently dark.
• The speed of sound in water increases as: – Salinity increases – temperature increases – pressure increases • In the ocean, the speed of sound is mainly a function of temperature and pressure.
• Above the pycnocline, increasing pressure with depth increases the speed of sound, despite the gradual decrease in temperature. • Within the pycnocline, the speed of sound decreases rapidly because of the rapid decrease in temperature and only slight increase in pressure. • Below the pycnocline the speed of sound gradually increases because pressure continues to increase, but temperature only declines slightly.
• SOFAR Channel is located where sound speed is at a minimum. • Refraction of sound waves within the channel prevents dispersion of the sound energy. • Sound waves travel for 1000 s of kilometers within the channel. FIGURE 5. B 08 b: Sofar channel. Adapted from Kinsler, L. E. And A. R. Frey. Fundamentals of Acoustics. John Wiley & Sons, 1962.
Ocean life v. Marine environment is inhabited by a wide variety of organisms v. Most organisms live within the sunlight surface waters (photosynthesis) v. Classification of marine organisms • Plankton • Floaters • Algae (phytoplankton)
Ocean life v. Classification of marine organisms • Benthos • Bottom dwellers • A great number of species exist on the shallow coastal floor • Most live in perpetual darkness in deep water
Ocean life v. Marine life zones • Several factors are used to divide the ocean into distinct marine life zones • Availability of light • Photic (light) zone • Upper part of ocean • Sunlit • Euphotic zone is near the surface where the light is strong
Ocean life v. Marine life zones • Several factors are used to divide the ocean into distinct marine life zones • Availability of light • Aphotic (without light) zone • Deep ocean • No sunlight
Ocean life v. Marine life zones • Several factors are used to divide the ocean into distinct marine life zones • Distance from shore • Intertidal zone – area where land ocean meet and overlap • Neritic zone – seaward from the low tide line, the continental shelf out to the shelf break • Oceanic zone – beyond the continental shelf
Ocean life v. Marine life zones • Several factors are used to divide the ocean into distinct marine life zones • Water depth • Pelagic zone – open ocean of any depth • Benthic zone – includes any sea-bottom surface • Abyssal zone – a subdivision of the benthic zone • Deep • Extremely high water pressure • Low temperatures
Ocean life v. Marine life zones • Several factors are used to divide the ocean into distinct marine life zones • Water depth • Abyssal zone – a subdivision of the benthic zone • No sunlight • Sparse life • Food sources include decaying particles from above, large fragments falling, and hydrothermal vents
Marine life zones Figure 14. 10
Ecosystem energy flow and efficiency Figure 14. 15
The Physics of Water Seawater’s chemical properties affect how life functions in the oceans. Water’s physical properties not only affect life processes of marine organisms, but of human beings in the water. Heat and Heat Capacity – The faster molecules move, the more heat there is. Total heat energy is measured based on both the quantity and speed of vibrating molecules. Chapter 7 Pages 7 -3 to 7 -5 The Physics of Water • Heat is the kinetic energy in the random movement, or vibration, of individual atoms and molecules in a substance. • Temperature measures only how fast the molecules vibrate. – The two most common temperature systems are Fahrenheit and Celsius is most used in science because it is based on water’s physical properties.
Heat and Heat Capacity (continued) • Heat capacity of a substance is the amount of heat energy required to raise a given amount of a substance by a given temperature. – Scientists express heat capacity in terms of the amount of heat energy it takes to change one gram of a substance by 1°C. – It’s expressed as the number of calories required. – It takes more heat energy to raise water’s temperature than that of most substances. • Therefore water can absorb or release a lot of heat with little temperature change. – Water’s heat capacity affects the world’s climate and weather. • Heat is carried to areas that would otherwise be cooler, and heat is absorbed in areas that would otherwise be hotter.
Water Temperature and Density • • As water cools it becomes denser. At 3. 98°C (39. 16°F) it reaches maximum density. Below this point, it crystallizes into ice. As water moves into a solid state* it becomes less dense. Ice does not form all at once at the freezing point of 0°C (32°F), but crystallizes continuously until all liquid turns solid. Temperature does not drop any further until all the liquid water freezes, even though heat continues to leave. – This produces non-sensible heat – a change in heat energy that cannot be sensed with a thermometer. – The non-sensible heat lost when water goes from liquid to solid state is called the latent heat of fusion. – Sensible heat is that which you can sense with a thermometer. * State is an expression of a substance’s form as it changes from solid, to liquid, to gas with the addition of heat. Latent Heat of Vaporization • Latent heat of vaporization is the heat required to vaporize a substance. – It takes more latent heat to vaporize water than to freeze it because when water freezes only some of the hydrogen bonds break. – When it vaporizes, all the hydrogen bonds must break, which requires more energy.
Thermal Inertia • The tendency of water to resist temperature change is called thermal inertia. • Thermal equilibrium means water cools at about the same rate as it heats. • These concepts are important to life and Earth’s climate because: – Seawater acts as a global thermostat, preventing broad temperature swings. • Temperature changes would be drastic between night and day and between summer and winter. • Without thermal inertia, many – perhaps most – of the organisms on Earth could not survive the drastic temperature changes that would occur each night.
Light • Water scatters and absorbs light. When light reaches the water’s surface, some light penetrates, but, depending on the sun’s angle, much may simply reflect back out of the water. – – • Within the water, light reflects off light-colored suspended particles. Dark colored suspended particles and algae absorb some of the light. Water molecules absorb the energy, converting light into heat. Water absorbs colors at the red end of the spectrum more easily than at the blue end. Two zones exist with respect to light penetration: – 1. Photic Zone – where light reaches (can be as deep as 200 meters (656 feet). The photic zone has two subzones. • • Euphotic Zone – the upper shallow portion where most biological production occurs – comprises about 1% of the oceans. Dysphotic Zone – where light reaches, but not enough for photosynthetic life. – 2. Aphotic Zone – it makes up the vast majority of the oceans. Where light does not reach and only a fraction of marine organisms live.
Temperature • Compared to land-based climates, marine organisms live in a much less challenging environment with respect to temperature range. – Ectotherm – An organism who's internal temperature changes with seawater temperature. Commonly called “cold-blooded. ” – Endotherm – Organisms that have an internal temperature that varies, but remains 9°-16°C (48. 2°- 60. 8°F) warmer than the surrounding water. – Homeotherm – Have an internal temperature that is relatively stable. They are called “warm-blooded”; marine mammals and birds are in this category. • Temperature affects metabolism – the higher the temperature within an organism the more energy-releasing chemical processes (metabolism) happen. – Endotherms and homeotherms can tolerate a wide range of external temperatures. • Internal heat regulation allows endotherms an advantage. – Their metabolic rate remains the same regardless of external temperature allowing them to live in a variety of habitats.
Sound • Sound travels five times faster in water than in air. – It travels through warm water faster than cool… but it travels faster in deep water due to pressure. – Sound bounces off suspended particles, water layers, the bottom and other obstacles. – Sound travels farther through water than light. – Sound is eventually absorbed by water as heat. • Because sound travels so well in water, marine mammals use echolocation to sense an object’s size, distance, density, and position underwater.
Pressure • Pressure exerted by water is called hydrostatic pressure. It’s simply the weight of the water. – At 10 meters (33 feet) hydrostatic pressure is equal to atmospheric pressure – 1 bar/ata. – At 10 meters (33 feet) the total pressure is 2 bar – 1 bar from atmospheric pressure plus 1 bar from hydrostatic pressure. – A marine organism living at 10 meters (33 feet) experiences twice the pressure present at sea level. Pressure increases 1 bar for each additional 10 meters (33 feet). • Hydrostatic pressure doesn’t affect marine organisms because it is the same inside the organism as outside. – Living tissue is made primarily of water, which (within limits) transmits pressure evenly. Since it’s in balance, pressure doesn’t crush or harm marine organisms. – Hydrostatic pressure is primarily an issue only for organisms that have gas spaces in their bodies.
Size and Volume • Using a sphere to substitute for a cell: – The volume of a sphere increases with the cube of its radius and the surface area increases with the square of its radius. • If a cell were to increase diameter 24 times original size, the volume would increase 64 times, but the surface area would increase only 16 times. – High surface-to-volume ratio is important for cell function. The bigger the cell, the lower the surface-to-volume ratio, which means that there’s less relative area through which to exchange gases, nutrients, and waste. • This is why large organisms are multicellular rather than a giant single cell. Buoyancy • Archimedes’ Principle states that an object immersed in a gas or liquid is buoyed up by a force equal to the weight of the gas or liquid displaced. – This means marine organisms don’t have to expend much energy to offset their own weight compared to a land-based existence. • • • It allows entire communities to exist simply by drifting. It allows organisms to grow larger than those on land. It allows many swimming creatures to live without ever actually coming into contact with the bottom.
Movement and Drag • Marine organisms avoid sinking by: – Plumes, hairs, ribbons, spines, and other protrusions that increase their drag and help them resist sinking. – Others have buoyancy adaptations that help them remain suspended in the water column. • Some marine organisms need to overcome drag as they swim. Adaptations that help them overcome drag: – Moving or swimming very slowly. – Excreting mucus or oil that actually lubricates them to “slip” through the water. – The most common is to have a shape that reduces drag – streamlining. Currents • It is speculated that drifting provides several advantages. – 1. Drifting disperses organisms into new habitats, ensuring survival should something happen to the original community. – 2. May take organisms into nutrient-rich areas, preventing too many offspring from competing for the same resources in the original community.
Biogeochemical Cycles • Proportions of organic elements in seawater differ from the proportions of sea salts because: – The principle of constant proportions does not apply to these elements. – These nonconservative constituents have concentrations and proportions that vary independently of salinity owing to biological and geological activity. • All life depends on material from the nonliving part of the Earth. – The continuous flow of elements and compounds between organisms (biological form) and the Earth (geological form) is the biogeochemical cycle. • Organisms require specific elements and compounds to stay alive. – Aside from gases used in respiration or photosynthesis, those substances required for life are called nutrients. • The primary nutrient elements related to seawater chemistry are carbon, nitrogen, phosphorus, silicon, iron, and a few other trace metals. • Not all nutrients and compounds cycle at the same rate. • The biogeochemical cycle of the various nutrients affects the nature of organisms and where they live in the sea .
Ocean density • Density is mass per unit volume - how heavy something is for its size • Determines the water’s vertical position in the ocean • Saltier water is more dense ~ sinks • Factors affecting seawater density • Salinity • Temperature - the greatest influence