Institute of Oceanography NATIONAL CENTRE FOR MARINE RESEARCH
- Slides: 32
Institute of Oceanography NATIONAL CENTRE FOR MARINE RESEARCH PLANKTONIC FOOD WEB IN THE AEGEAN SEA I. Siokou-Frangou, and G. Assimakopoulou* U. Christaki* E. D. Christou* A. Giannakourou* O. Gotsis-Skretas* L. Ignatiades** K. Pagou* V. Pitta*** S. Psarra*** S. Zervoudaki* F. Van Wambeke**** *National Centre for Marine Research **National Centre of Research DEMOKRITOS ***Institute of Marine Biology of Crete ****Universite de Marseille Aegean Sea workshop 1
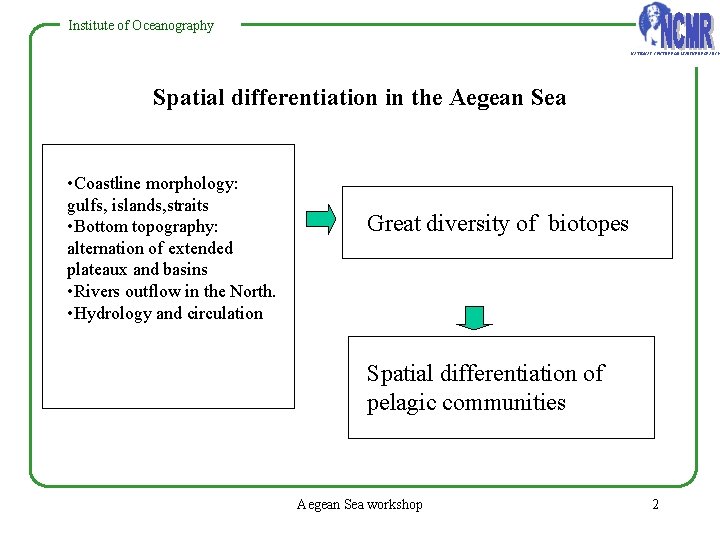
Institute of Oceanography NATIONAL CENTRE FOR MARINE RESEARCH Spatial differentiation in the Aegean Sea • Coastline morphology: gulfs, islands, straits • Bottom topography: alternation of extended plateaux and basins • Rivers outflow in the North. • Hydrology and circulation Great diversity of biotopes Spatial differentiation of pelagic communities Aegean Sea workshop 2
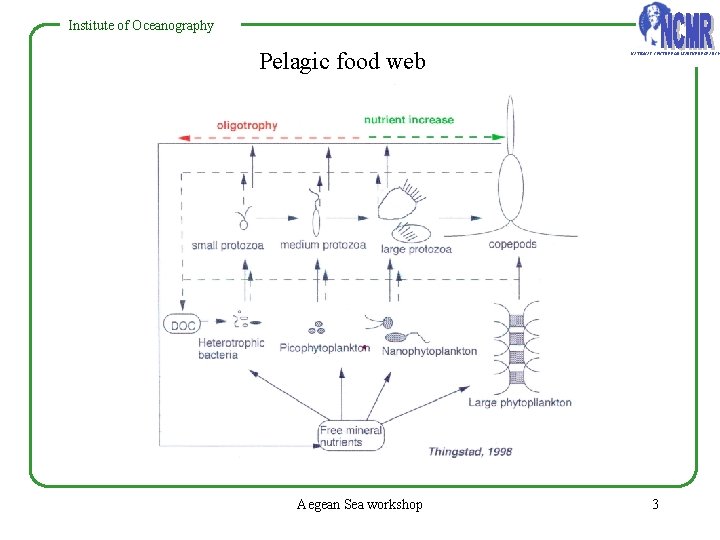
Institute of Oceanography Pelagic food web Aegean Sea workshop NATIONAL CENTRE FOR MARINE RESEARCH 3
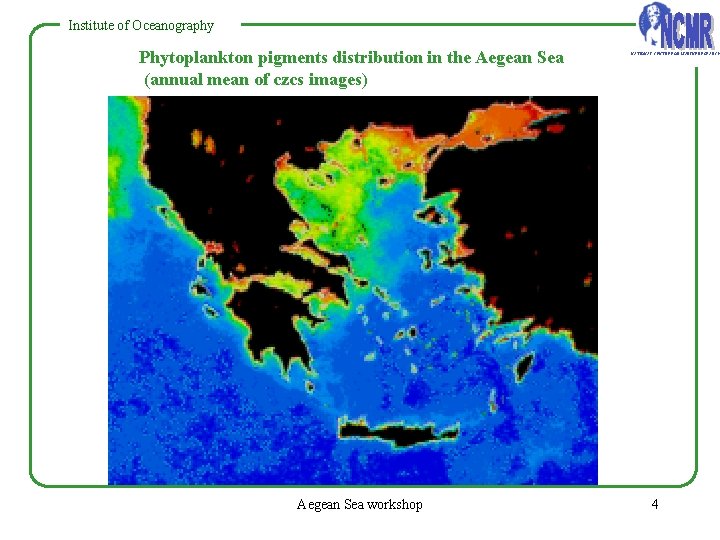
Institute of Oceanography Phytoplankton pigments distribution in the Aegean Sea (annual mean of czcs images) Aegean Sea workshop NATIONAL CENTRE FOR MARINE RESEARCH 4
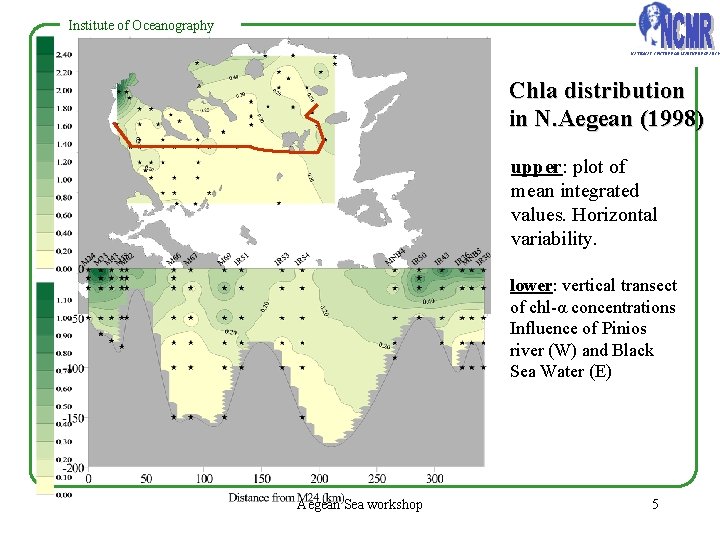
Institute of Oceanography NATIONAL CENTRE FOR MARINE RESEARCH Chla distribution in N. Aegean (1998) upper: plot of mean integrated values. Horizontal variability. lower: vertical transect of chl-α concentrations Influence of Pinios river (W) and Black Sea Water (E) Aegean Sea workshop 5
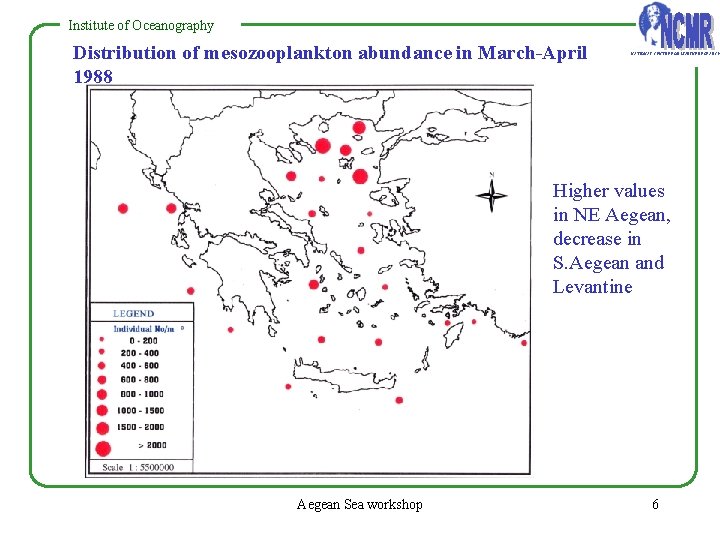
Institute of Oceanography Distribution of mesozooplankton abundance in March-April 1988 NATIONAL CENTRE FOR MARINE RESEARCH Higher values in NE Aegean, decrease in S. Aegean and Levantine Aegean Sea workshop 6
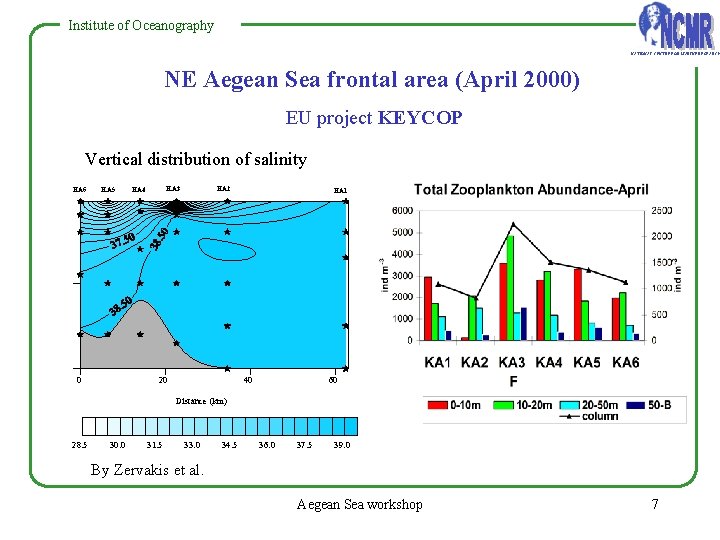
Institute of Oceanography NATIONAL CENTRE FOR MARINE RESEARCH NE Aegean Sea frontal area (April 2000) EU project KEYCOP Vertical distribution of salinity KA 6 KA 5 0 KA 2 KA 3 KA 4 20 KA 1 40 60 Distance (km) 28. 5 30. 0 31. 5 33. 0 34. 5 36. 0 37. 5 39. 0 By Zervakis et al. Aegean Sea workshop 7
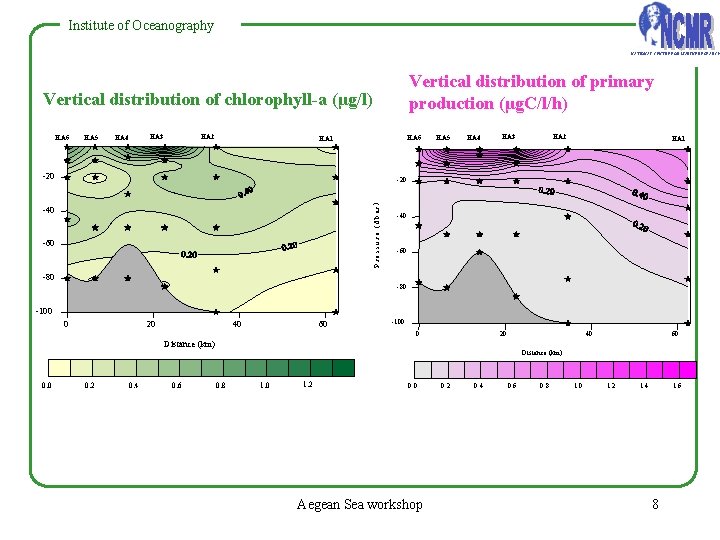
Institute of Oceanography NATIONAL CENTRE FOR MARINE RESEARCH Vertical distribution of primary production (μg. C/l/h) Vertical distribution of chlorophyll-a (μg/l) KA 6 KA 5 KA 4 KA 2 KA 3 KA 6 KA 1 -20 KA 5 KA 4 KA 2 KA 3 KA 1 P re ssu r e ( d b ar ) -20 -40 -60 -80 -100 0 20 40 60 -100 0 20 40 Distance (km) 0. 0 0. 2 0. 4 0. 6 60 Distance (km) 0. 8 1. 0 1. 2 0. 0 Aegean Sea workshop 0. 2 0. 4 0. 6 0. 8 1. 0 1. 2 1. 4 1. 6 8
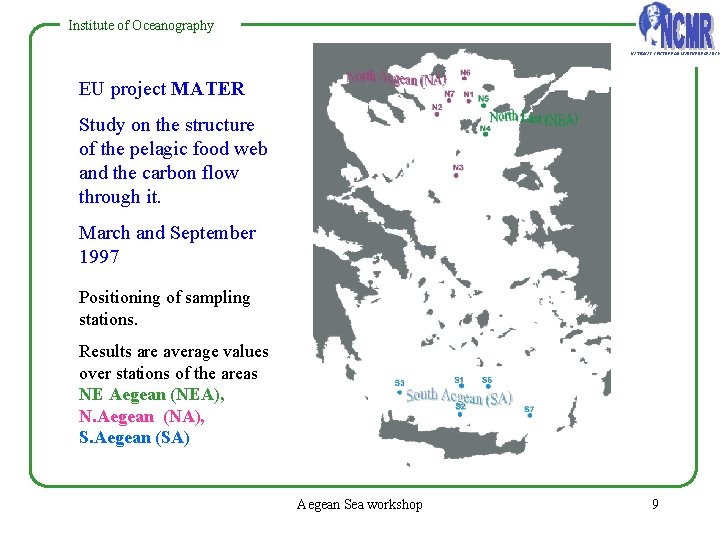
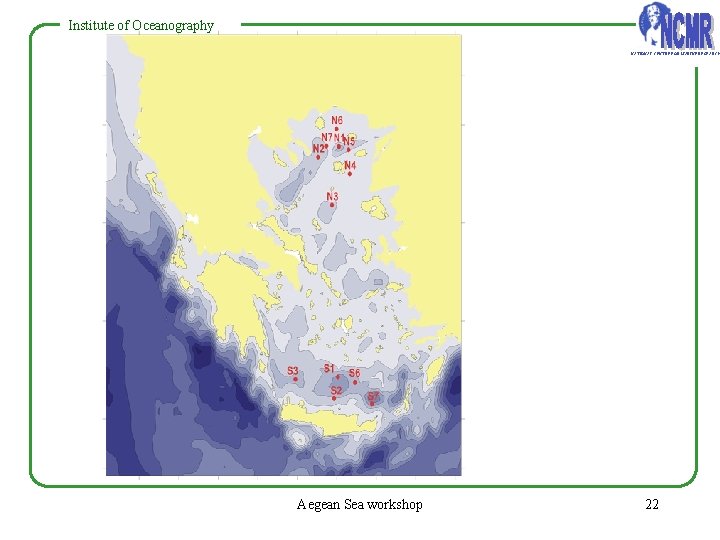
Institute of Oceanography NATIONAL CENTRE FOR MARINE RESEARCH EU project MATER Study on the structure of the pelagic food web and the carbon flow through it. March and September 1997 Positioning of sampling stations. Results are average values over stations of the areas NE Aegean (NEA), N. Aegean (NA), S. Aegean (SA) Aegean Sea workshop 9
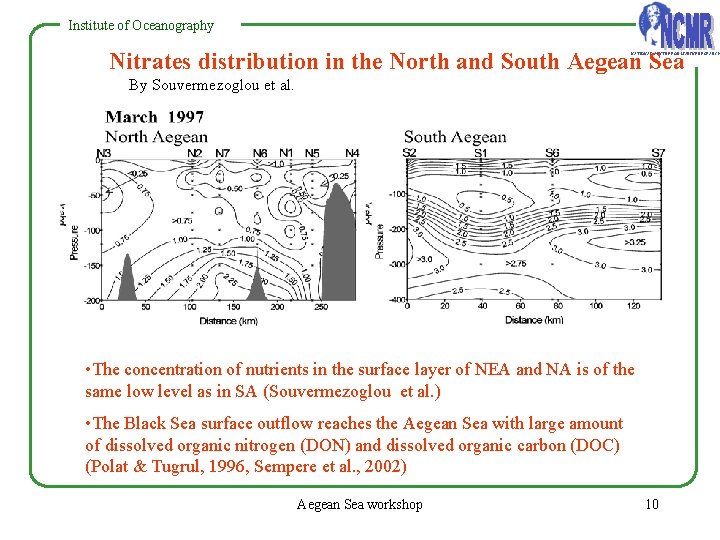
Institute of Oceanography Nitrates distribution in the North and South Aegean Sea NATIONAL CENTRE FOR MARINE RESEARCH By Souvermezoglou et al. • The concentration of nutrients in the surface layer of NEA and NA is of the same low level as in SA (Souvermezoglou et al. ) • The Black Sea surface outflow reaches the Aegean Sea with large amount of dissolved organic nitrogen (DON) and dissolved organic carbon (DOC) (Polat & Tugrul, 1996, Sempere et al. , 2002) Aegean Sea workshop 10
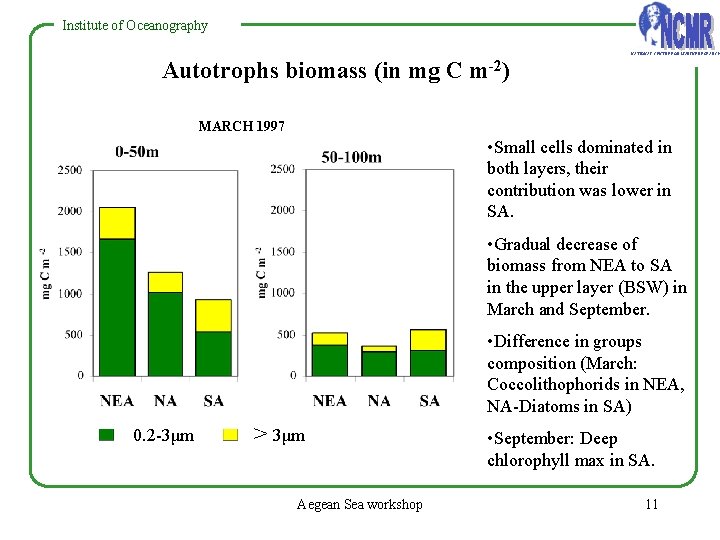
Instituteofof. Oceanography NATIONAL CENTRE FOR MARINE RESEARCH Autotrophs biomass (in mg C m-2) MARCH 1997 • Small cells dominated in both layers, their contribution was lower in SA. • Gradual decrease of biomass from NEA to SA in the upper layer (BSW) in March and September. • Difference in groups composition (March: Coccolithophorids in NEA, NA-Diatoms in SA) 0. 2 -3μm > 3μm Aegean Sea workshop • September: Deep chlorophyll max in SA. 11
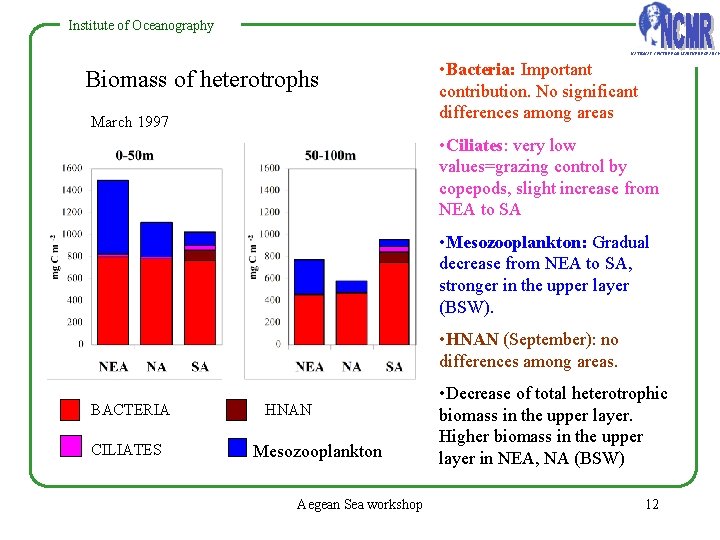
Institute of Oceanography NATIONAL CENTRE FOR MARINE RESEARCH Biomass of heterotrophs March 1997 • Bacteria: Important contribution. No significant differences among areas • Ciliates: very low values=grazing control by copepods, slight increase from NEA to SA • Mesozooplankton: Gradual decrease from NEA to SA, stronger in the upper layer (BSW). • HNAN (September): no differences among areas. BACTERIA CILIATES HNAN Mesozooplankton Aegean Sea workshop • Decrease of total heterotrophic biomass in the upper layer. Higher biomass in the upper layer in NEA, NA (BSW) 12
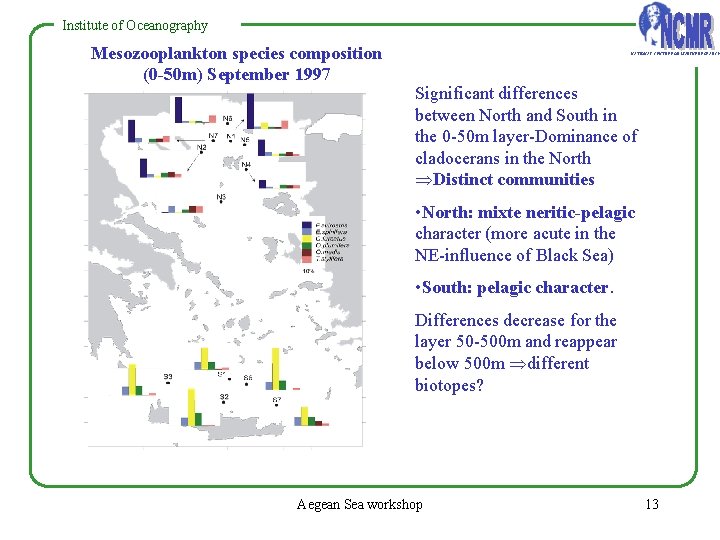
Instituteofof. Oceanography Mesozooplankton species composition (0 -50 m) September 1997 NATIONAL CENTRE FOR MARINE RESEARCH Significant differences between North and South in the 0 -50 m layer-Dominance of cladocerans in the North Distinct communities • North: mixte neritic-pelagic character (more acute in the NE-influence of Black Sea) • South: pelagic character. Differences decrease for the layer 50 -500 m and reappear below 500 m different biotopes? Aegean Sea workshop 13
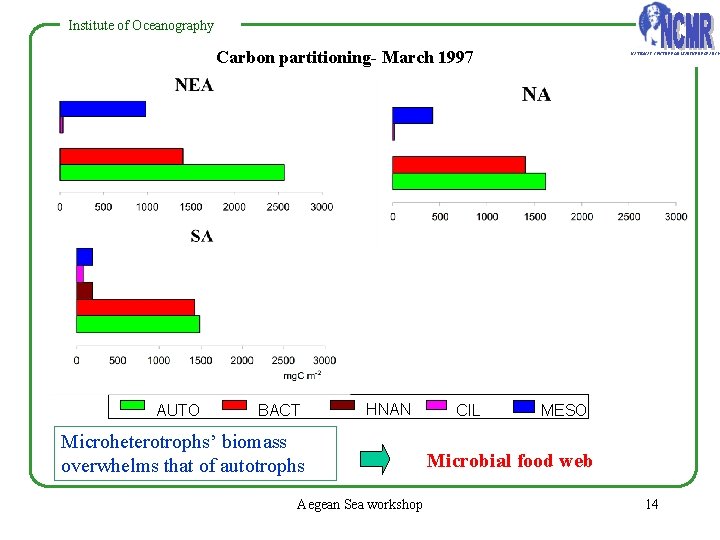
Institute of Oceanography Carbon partitioning- March 1997 AUTO BACT HNAN Microheterotrophs’ biomass overwhelms that of autotrophs Aegean Sea workshop CIL NATIONAL CENTRE FOR MARINE RESEARCH MESO Microbial food web 14
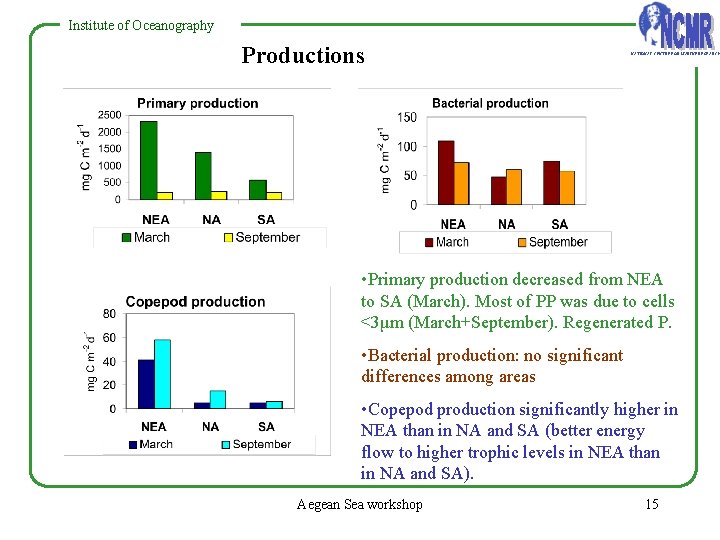
Institute of Oceanography Productions NATIONAL CENTRE FOR MARINE RESEARCH • Primary production decreased from NEA to SA (March). Most of PP was due to cells <3μm (March+September). Regenerated P. • Bacterial production: no significant differences among areas • Copepod production significantly higher in NEA than in NA and SA (better energy flow to higher trophic levels in NEA than in NA and SA). Aegean Sea workshop 15
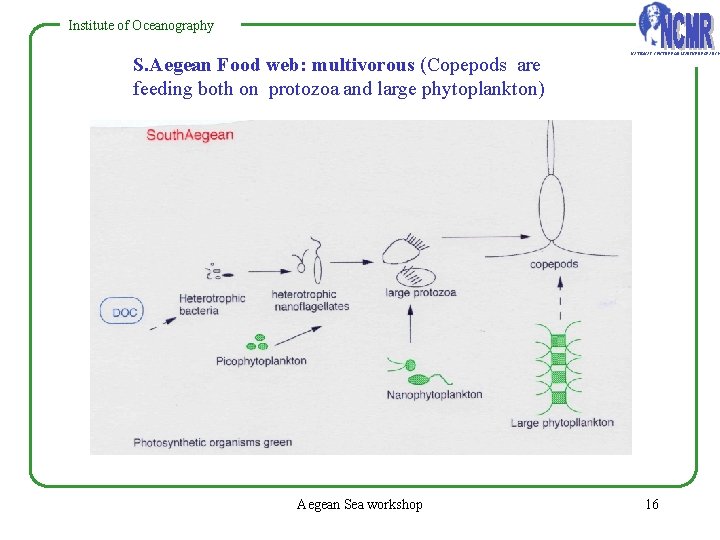
Institute of Oceanography S. Aegean Food web: multivorous (Copepods are feeding both on protozoa and large phytoplankton) Aegean Sea workshop NATIONAL CENTRE FOR MARINE RESEARCH 16
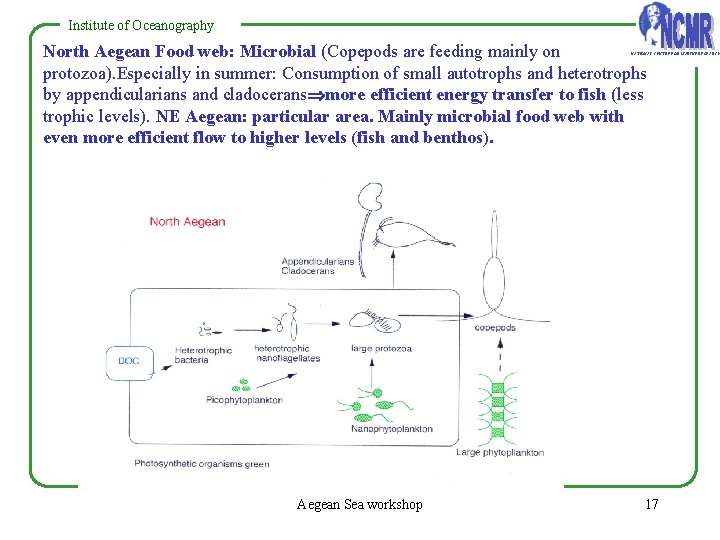
Institute of Oceanography North Aegean Food web: Microbial (Copepods are feeding mainly on protozoa). Especially in summer: Consumption of small autotrophs and heterotrophs by appendicularians and cladocerans more efficient energy transfer to fish (less trophic levels). NE Aegean: particular area. Mainly microbial food web with even more efficient flow to higher levels (fish and benthos). NATIONAL CENTRE FOR MARINE RESEARCH Aegean Sea workshop 17
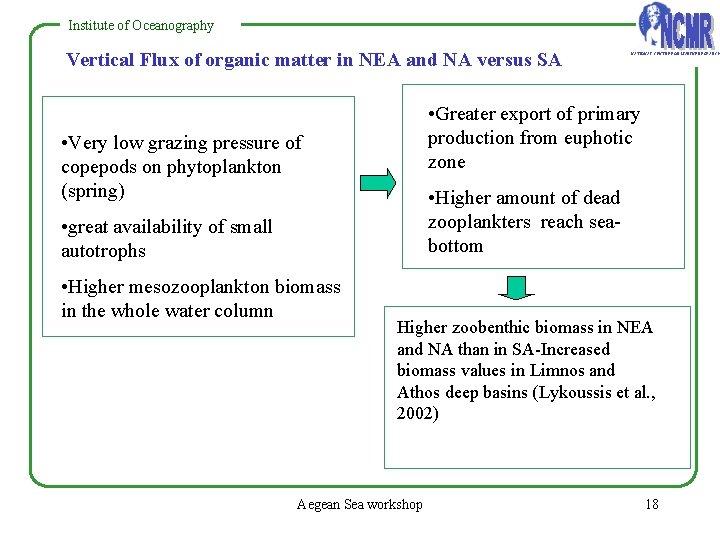
Institute of Oceanography Vertical Flux of organic matter in NEA and NA versus SA • Greater export of primary production from euphotic zone • Very low grazing pressure of copepods on phytoplankton (spring) • Higher amount of dead zooplankters reach seabottom • great availability of small autotrophs • Higher mesozooplankton biomass in the whole water column NATIONAL CENTRE FOR MARINE RESEARCH Higher zoobenthic biomass in NEA and NA than in SA-Increased biomass values in Limnos and Athos deep basins (Lykoussis et al. , 2002) Aegean Sea workshop 18
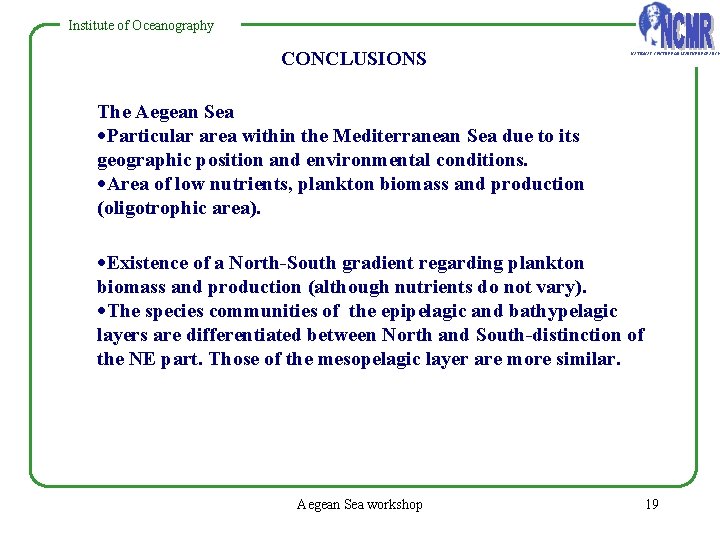
Institute of Oceanography CONCLUSIONS NATIONAL CENTRE FOR MARINE RESEARCH The Aegean Sea ·Particular area within the Mediterranean Sea due to its geographic position and environmental conditions. ·Area of low nutrients, plankton biomass and production (oligotrophic area). ·Existence of a North-South gradient regarding plankton biomass and production (although nutrients do not vary). ·The species communities of the epipelagic and bathypelagic layers are differentiated between North and South-distinction of the NE part. Those of the mesopelagic layer are more similar. Aegean Sea workshop 19
Institute of Oceanography ·The N. Aegean sea presents similarities to the W. Mediterranean Sea both in terms of plankton quantity and communities, whereas the S. Aegean is similar to other areas of the E. Mediterranean. NATIONAL CENTRE FOR MARINE RESEARCH ·The results obtained in March and September 1997 suggest: a microbial food web dominated in North and a multivorous food web in the South. a more efficient energy transfer through the pelagic food web towards higher trophic levels (fish and benthos) in N. Aegean (especially in NE) than in S. Aegean. an increased transport of organic matter towards the bottom of the deep Limnos and Athos basins. ·The NE Aegean is a special environment, perhaps due to the local nature of the higher production (presence of hydrological fronts). Aegean Sea workshop 20
Institute of Oceanography NATIONAL CENTRE FOR MARINE RESEARCH Aegean Sea workshop 21
Institute of Oceanography NATIONAL CENTRE FOR MARINE RESEARCH Aegean Sea workshop 22
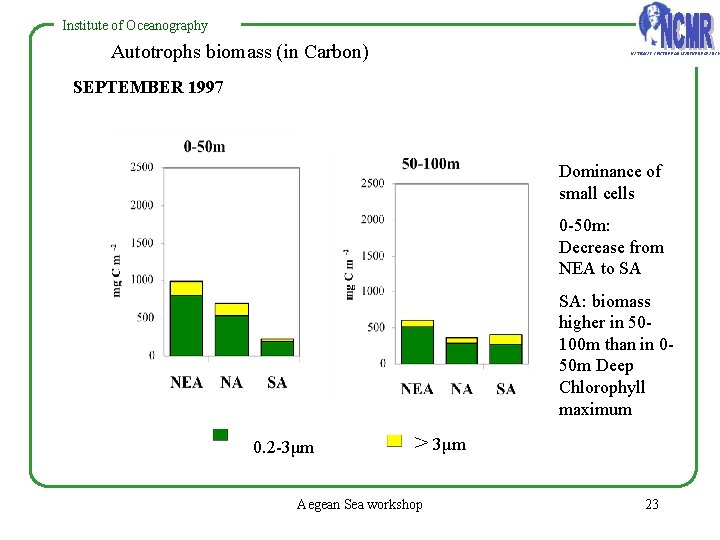
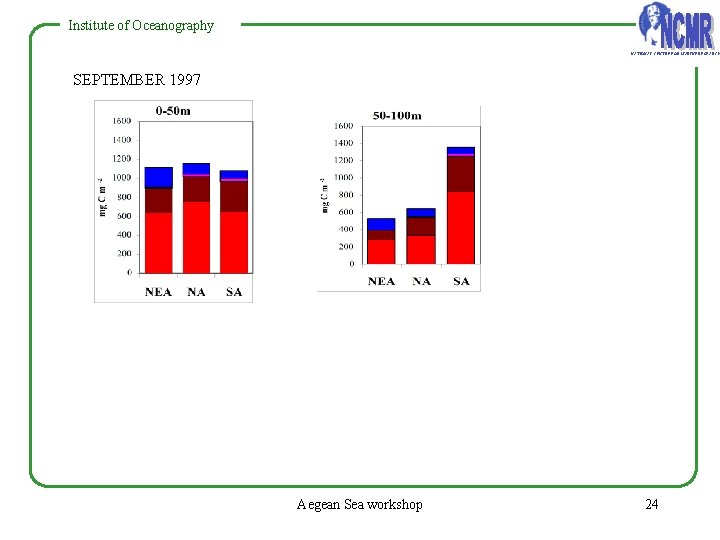
Instituteofof. Oceanography Autotrophs biomass (in Carbon) NATIONAL CENTRE FOR MARINE RESEARCH SEPTEMBER 1997 Dominance of small cells 0 -50 m: Decrease from NEA to SA SA: biomass higher in 50100 m than in 050 m Deep Chlorophyll maximum 0. 2 -3μm > 3μm Aegean Sea workshop 23
Institute of Oceanography NATIONAL CENTRE FOR MARINE RESEARCH SEPTEMBER 1997 Aegean Sea workshop 24
Institute of Oceanography NATIONAL CENTRE FOR MARINE RESEARCH Bacterial community (Christaki et al. , 1998) During March and September 1997 higher bacterial activities (production, enzymatic activity, aminoacid uptake, respiration) were recorded in the lower salinity water influenced by the BSW. The above findings implied different bacterial populations and/or different state of organic matter (e. g. more or less refractory=more or less easily hydrolysed by bacteria) in the two types of waters (Aegean-BS influenced). Microzooplankton-Ciliates (Pitta & Giannakourou, 2000) Significantly higher abundance in NEA than in SA, but the biomass was lower in NEA due to the dominance of small size species. Aegean Sea workshop 25
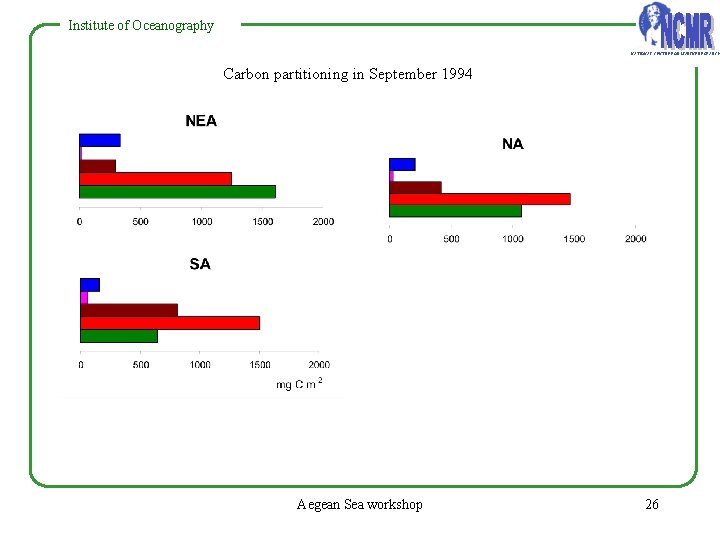
Institute of Oceanography NATIONAL CENTRE FOR MARINE RESEARCH Carbon partitioning in September 1994 Aegean Sea workshop 26
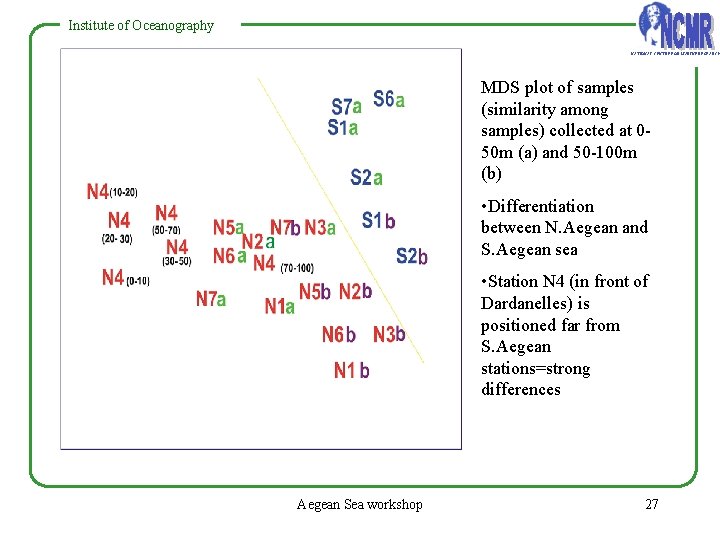
Institute of Oceanography NATIONAL CENTRE FOR MARINE RESEARCH MDS plot of samples (similarity among samples) collected at 050 m (a) and 50 -100 m (b) • Differentiation between N. Aegean and S. Aegean sea • Station N 4 (in front of Dardanelles) is positioned far from S. Aegean stations=strong differences Aegean Sea workshop 27
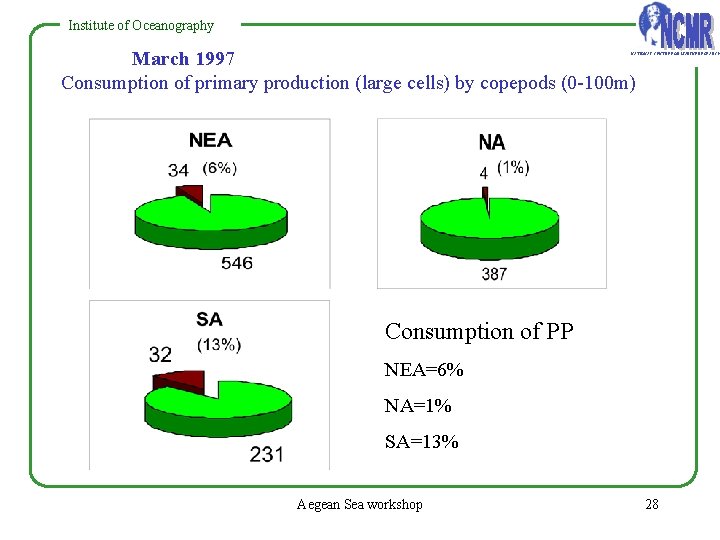
Institute of Oceanography March 1997 Consumption of primary production (large cells) by copepods (0 -100 m) NATIONAL CENTRE FOR MARINE RESEARCH Consumption of PP NEA=6% NA=1% SA=13% Aegean Sea workshop 28
Institute of Oceanography NATIONAL CENTRE FOR MARINE RESEARCH MDS plot of samples collected at 100200 m© 200 -300 m (d) 300 -500 m (e) • small differences between areas Aegean Sea workshop 29
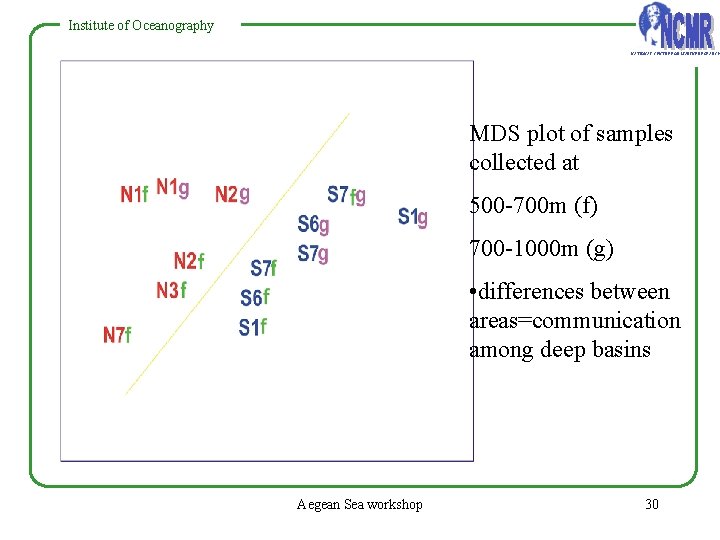
Institute of Oceanography NATIONAL CENTRE FOR MARINE RESEARCH MDS plot of samples collected at 500 -700 m (f) 700 -1000 m (g) • differences between areas=communication among deep basins Aegean Sea workshop 30
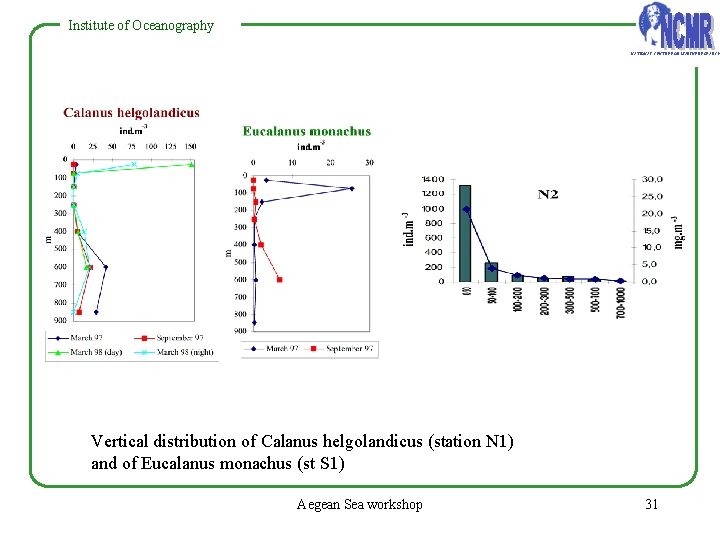
Institute of Oceanography NATIONAL CENTRE FOR MARINE RESEARCH Vertical distribution of Calanus helgolandicus (station N 1) and of Eucalanus monachus (st S 1) Aegean Sea workshop 31
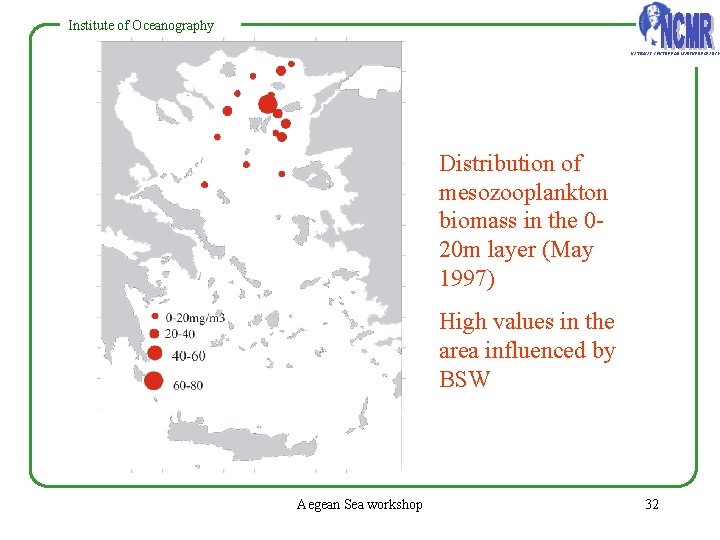
Institute of Oceanography NATIONAL CENTRE FOR MARINE RESEARCH Distribution of mesozooplankton biomass in the 020 m layer (May 1997) High values in the area influenced by BSW Aegean Sea workshop 32