Lab Activity 1 Total Acidity Acidity depends on

Lab Activity 1: Total Acidity

Acidity depends on: • Acid strength in solution (measured by the degree of hydrogen ion (H+) dissociation 1. Strong acids: almost totally dissociates, releasing their hydrogen ions for bonding to other ions (HCl) 2. Weak acids: Have their H ions strong bonded (only few released) CH 3 COOH

• Concentration of acidic compounds in solution. (expressed in: • %w/w, • %v/v, • ppm, • M (moles/l), • N (Equivalent Weight (EW/Volume)

Total Acidity • A measure of all the H+ of both dissociated and undissociated acids in solution. • Titratable acidity is used to approximate total acidity. • Titratable acidity can be measured by: 1 - reacting the acid present with a base such as Na. OH to the end point (equivalence point or neutrality point( at which H+ are equal to OH- in solution) indicated by a color change of an indicator.

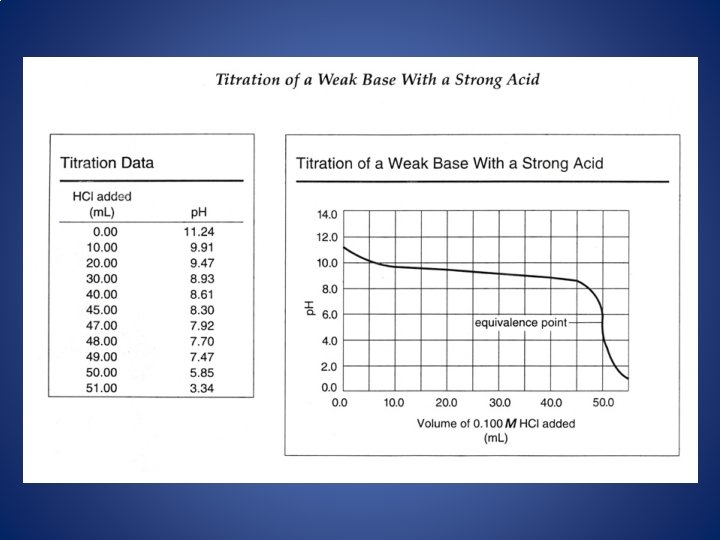
Titrations • SA/SB –equivalence point is neutral. • WA/SB –equivalence point is basic. • WB/SA –equivalence point is acidic.
![Titration • Titration – A standard solution with a known [ ] (the titrant)](http://slidetodoc.com/presentation_image_h2/c3f403c245d3da927175488078793da3/image-6.jpg "Titration • Titration – A standard solution with a known [ ] (the titrant)")
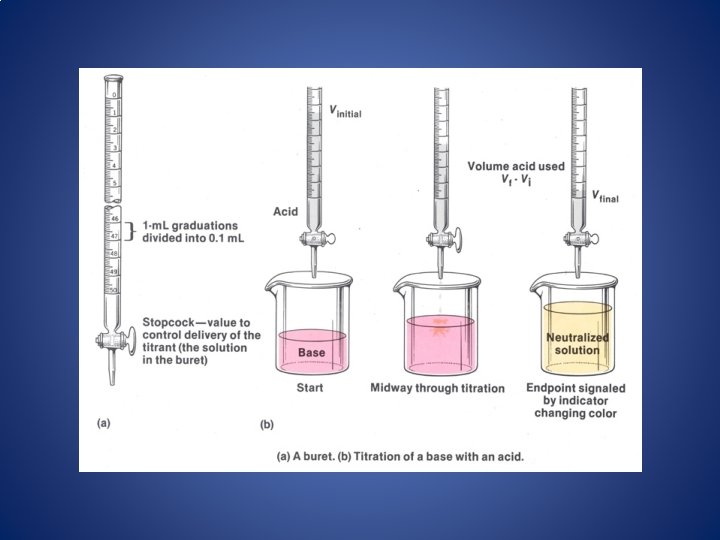
Titration • Titration – A standard solution with a known [ ] (the titrant) is used to determine the [ ] of an unknown solution. – The reaction that occurs is a neutralization reaction. standard solution (in buret) unknown solution

Titration • Equivalence point – Point in the rxn which equal amounts of H 3 O+ and OH- exist. • dramatic change in p. H • End Point – Point at which a color change is observed. • The equivalence point and end point are not necessarily concurrent.

Titration Curve Titration of a Strong Acid With a Strong Base 14. 0 12. 0 Na+ OH- 10. 0 Na+ OH- p. H Solution of Na. OH 8. 0 6. 0 equivalence point 4. 0 Solution of HCl H+ Cl- 2. 0 H+ Cl- 0. 0 10. 0 20. 0 30. 0 Volume of 0. 100 M Na. OH added (m. L) 40. 0

Features of the Strong Acid-Strong Base Titration Curve 1. The p. H starts out low, reflecting the high [H 3 O+] of the strong acid and increases gradually as acid is neutralized by the added base. 2. Suddenly the p. H rises steeply. This occurs in the immediate vicinity of the equivalence point. For this type of titration the p. H is 7. 0 at the equivalence point. 3. Beyond this steep portion, the p. H increases slowly as more base is added.

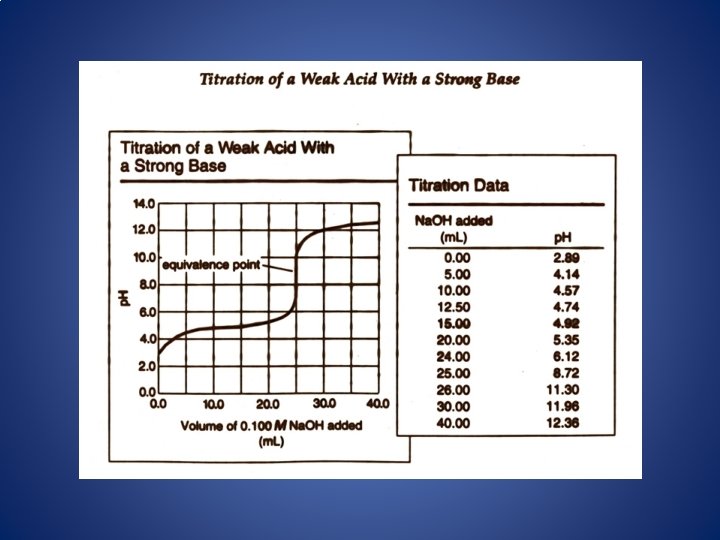
The four Major Differences Between a Strong Acid. Strong Base Titration Curve and a Weak Acid. Strong Base Titration Curve 1. The initial p. H is higher. 2. A gradually rising portion of the curve, called the buffer region, appears before the steep rise to the equivalence point. 3. The p. H at the equivalence point is greater than 7. 00. 4. The steep rise interval is less pronounced.

Features of the Titration of a Polyprotic Acid with a Strong Base 1. The loss of each mole of H+ shows up as separate equivalence point (but only if the two p. Kas are separated by more than 3 p. K units). 2. The p. H at the midpoint of the buffer region is equal to the p. Ka of that acid species. 3. The same volume of added base is required to remove each mole of H+.

For Experiments follow the lab manual !!
- Slides: 15