Helping Others Catch the Vision of Program Evaluation



















- Slides: 97
Helping Others Catch the Vision of Program Evaluation
Hello… What do you hope to learn today?
You CAN help others: Value & enjoy evaluation Create logic models Improve performance measures
Epidemiology & Laboratory Capacity (ELC)
ELC Activities Cross-Cutting: Epidemiology Laboratory Health Information Systems Evaluation Disease-Specific: Foodborne Healthcare-Associated Infections Influenza West Nile Virus/Arboviral Vaccine-Preventable
ELC Evaluation Pilot Project Purpose: build evaluation capacity in state public health departments
Getting started
Utah’s Pilot Year Training Creating logic models Improving performance measures
Don’t reinvent the wheel
Use & share resources
www. cdc. gov/eval
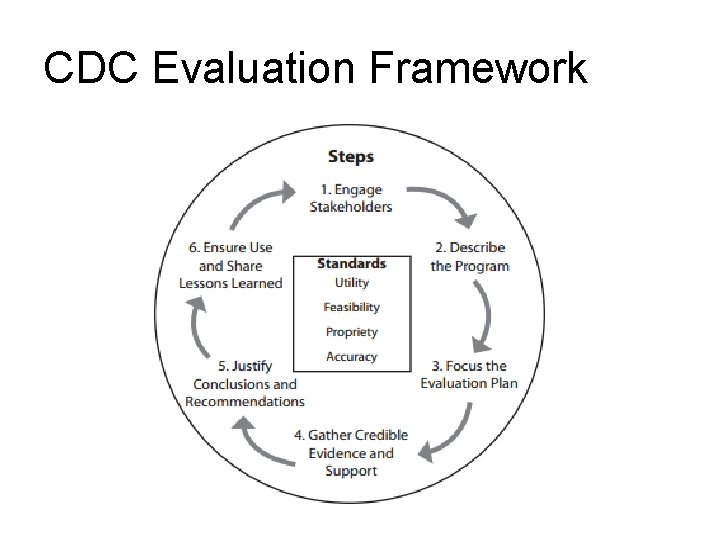
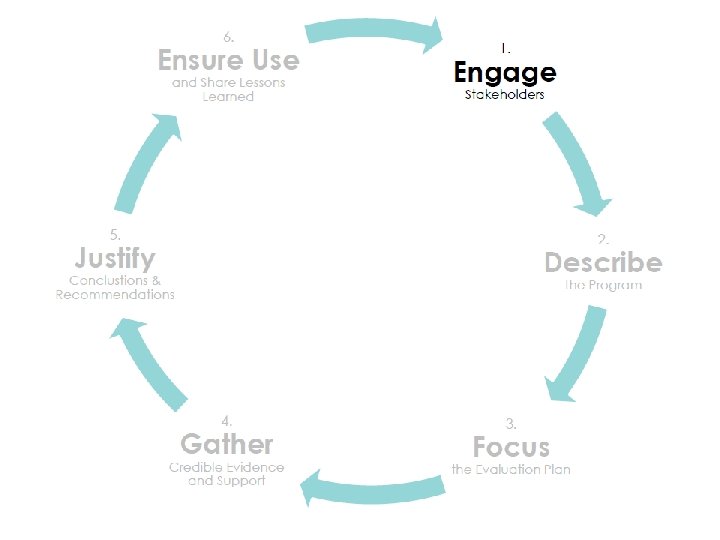
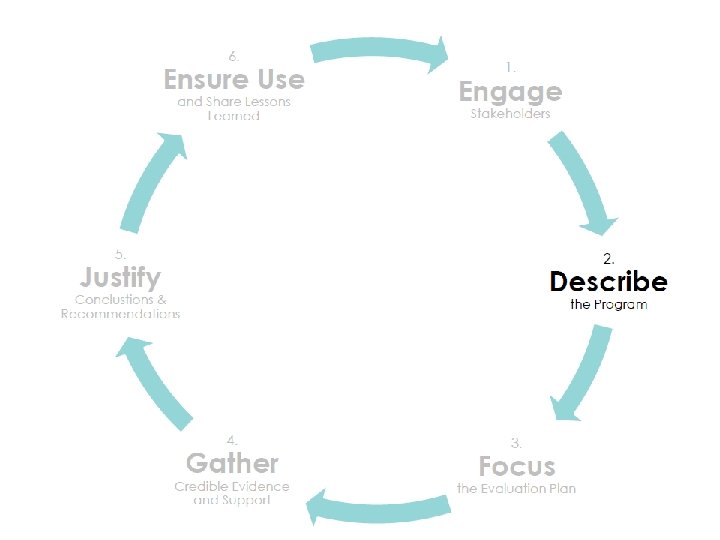
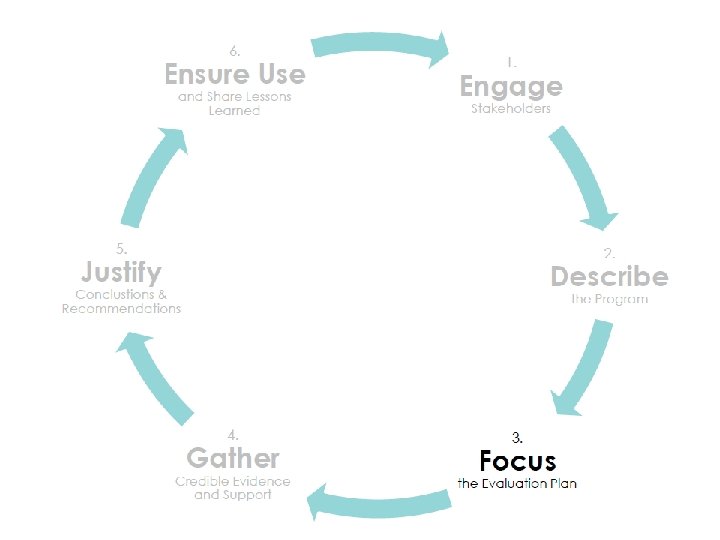
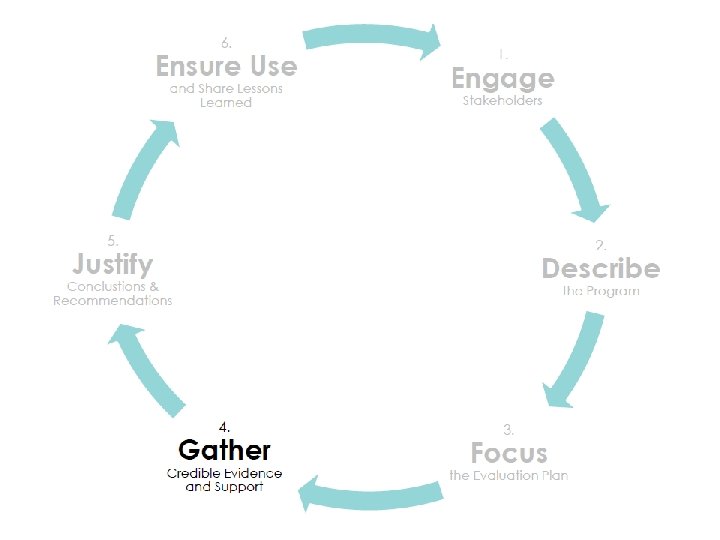
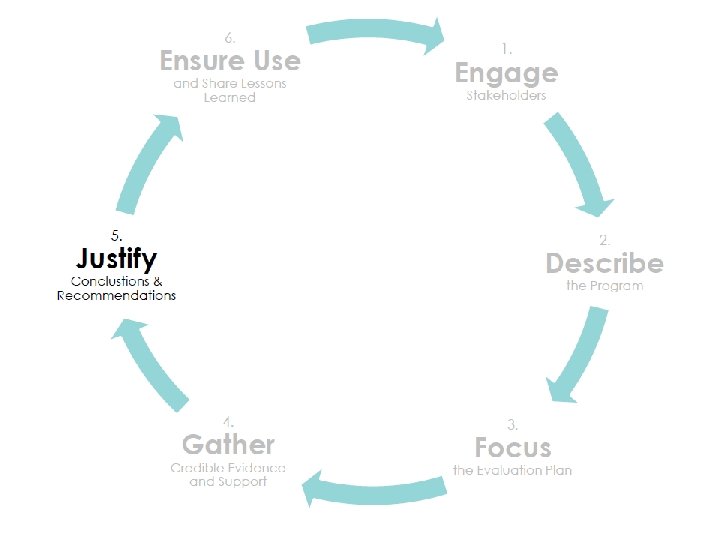
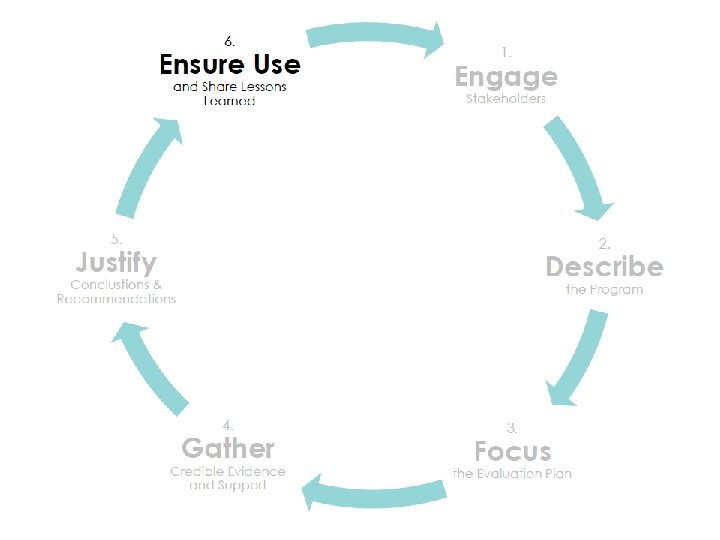
CDC Evaluation Framework
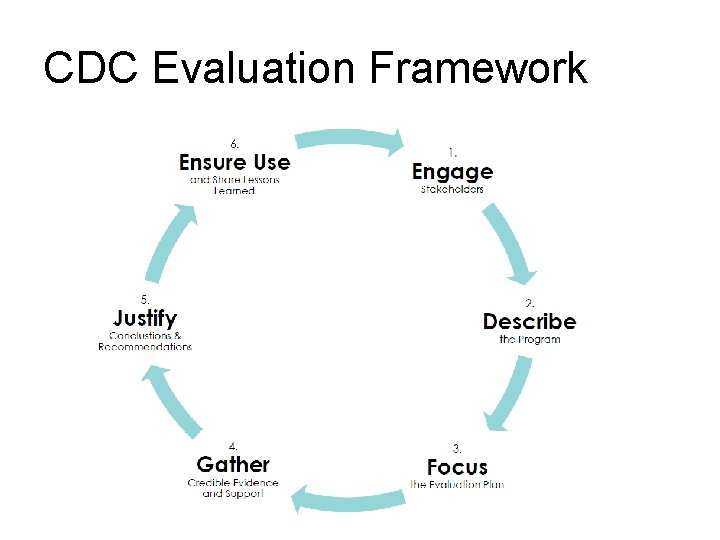
CDC Evaluation Framework
Engage Stakeholders
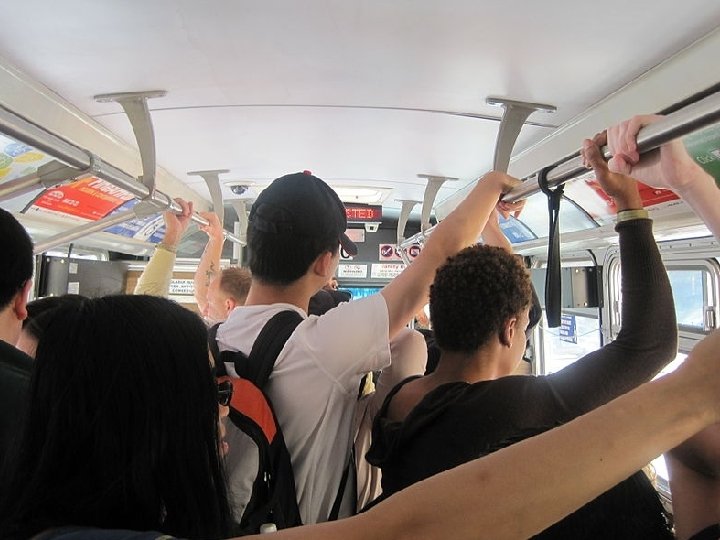
Traveling companions
Be “the carer”
Newsletter
Listen
Time it right
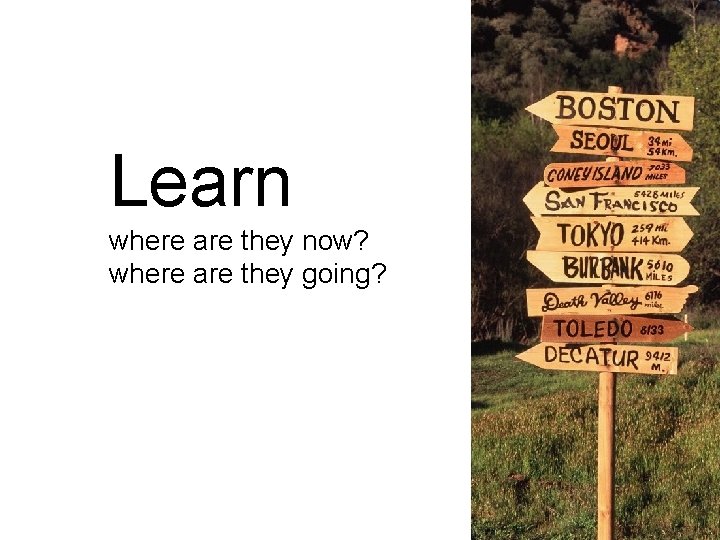
Learn where are they now? where are they going?
What’s the motivation?
Learning the language
Increasing knowledge
Be a resource, not the expert
Have fun!
Do Local Health Departments use UDOH disease plans? Powered by
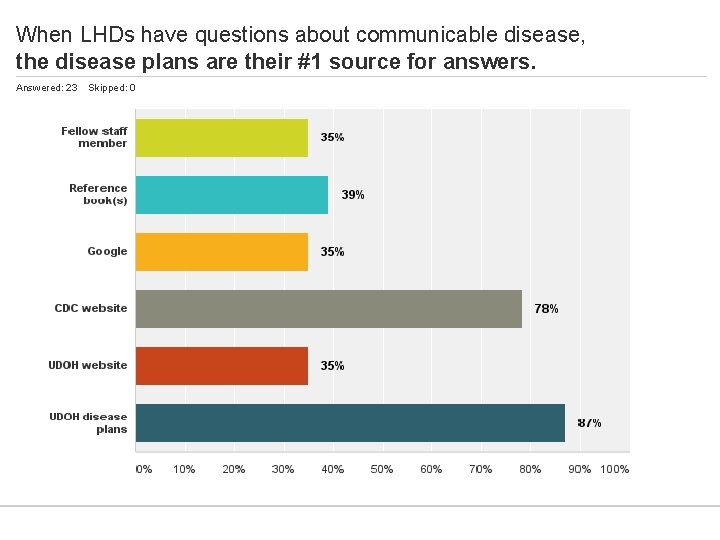
When LHDs have questions about communicable disease, the disease plans are their #1 source for answers. Answered: 23 Skipped: 0
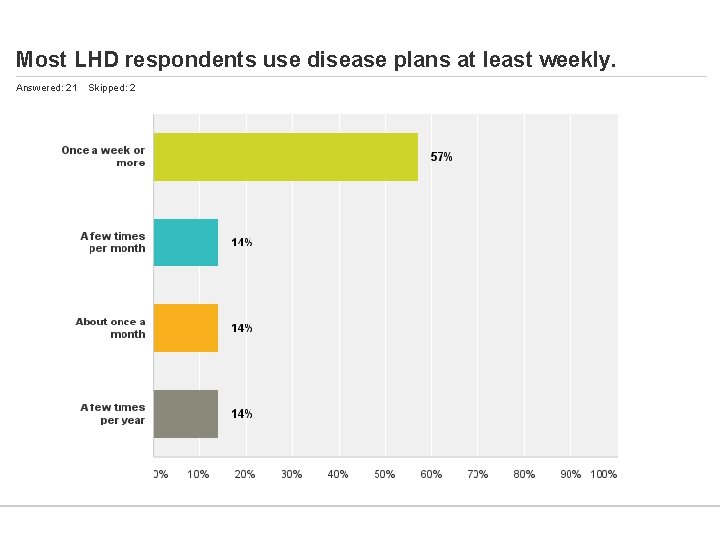
Most LHD respondents use disease plans at least weekly. Answered: 21 Skipped: 2
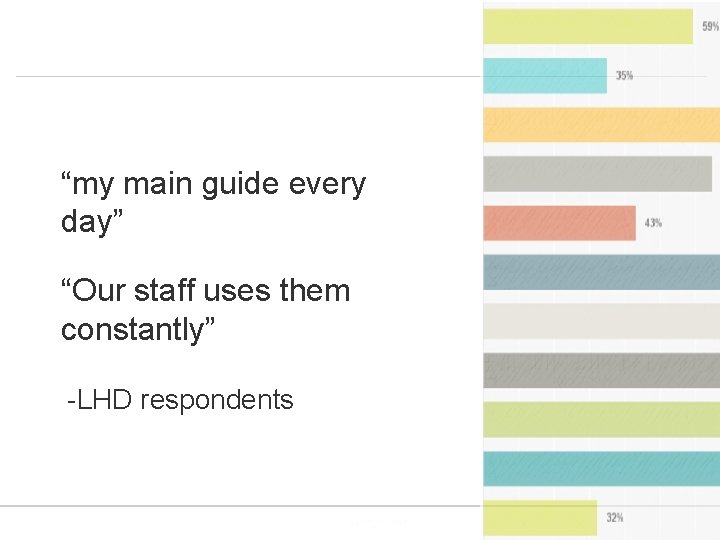
“my main guide every day” “Our staff uses them constantly” -LHD respondents Powered by
Connect to purpose
Remember the big picture…
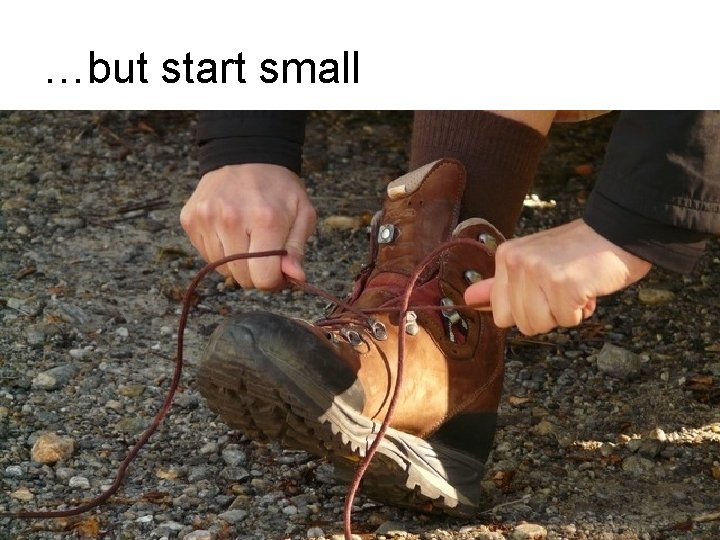
…but start small
How could you help this person “catch the vision”?
Describe the Program
Program Description
Who are you? What do you do? Why does it matter?
Example program description
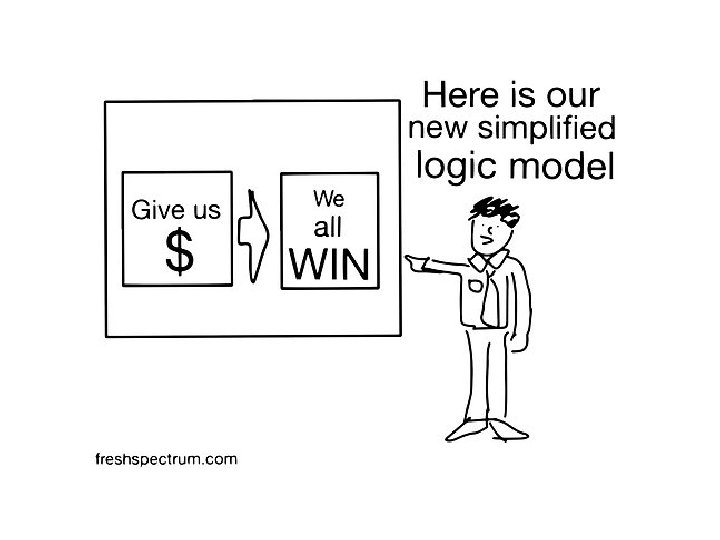
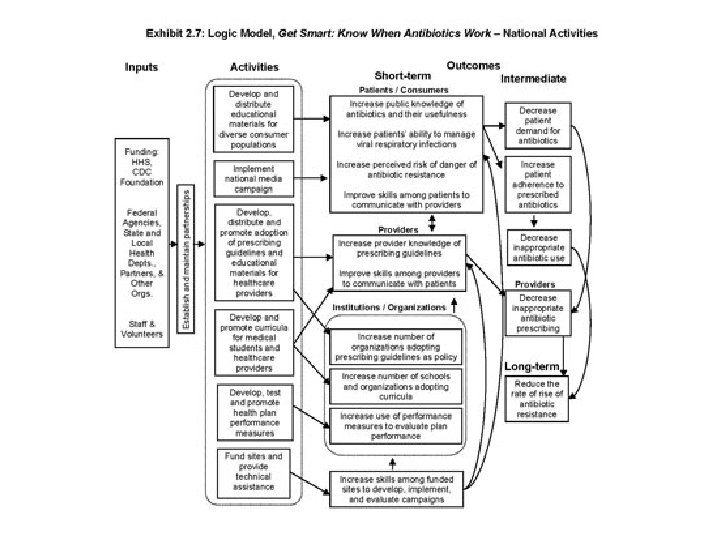
Logic Models
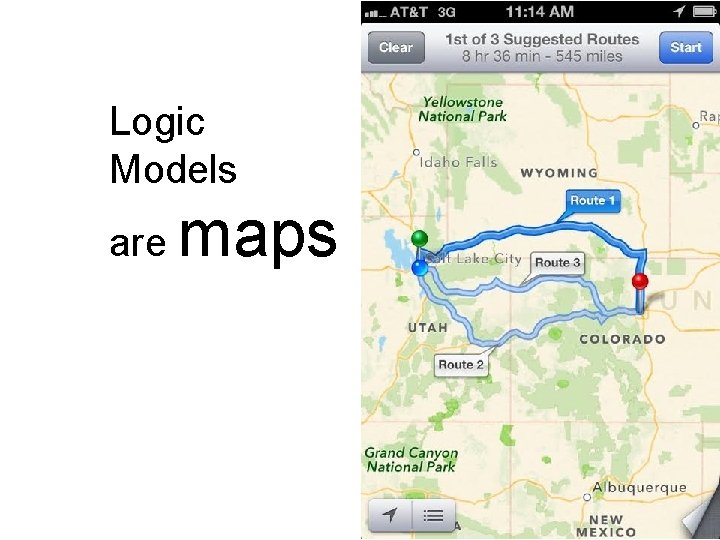
Logic Models are maps
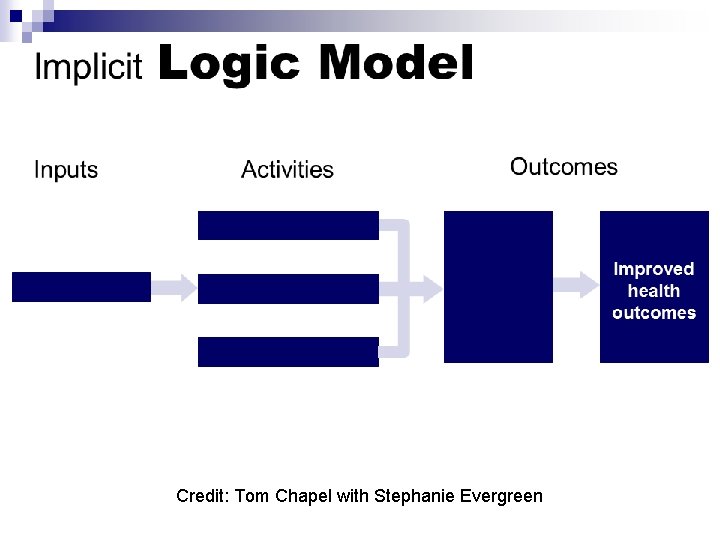
Credit: Tom Chapel with Stephanie Evergreen
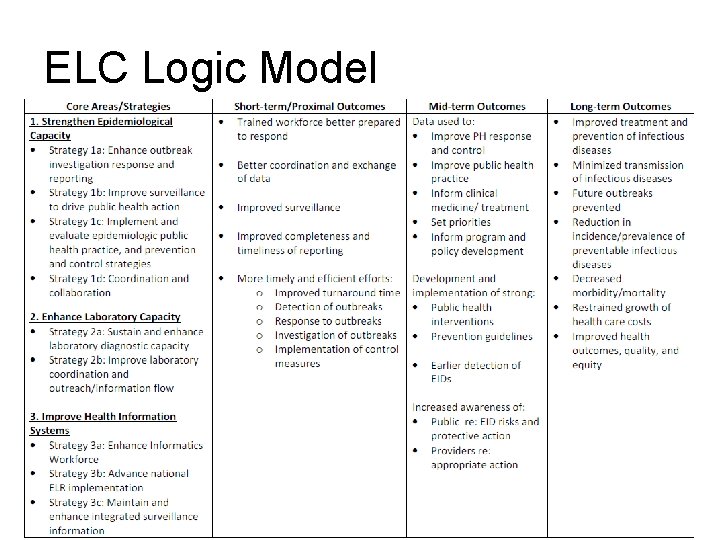
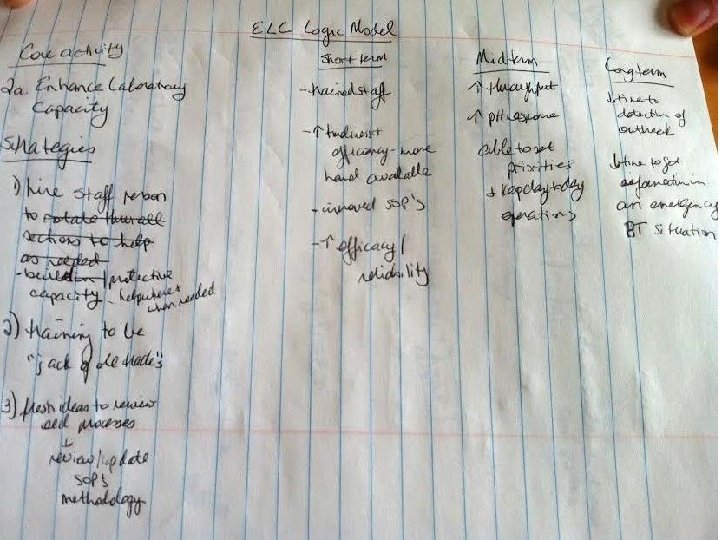
ELC Logic Model
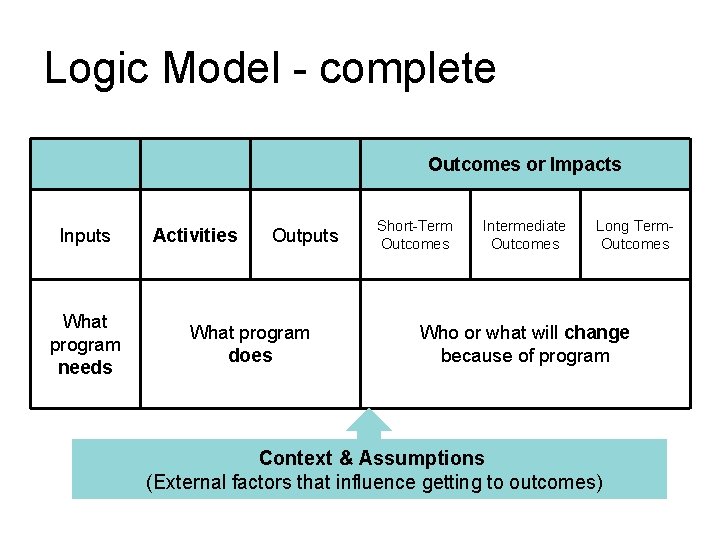
Logic Model - complete Outcomes or Impacts Inputs What program needs Activities Outputs What program does Short-Term Outcomes Intermediate Outcomes Long Term. Outcomes Who or what will change because of program Context & Assumptions (External factors that influence getting to outcomes)
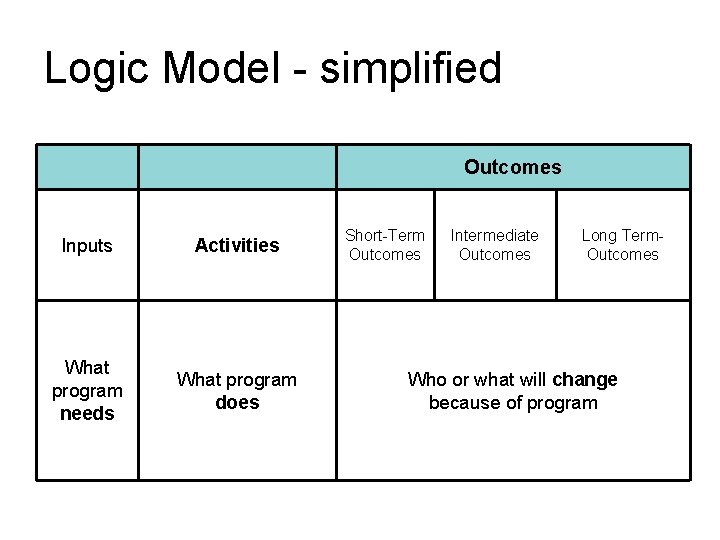
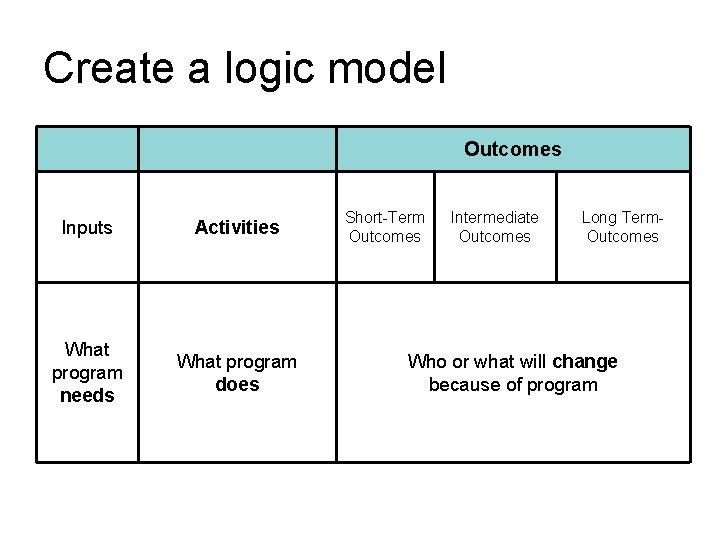
Logic Model - simplified Outcomes Inputs Activities What program needs What program does Short-Term Outcomes Intermediate Outcomes Long Term. Outcomes Who or what will change because of program
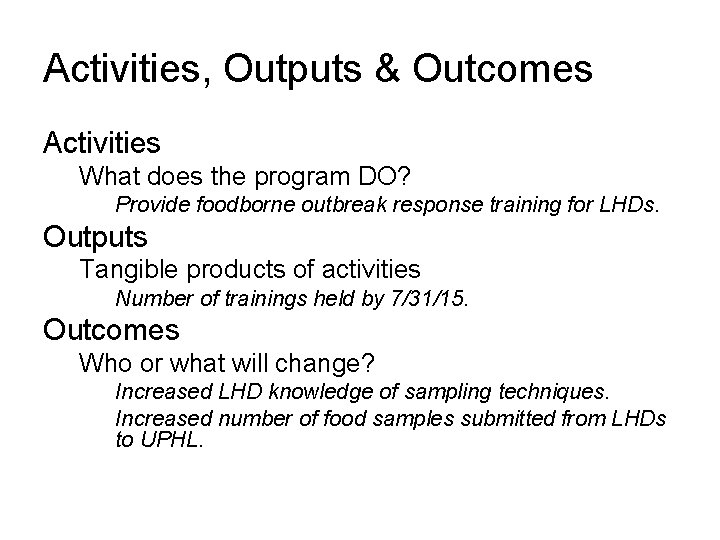
Activities, Outputs & Outcomes Activities What does the program DO? Provide foodborne outbreak response training for LHDs. Outputs Tangible products of activities Number of trainings held by 7/31/15. Outcomes Who or what will change? Increased LHD knowledge of sampling techniques. Increased number of food samples submitted from LHDs to UPHL.
Linking activities to outcomes
What do you do? (Activities) Why does it matter? (Outcomes)
Create a logic model Outcomes Inputs Activities What program needs What program does Short-Term Outcomes Intermediate Outcomes Long Term. Outcomes Who or what will change because of program
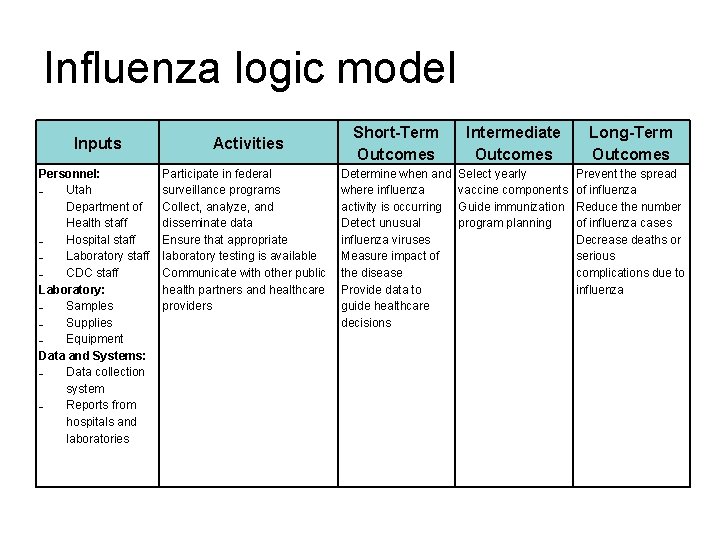
Influenza logic model Inputs Activities Personnel: – Utah Department of Health staff – Hospital staff – Laboratory staff – CDC staff Laboratory: – Samples – Supplies – Equipment Data and Systems: – Data collection system – Reports from hospitals and laboratories Participate in federal surveillance programs Collect, analyze, and disseminate data Ensure that appropriate laboratory testing is available Communicate with other public health partners and healthcare providers Short-Term Outcomes Intermediate Outcomes Determine when and Select yearly where influenza vaccine components activity is occurring Guide immunization Detect unusual program planning influenza viruses Measure impact of the disease Provide data to guide healthcare decisions Long-Term Outcomes Prevent the spread of influenza Reduce the number of influenza cases Decrease deaths or serious complications due to influenza
Focus the Evaluation Plan
Who wants to know?
What do they want to know? Why?
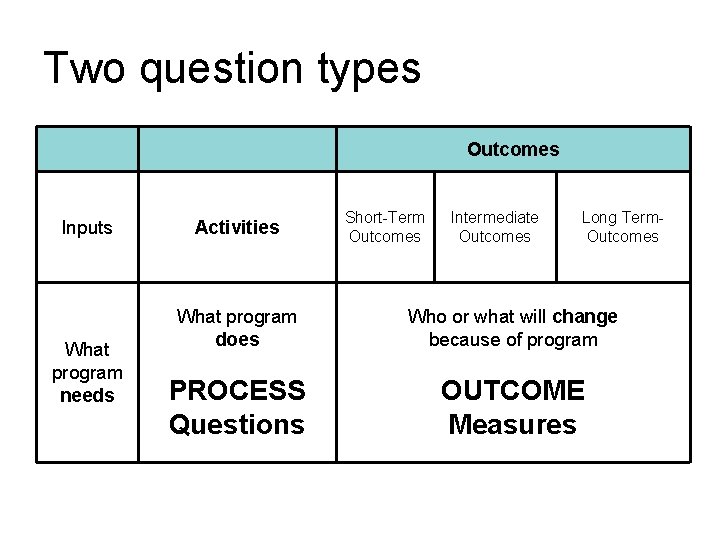
Two question types Outcomes Inputs What program needs Activities Short-Term Outcomes Intermediate Outcomes Long Term. Outcomes What program does Who or what will change because of program PROCESS Questions OUTCOME Measures
Gather Credible Evidence
Are we there yet?
Performance Measures
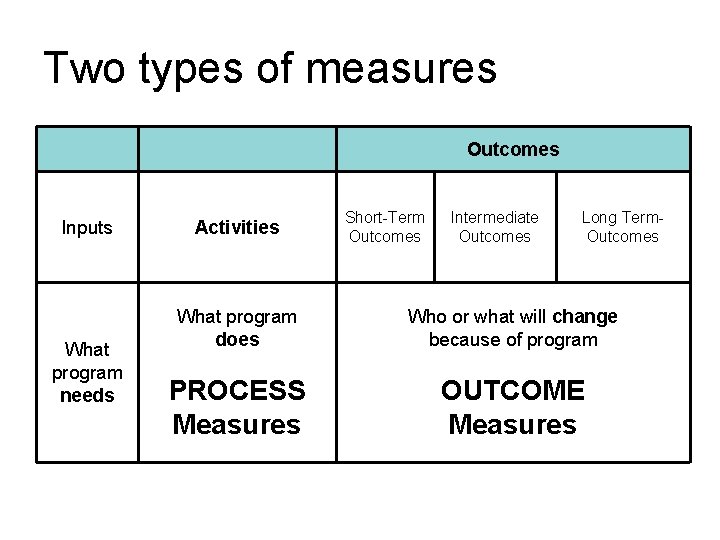
Two types of measures Outcomes Inputs What program needs Activities Short-Term Outcomes Intermediate Outcomes Long Term. Outcomes What program does Who or what will change because of program PROCESS Measures OUTCOME Measures
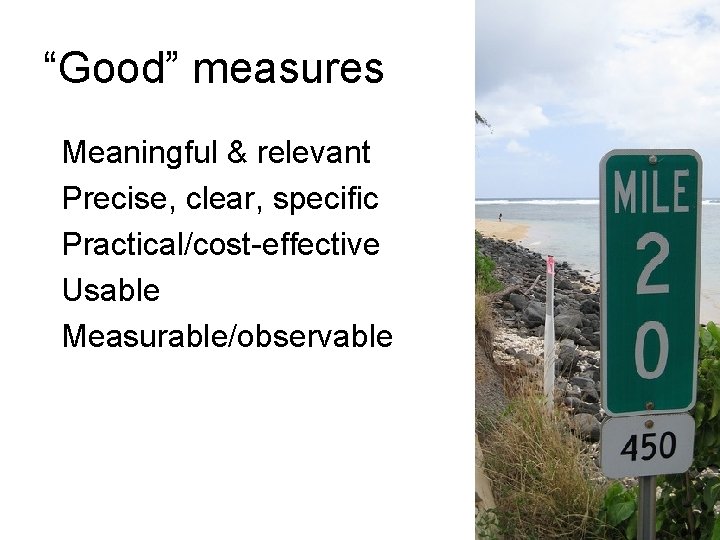
“Good” measures Meaningful & relevant Precise, clear, specific Practical/cost-effective Usable Measurable/observable
How would you improve these measures?
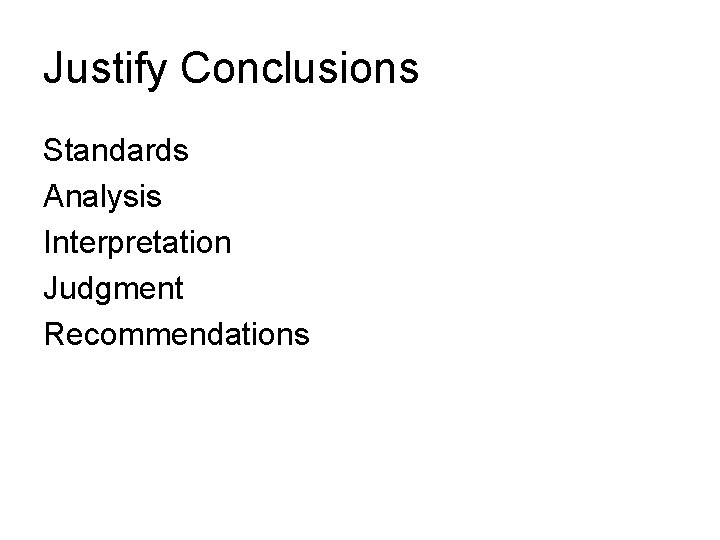
Justify Conclusions
Justify Conclusions Standards Analysis Interpretation Judgment Recommendations
Step 6: Ensure Use & Share Lessons Learned
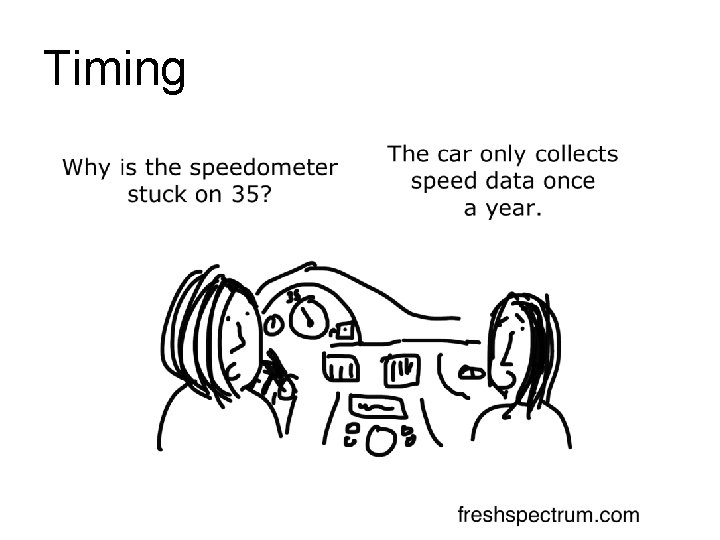
Timing
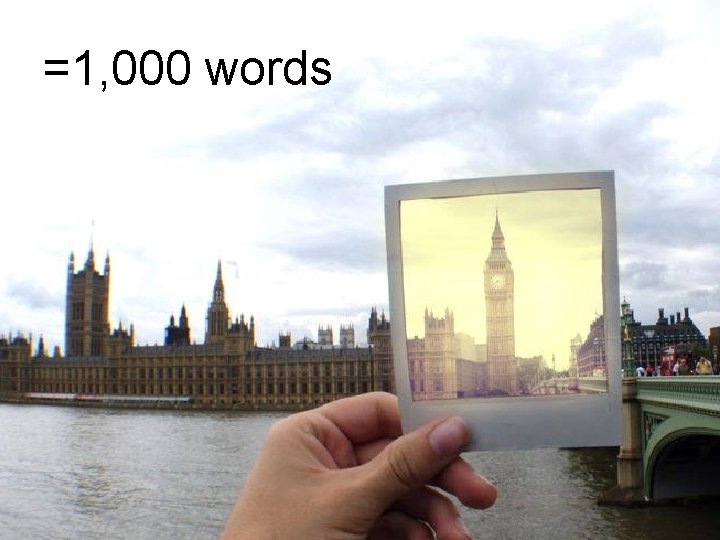
=1, 000 words
Instant gratification
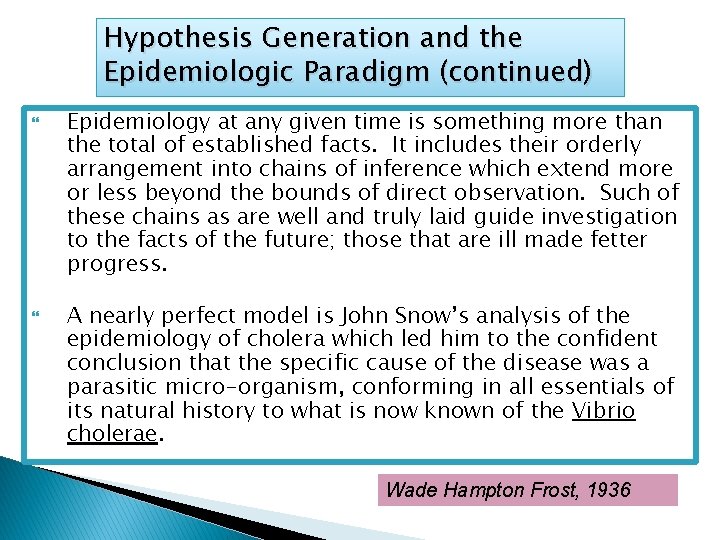
Hypothesis Generation and the Epidemiologic Paradigm (continued) Epidemiology at any given time is something more than the total of established facts. It includes their orderly arrangement into chains of inference which extend more or less beyond the bounds of direct observation. Such of these chains as are well and truly laid guide investigation to the facts of the future; those that are ill made fetter progress. A nearly perfect model is John Snow’s analysis of the epidemiology of cholera which led him to the confident conclusion that the specific cause of the disease was a parasitic micro-organism, conforming in all essentials of its natural history to what is now known of the Vibrio cholerae. Wade Hampton Frost, 1936
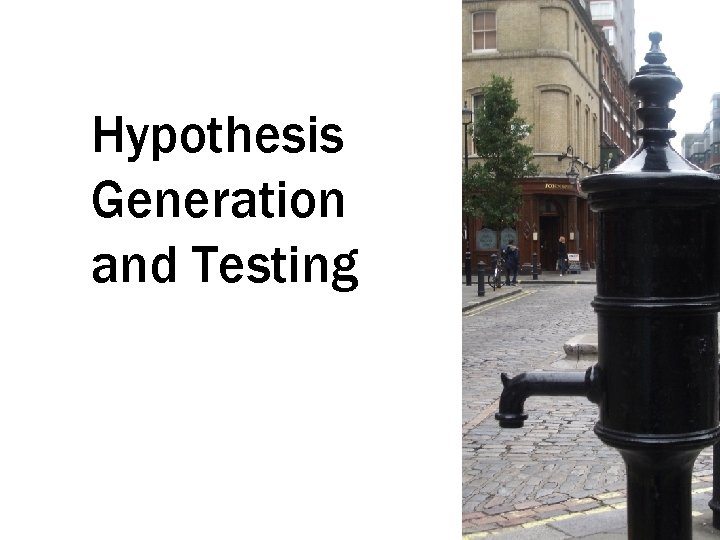
Hypothesis Generation and Testing
Share “before & after”
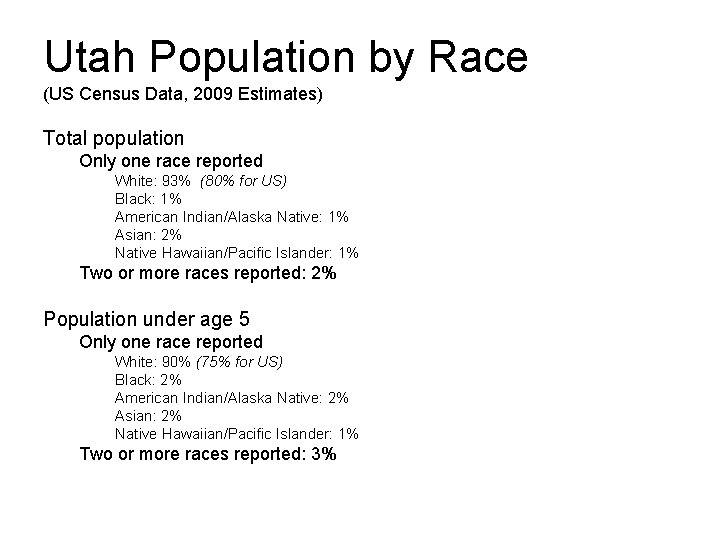
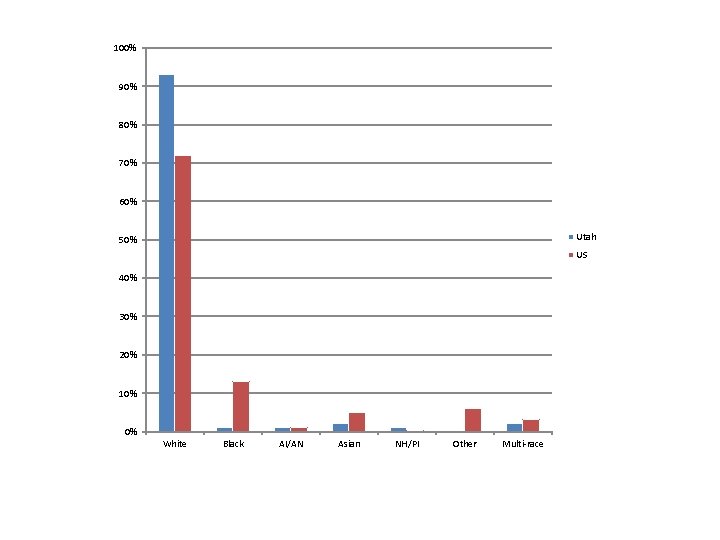
Utah Population by Race (US Census Data, 2009 Estimates) Total population Only one race reported White: 93% (80% for US) Black: 1% American Indian/Alaska Native: 1% Asian: 2% Native Hawaiian/Pacific Islander: 1% Two or more races reported: 2% Population under age 5 Only one race reported White: 90% (75% for US) Black: 2% American Indian/Alaska Native: 2% Asian: 2% Native Hawaiian/Pacific Islander: 1% Two or more races reported: 3%
100% 90% 80% 70% 60% Utah 50% US 40% 30% 20% 10% 0% White Black AI/AN Asian NH/PI Other Multi-race
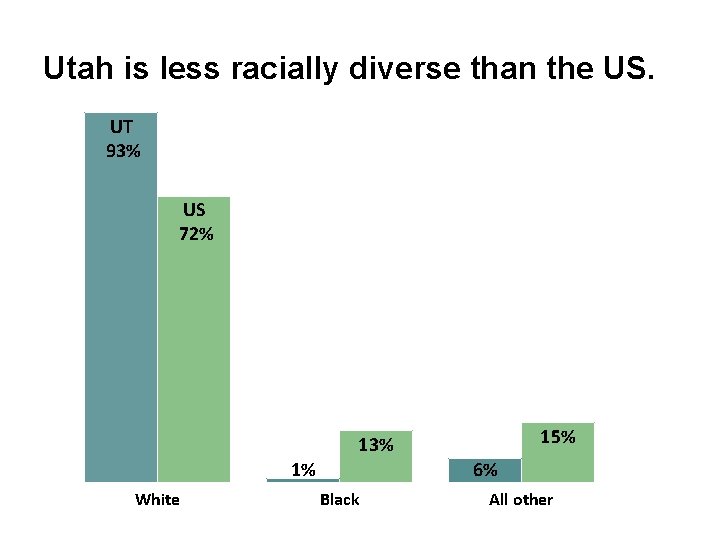
Utah is less racially diverse than the US. UT 93% US 72% 15% 13% 1% White 6% Black All other
Generate excitement
What will YOU do to help others “catch the vision”? Value & enjoy evaluation Create logic models Improve performance measures
Enjoy the journey!